| Param | Original file | Final file |
|---|---|---|
| Filename | modeM0/AS1A04_103T01_9000001988_13433cztM0_level2.evt | modeM0/AS1A04_103T01_9000001988_13433cztM0_level2_quad_clean.evt |
| Size (bytes) | 455,866,560 | 90,521,280 |
| Size | 434.7 MB | 86.3 MB |
| Events in quadrant A | 3,043,056 | 590,571 |
| Events in quadrant B | 3,153,826 | 602,663 |
| Events in quadrant C | 3,064,578 | 580,567 |
| Events in quadrant D | 4,127,471 | 538,933 |
| Mode M0 | |||
|---|---|---|---|
| Quadrant | BADHDUFLAG | Total packets | Discarded packets |
| A | 0 | 12953 | 3 |
| B | 0 | 13260 | 2 |
| C | 0 | 13053 | 2 |
| D | 0 | 16479 | 2 |
| Mode SS | |||
|---|---|---|---|
| Quadrant | BADHDUFLAG | Total packets | Discarded packets |
| A | 0 | 126 | 0 |
| B | 0 | 126 | 0 |
| C | 0 | 126 | 0 |
| D | 0 | 126 | 0 |
| Mode M9 | |||
|---|---|---|---|
| Quadrant | BADHDUFLAG | Total packets | Discarded packets |
| A | 0 | 24 | 0 |
| B | 0 | 24 | 0 |
| C | 0 | 24 | 0 |
| D | 0 | 24 | 0 |
| Quadrant | Total seconds | Saturated seconds | Saturation percentage |
|---|---|---|---|
| A | 6134 | 44 | 0.717313% |
| B | 6134 | 73 | 1.190088% |
| C | 6134 | 54 | 0.880339% |
| D | 6134 | 432 | 7.042713% |
Noise dominated data is calculated using 1-second bins in cleaned event files. If a bin has >2000 counts, and if more than 50% of those come from <1% of pixels, then it is considered to be noise-dominated and hence unusable.
| Quadrant | # 1 sec bins | Bins with >0 counts | Bins with >2000 counts | High rate bins dominated by noise | Noise dominated (total time) | Noise dominated (detector-on time) | Marked lightcurve |
|---|---|---|---|---|---|---|---|
| A | 7430 | 6135 | 4 | 4 | 0.05% | 0.07% |  |
| B | 7430 | 6135 | 5 | 5 | 0.07% | 0.08% | 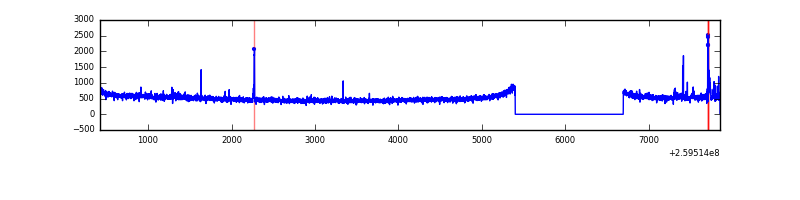 |
| C | 7430 | 6136 | 14 | 14 | 0.19% | 0.23% | 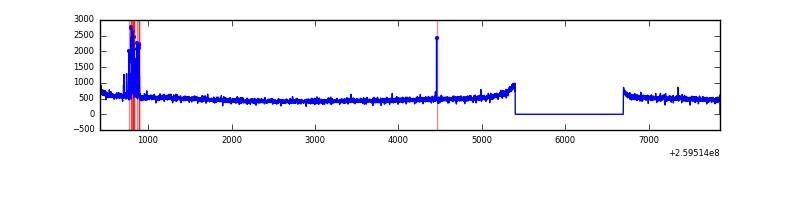 |
| D | 7430 | 6135 | 307 | 307 | 4.13% | 5.00% | 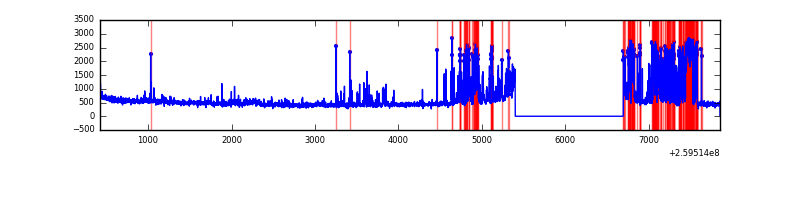 |
Top three noisy pixels from each quadrant. If the there are fewer than three noisy pixels in the level2.evt file, extra rows are filled as -1
| Pixel properties | Quadrant properties | ||||||
|---|---|---|---|---|---|---|---|
| Quadrant | DetID | PixID | Counts | Sigma | Mean | Median | Sigma |
| A | 15 | 69 | 17700 | 107.82 | 784 | 770 | 157.0 |
| A | 1 | 162 | 8460 | 48.97 | 784 | 770 | 157.0 |
| A | 0 | 226 | 7054 | 40.02 | 784 | 770 | 157.0 |
| B | 0 | 230 | 26590 | 173.73 | 785 | 769 | 148.6 |
| B | 4 | 142 | 26257 | 171.49 | 785 | 769 | 148.6 |
| B | 12 | 111 | 16530 | 106.04 | 785 | 769 | 148.6 |
| C | 14 | 234 | 77771 | 444.27 | 751 | 756 | 173.4 |
| C | 3 | 233 | 54495 | 310.0 | 751 | 756 | 173.4 |
| C | 13 | 61 | 5384 | 26.7 | 751 | 756 | 173.4 |
| D | 13 | 249 | 1281342 | 7478.5 | 722 | 703 | 171.2 |
| D | 8 | 195 | 94407 | 547.2 | 722 | 703 | 171.2 |
| D | 2 | 234 | 21531 | 121.63 | 722 | 703 | 171.2 |
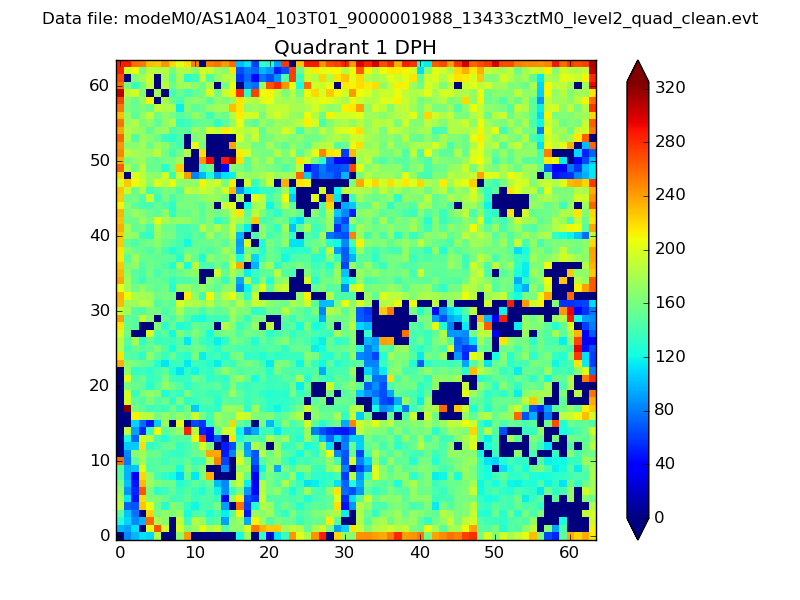
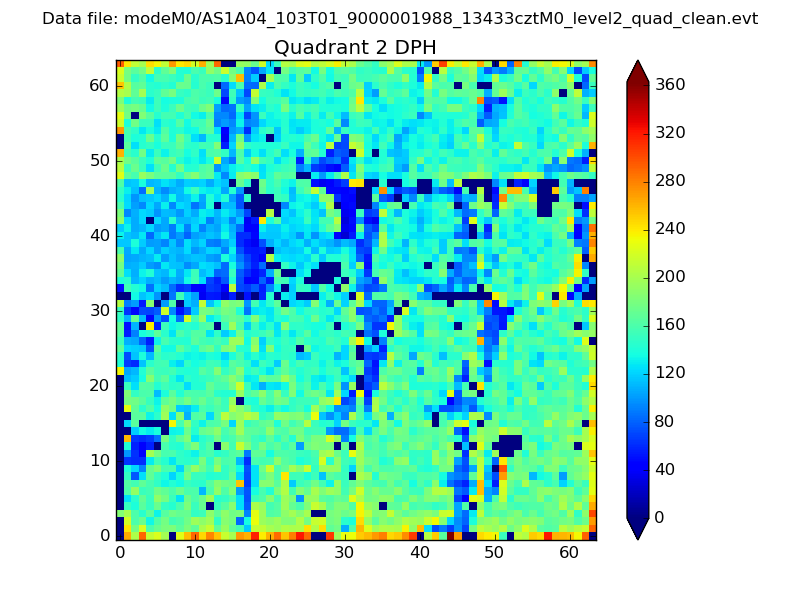
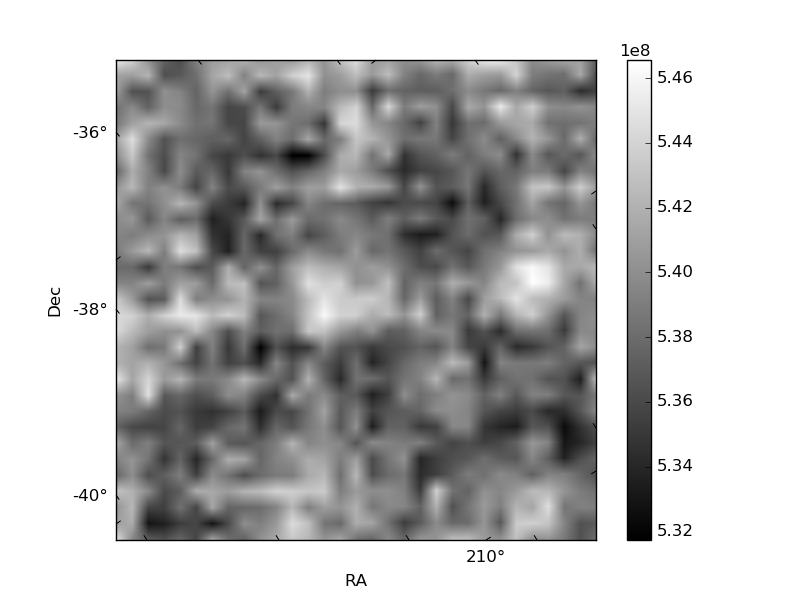
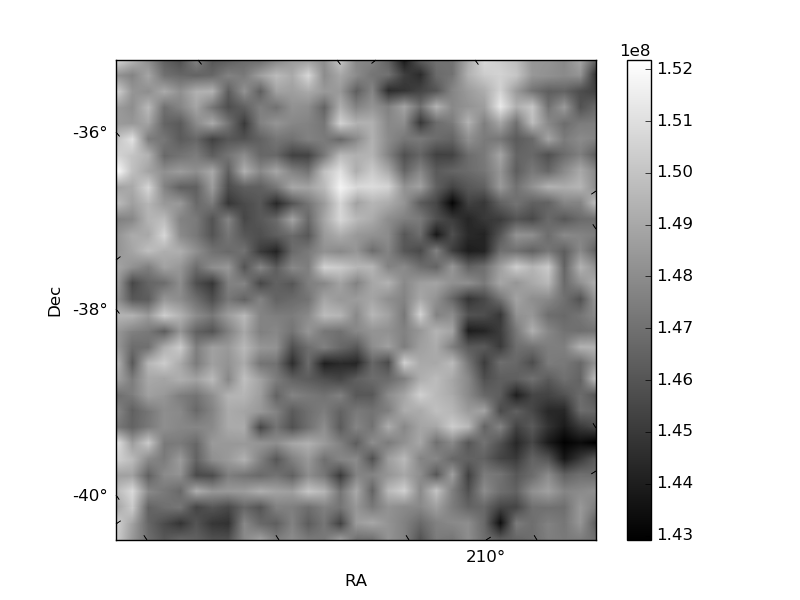
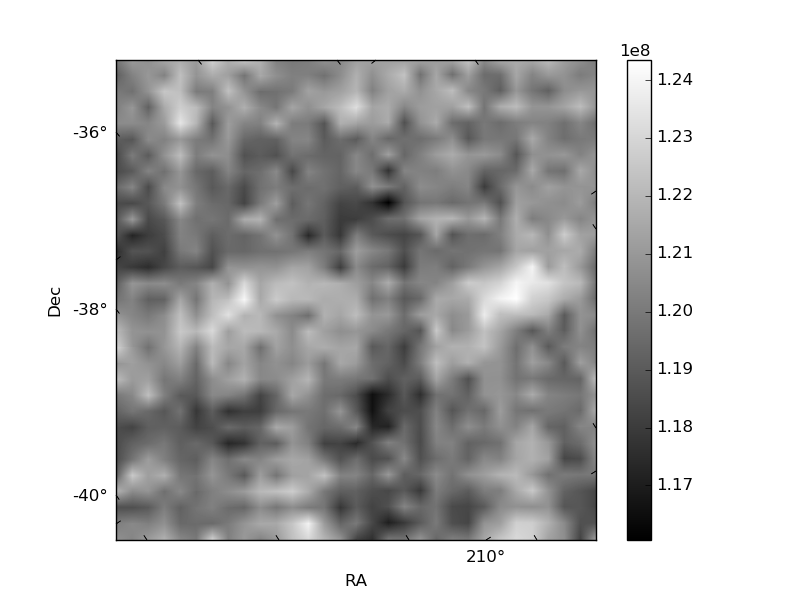
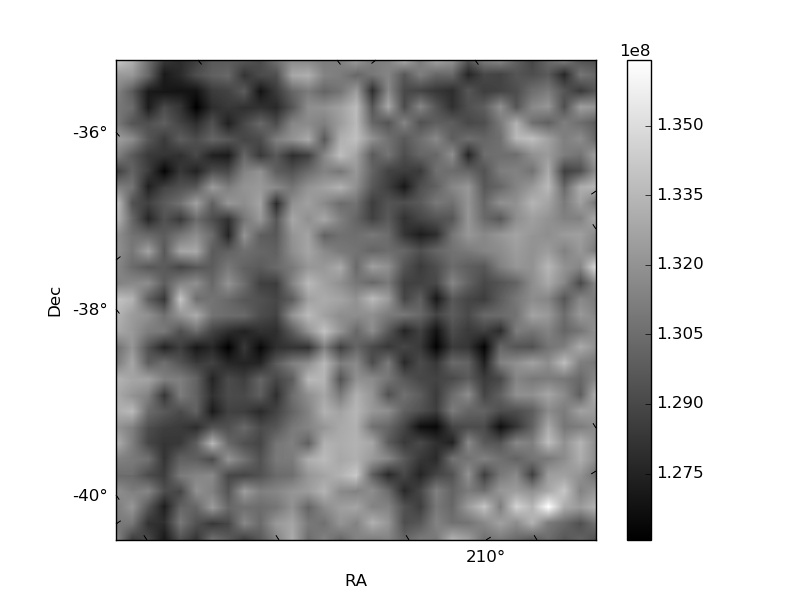
Histogram calculated using DETX and DETY for each event in the final _common_clean file
| Quadrant A | 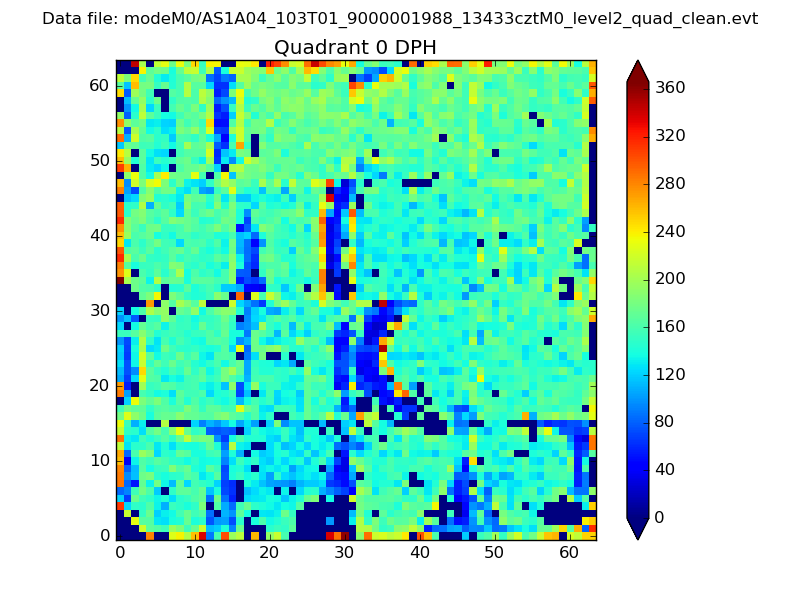 |
 |
Quadrant B |
|---|---|---|---|
| Quadrant D | 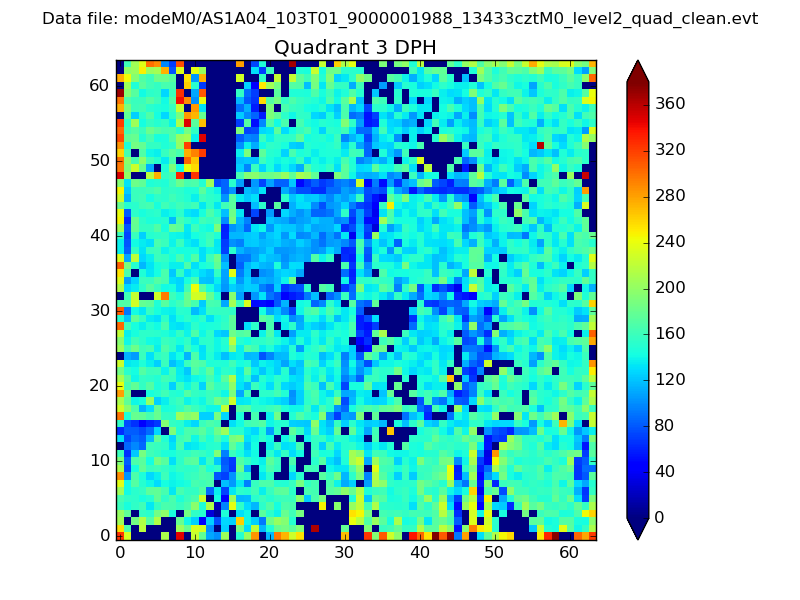 |
 |
Quadrant C |
| Plot type | Count rate plots | Images |
|---|---|---|
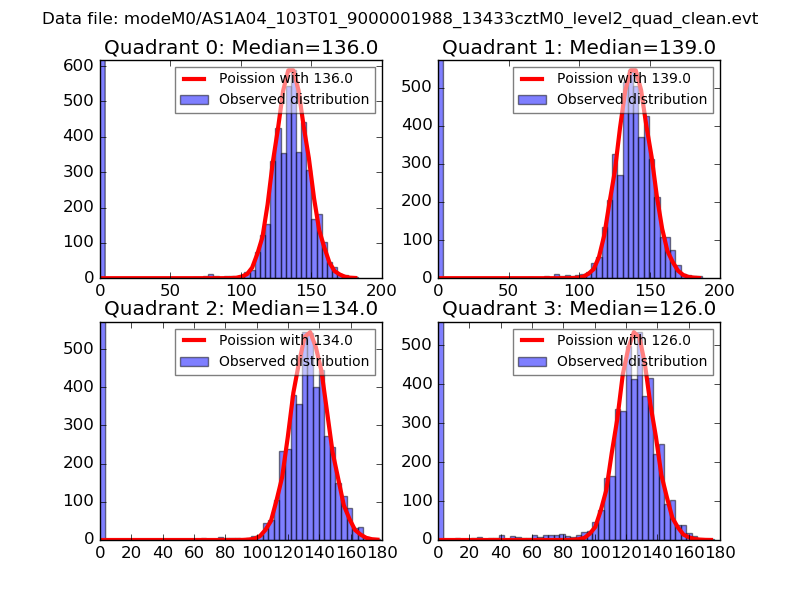
| Comparison with Poisson distribution Blue bars denote a histogram of data divided into 1 sec bins. Red curve is a Poisson curve with rate = median count rate of data. |
 |
 |
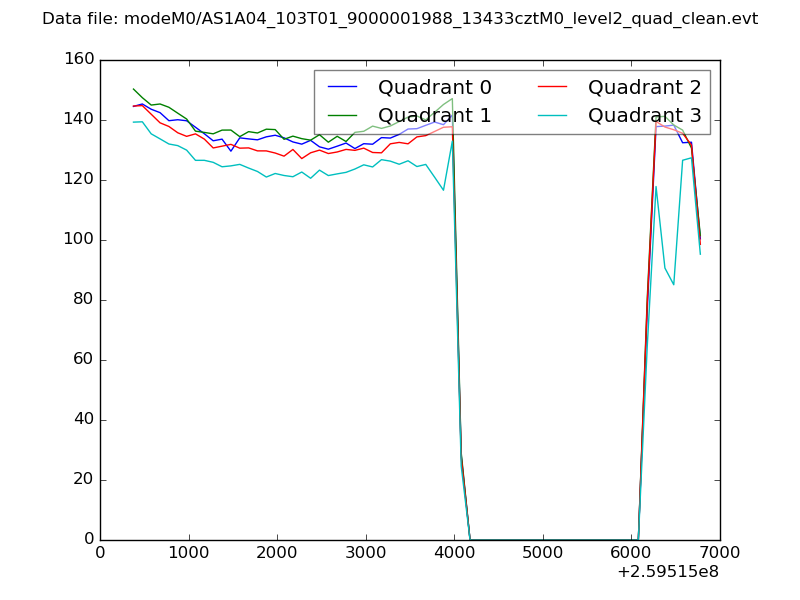
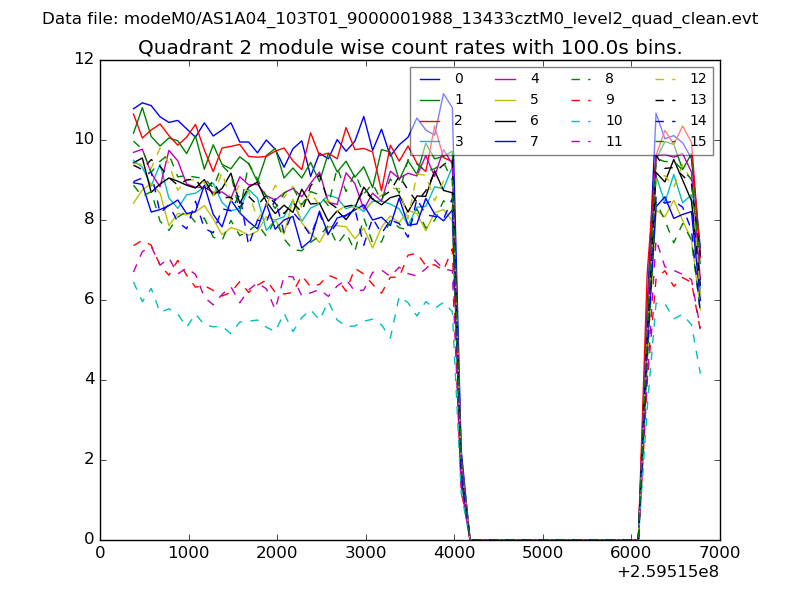
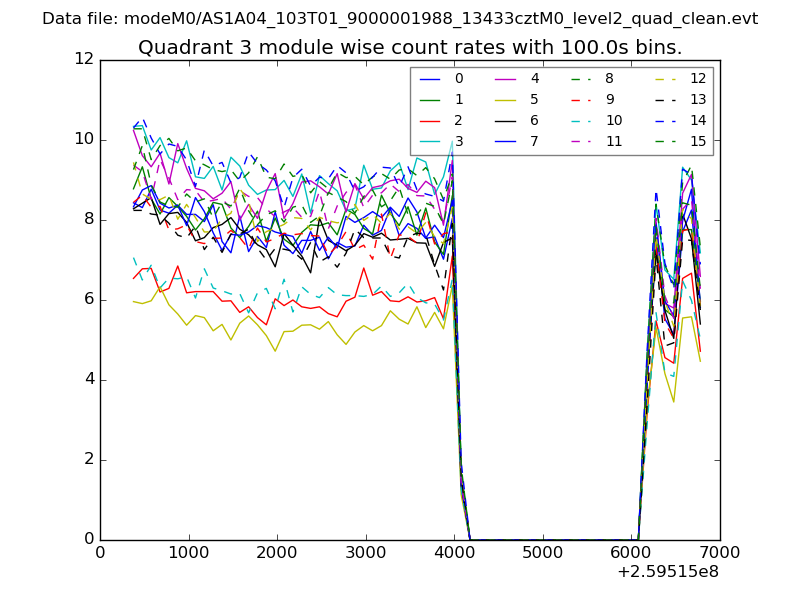
| Quadrant-wise count rates Data is divided into 100 sec bins |
 |
|
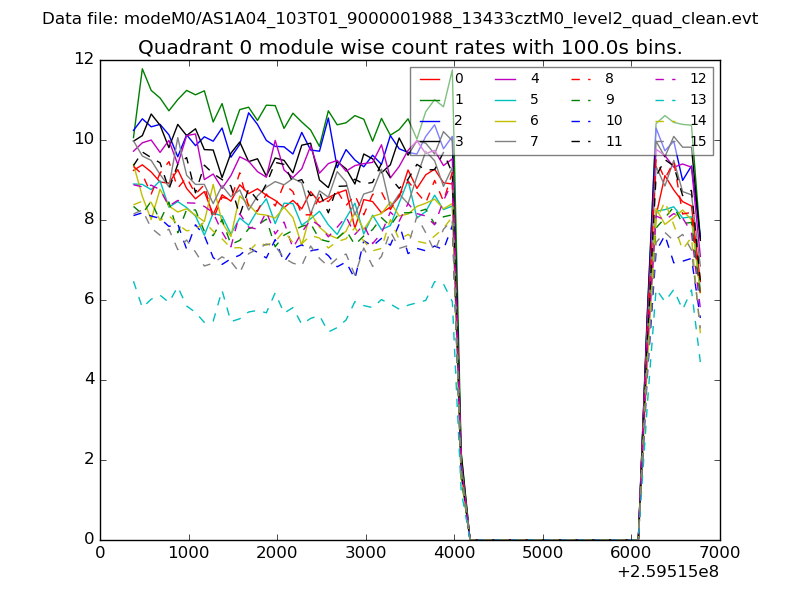
| Module-wise count rates for Quadrant A Data is divided into 100 sec bins |
 |
 |
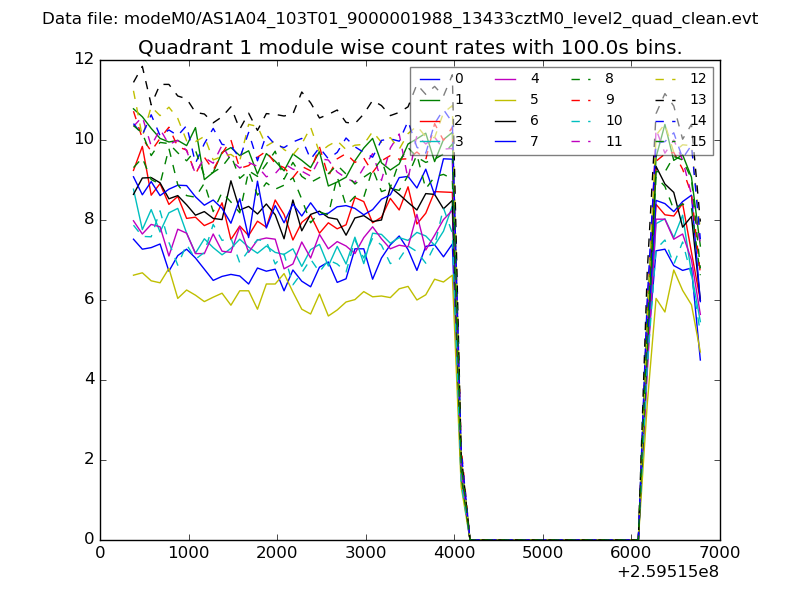
| Module-wise count rates for Quadrant B Data is divided into 100 sec bins |
 |
 |
| Module-wise count rates for Quadrant C Data is divided into 100 sec bins |
 |
 |
| Module-wise count rates for Quadrant D Data is divided into 100 sec bins |
 |
 |
| Parameter | Plot |
|---|---|
| CZT HV Monitor |  |
| D_VDD | 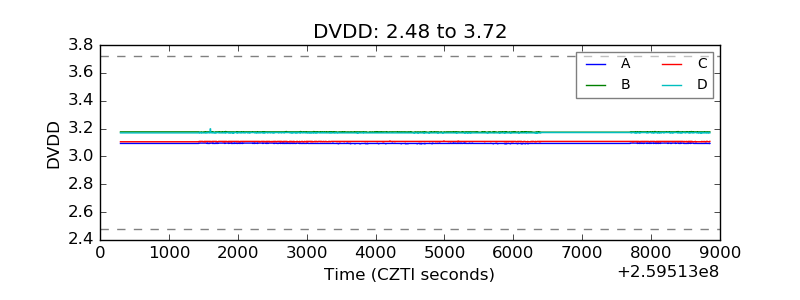 |
| Temperature 1 | 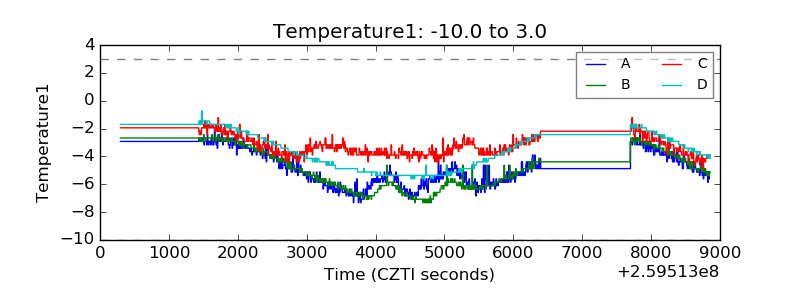 |
| Veto HV Monitor | 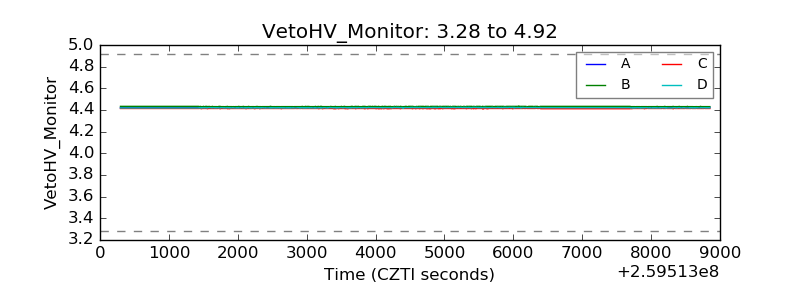 |
| Veto LLD | 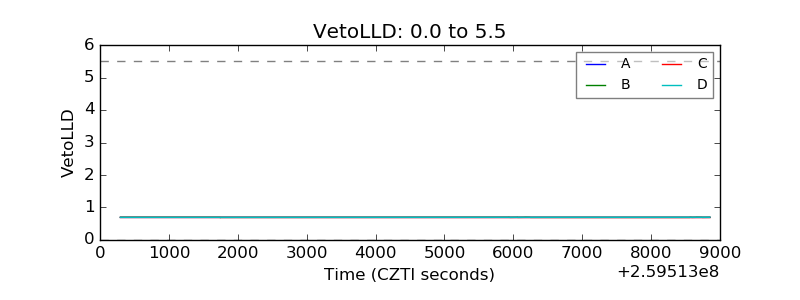 |
| Alpha Counter | 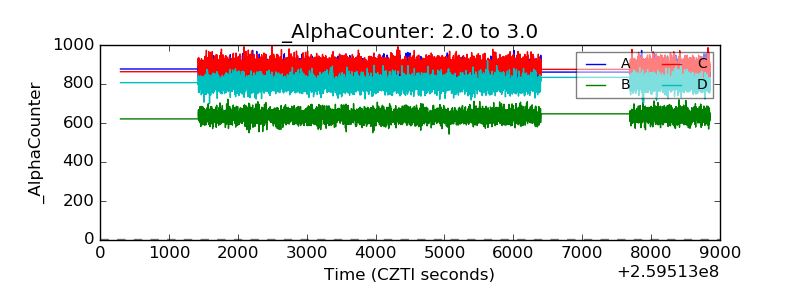 |
| _CPM_Rate | 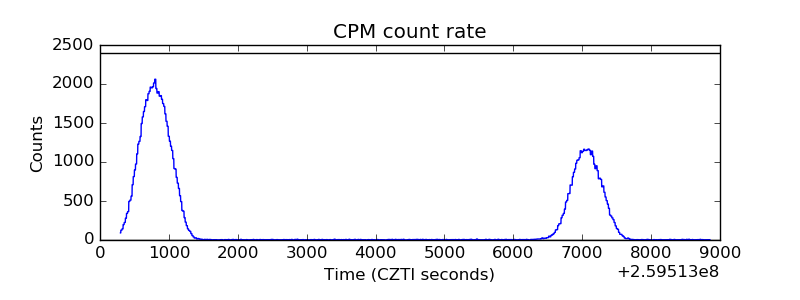 |
| CZT Counter | 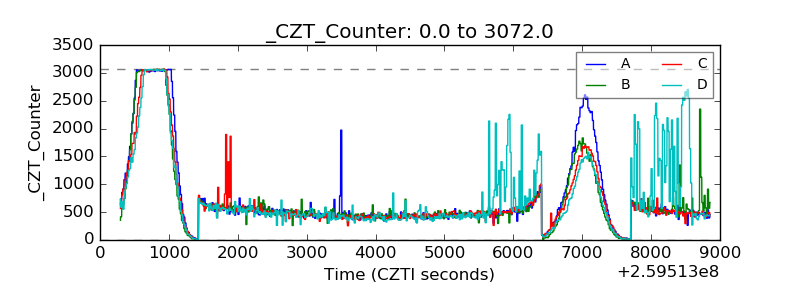 |
| +2.5 Volts monitor |  |
| +5 Volts monitor |  |
| _ROLL_ROT | 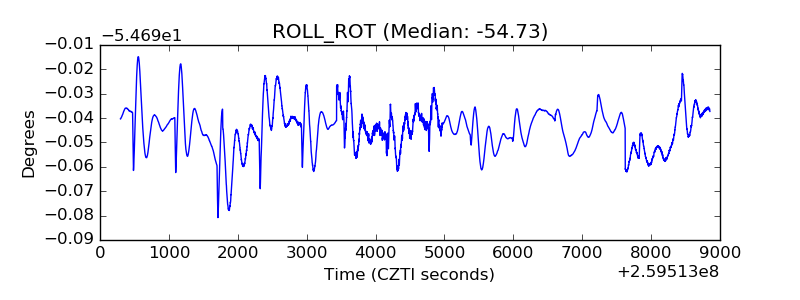 |
| _Roll_DEC | 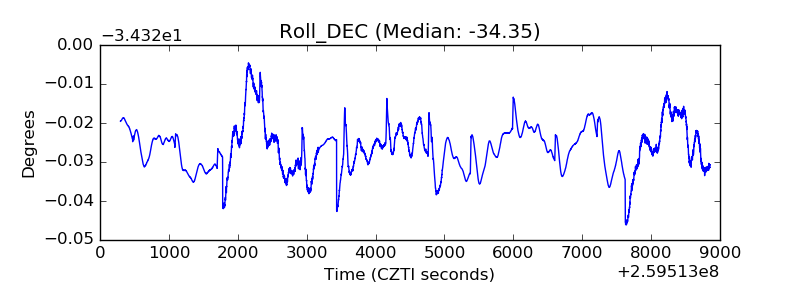 |
| _Roll_RA | 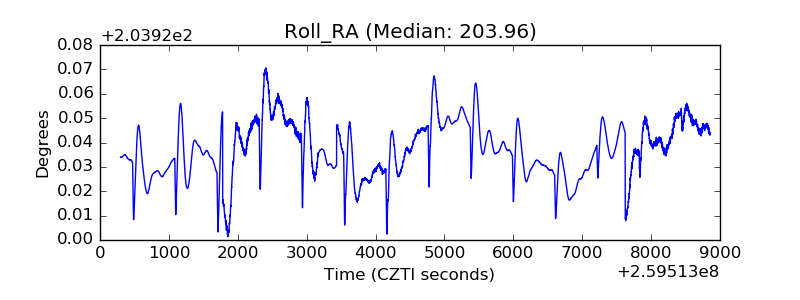 |
| Veto Counter | 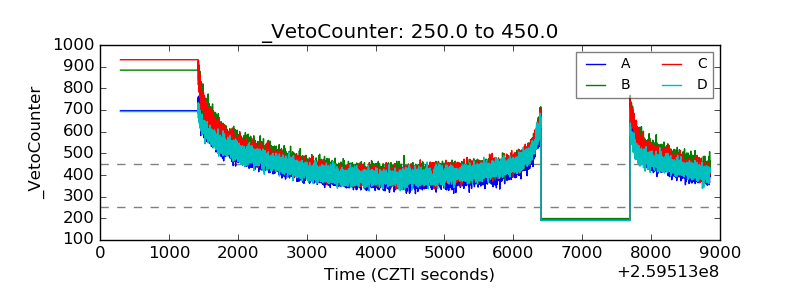 |