| Param | Original file | Final file |
|---|---|---|
| Filename | modeM0/AS1A04_103T01_9000001988_13434cztM0_level2.evt | modeM0/AS1A04_103T01_9000001988_13434cztM0_level2_quad_clean.evt |
| Size (bytes) | 496,062,720 | 94,723,200 |
| Size | 473.1 MB | 90.3 MB |
| Events in quadrant A | 3,145,719 | 614,431 |
| Events in quadrant B | 3,405,560 | 627,287 |
| Events in quadrant C | 3,136,856 | 607,613 |
| Events in quadrant D | 4,889,714 | 561,811 |
| Mode M0 | |||
|---|---|---|---|
| Quadrant | BADHDUFLAG | Total packets | Discarded packets |
| A | 0 | 13697 | 3 |
| B | 0 | 14422 | 2 |
| C | 0 | 13663 | 2 |
| D | 0 | 18971 | 2 |
| Mode SS | |||
|---|---|---|---|
| Quadrant | BADHDUFLAG | Total packets | Discarded packets |
| A | 0 | 136 | 0 |
| B | 0 | 136 | 0 |
| C | 0 | 136 | 0 |
| D | 0 | 136 | 0 |
| Mode M9 | |||
|---|---|---|---|
| Quadrant | BADHDUFLAG | Total packets | Discarded packets |
| A | 0 | 23 | 0 |
| B | 0 | 23 | 0 |
| C | 0 | 23 | 0 |
| D | 0 | 23 | 0 |
| Quadrant | Total seconds | Saturated seconds | Saturation percentage |
|---|---|---|---|
| A | 6555 | 47 | 0.717010% |
| B | 6555 | 116 | 1.769641% |
| C | 6555 | 36 | 0.549199% |
| D | 6555 | 514 | 7.841342% |
Noise dominated data is calculated using 1-second bins in cleaned event files. If a bin has >2000 counts, and if more than 50% of those come from <1% of pixels, then it is considered to be noise-dominated and hence unusable.
| Quadrant | # 1 sec bins | Bins with >0 counts | Bins with >2000 counts | High rate bins dominated by noise | Noise dominated (total time) | Noise dominated (detector-on time) | Marked lightcurve |
|---|---|---|---|---|---|---|---|
| A | 8921 | 6557 | 1 | 1 | 0.01% | 0.02% | 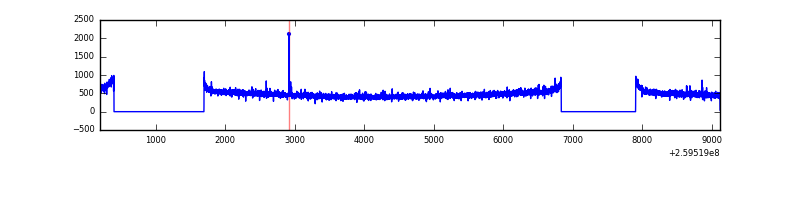 |
| B | 8921 | 6557 | 20 | 20 | 0.22% | 0.31% | 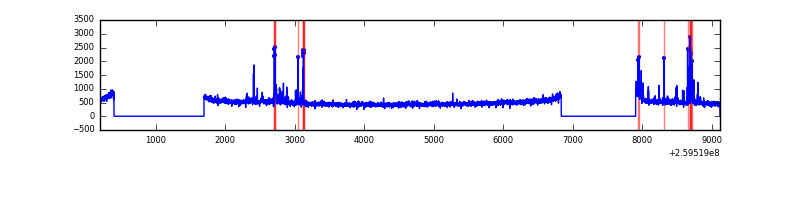 |
| C | 8921 | 6558 | 0 | 0 | 0.00% | 0.00% | 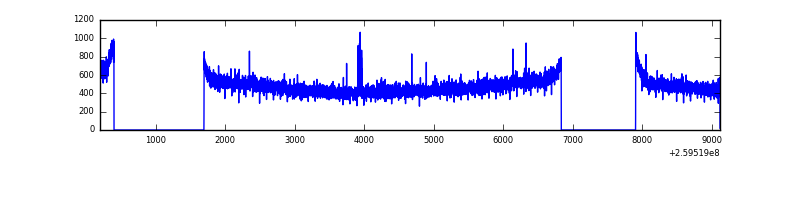 |
| D | 8921 | 6557 | 409 | 409 | 4.58% | 6.24% | 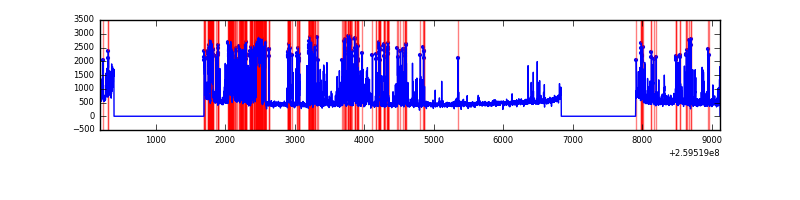 |
Top three noisy pixels from each quadrant. If the there are fewer than three noisy pixels in the level2.evt file, extra rows are filled as -1
| Pixel properties | Quadrant properties | ||||||
|---|---|---|---|---|---|---|---|
| Quadrant | DetID | PixID | Counts | Sigma | Mean | Median | Sigma |
| A | 1 | 162 | 16077 | 93.54 | 809 | 794 | 163.4 |
| A | 0 | 226 | 7388 | 40.36 | 809 | 794 | 163.4 |
| A | 15 | 69 | 6651 | 35.85 | 809 | 794 | 163.4 |
| B | 4 | 142 | 127170 | 822.42 | 814 | 792 | 153.7 |
| B | 4 | 173 | 25363 | 159.9 | 814 | 792 | 153.7 |
| B | 10 | 245 | 23155 | 145.53 | 814 | 792 | 153.7 |
| C | 3 | 233 | 63897 | 345.83 | 785 | 788 | 182.5 |
| C | 14 | 220 | 10250 | 51.85 | 785 | 788 | 182.5 |
| C | 13 | 61 | 5714 | 26.99 | 785 | 788 | 182.5 |
| D | 13 | 249 | 1943898 | 10841.75 | 749 | 729 | 179.2 |
| D | 2 | 136 | 59650 | 328.74 | 749 | 729 | 179.2 |
| D | 8 | 195 | 56677 | 312.16 | 749 | 729 | 179.2 |
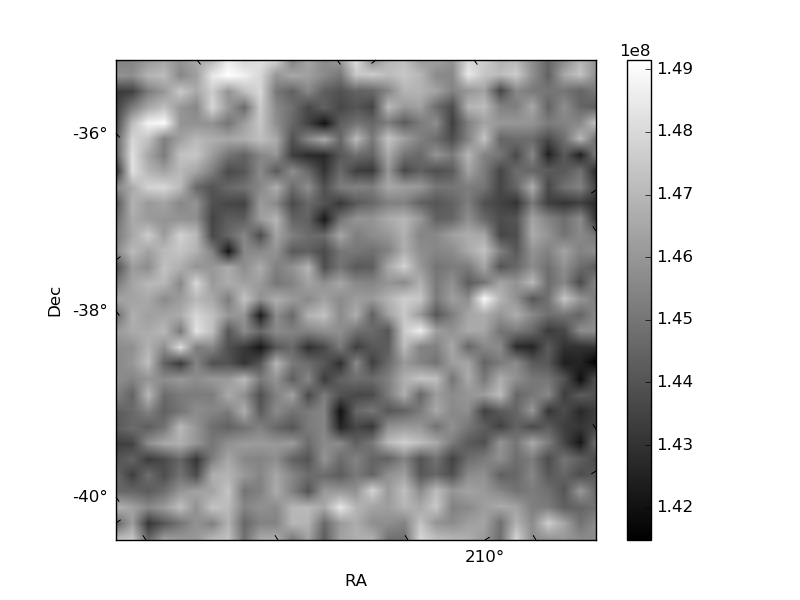
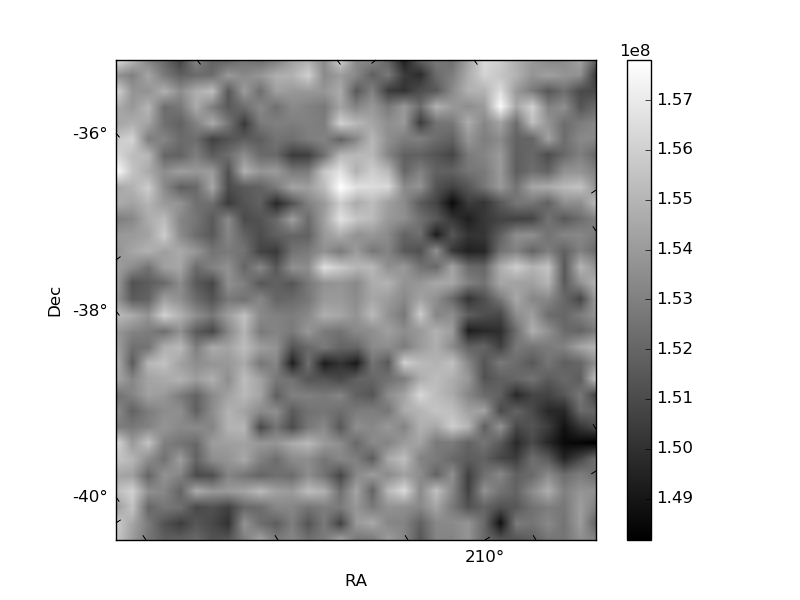
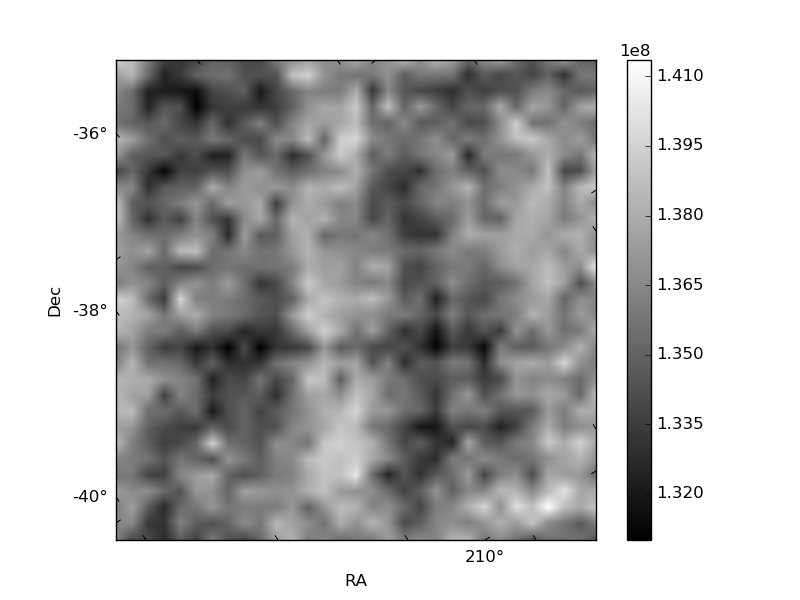
Histogram calculated using DETX and DETY for each event in the final _common_clean file
| Quadrant A | 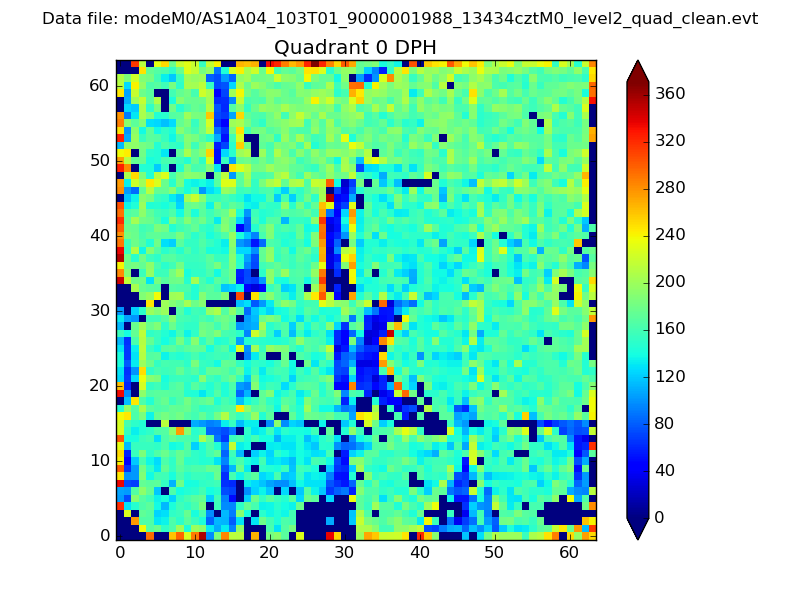 |
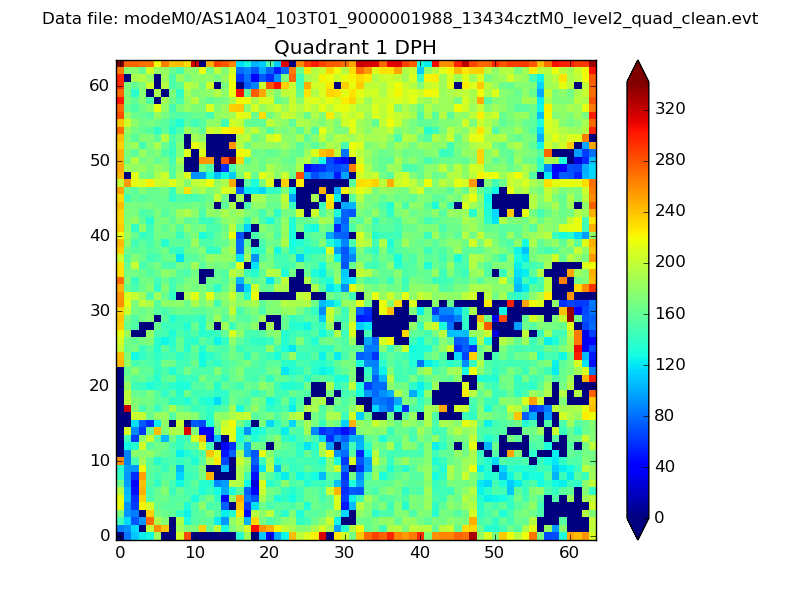 |
Quadrant B |
|---|---|---|---|
| Quadrant D | 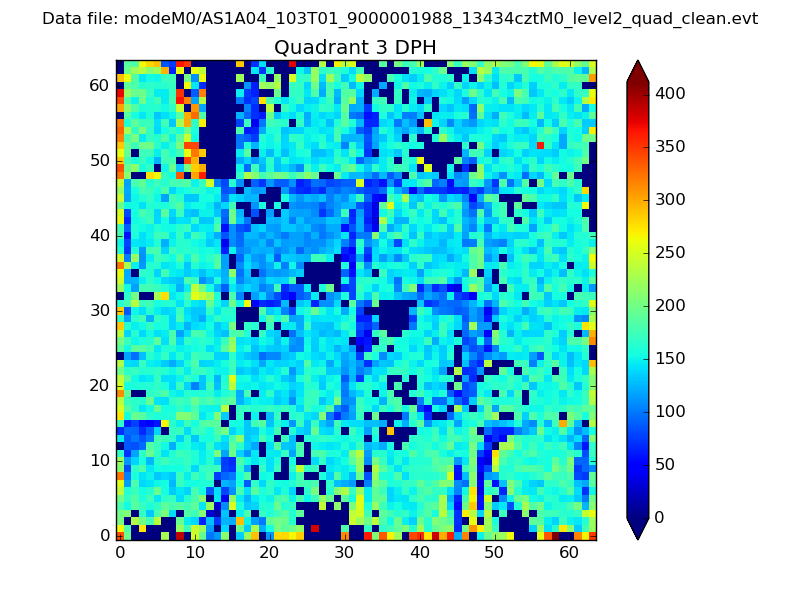 |
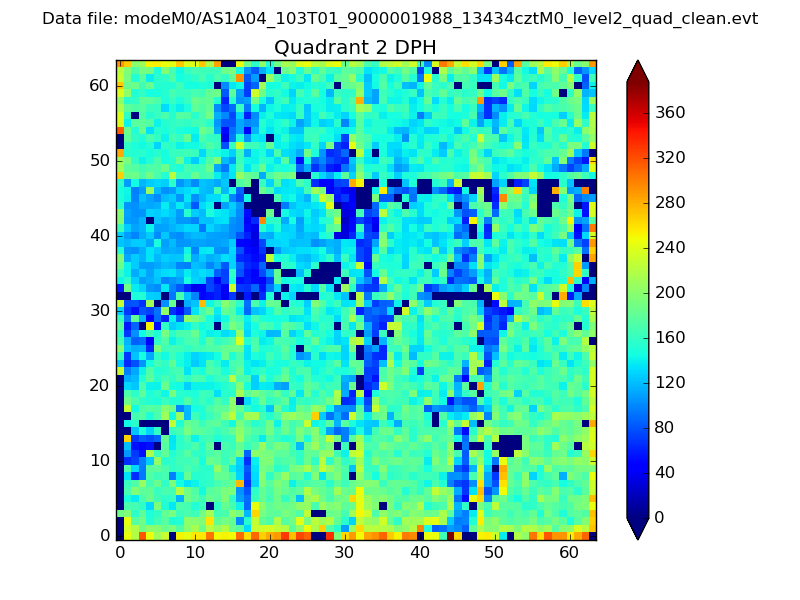 |
Quadrant C |
| Plot type | Count rate plots | Images |
|---|---|---|
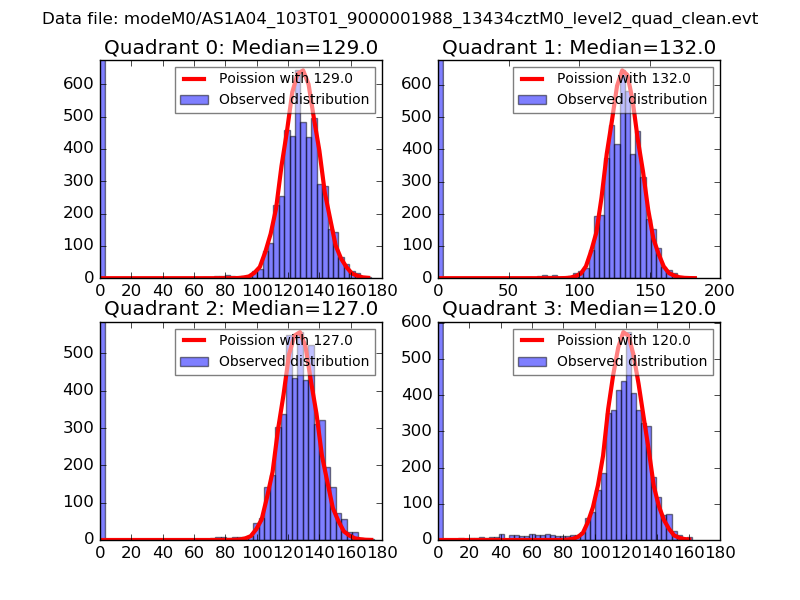
| Comparison with Poisson distribution Blue bars denote a histogram of data divided into 1 sec bins. Red curve is a Poisson curve with rate = median count rate of data. |
 |
 |
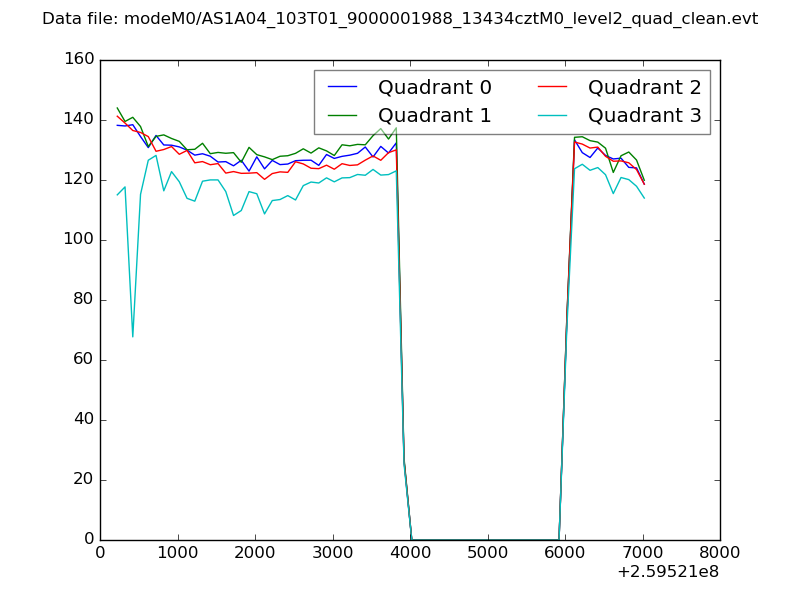
| Quadrant-wise count rates Data is divided into 100 sec bins |
 |
|
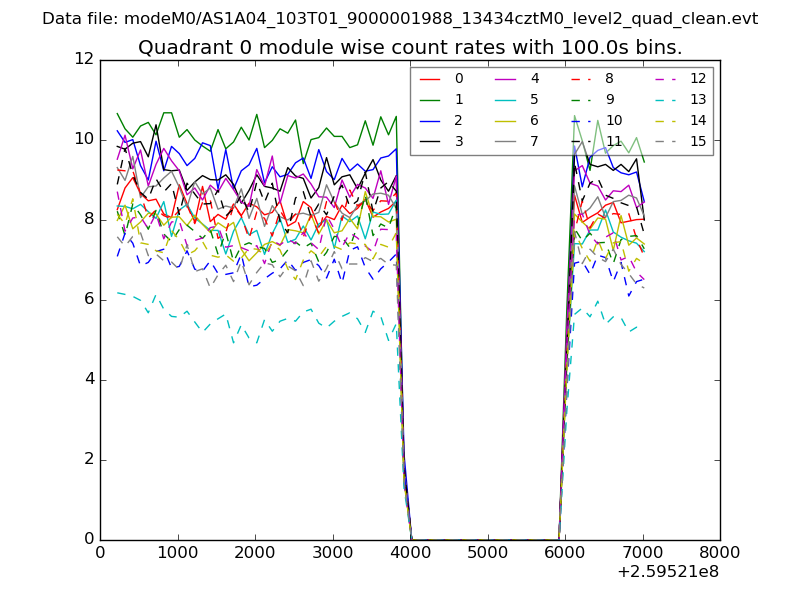
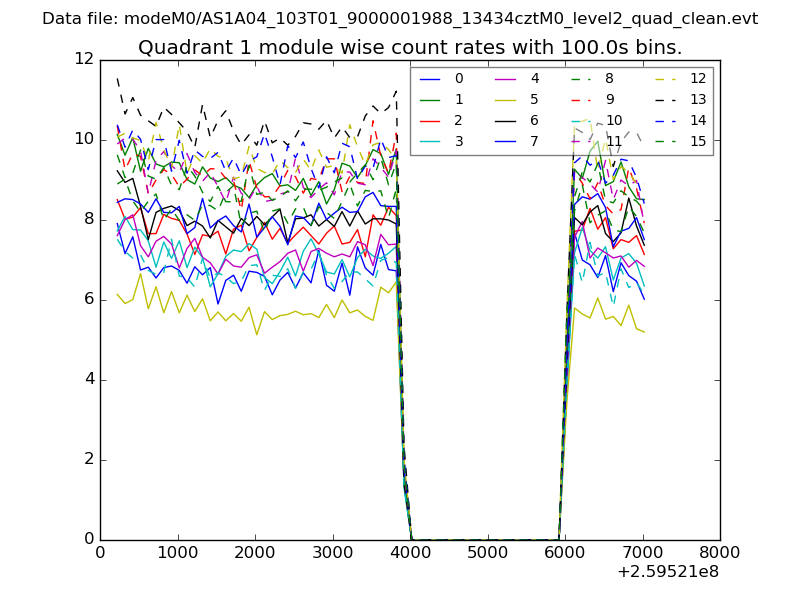
| Module-wise count rates for Quadrant A Data is divided into 100 sec bins |
 |
 |
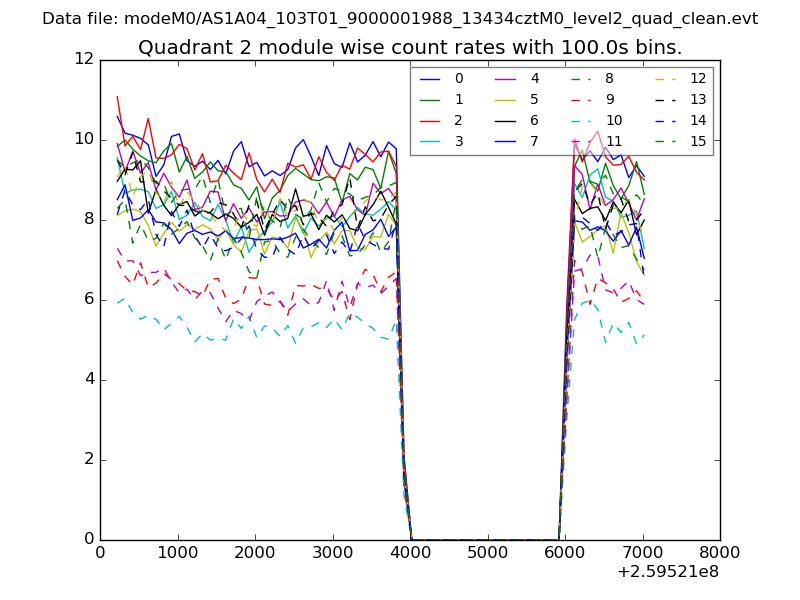
| Module-wise count rates for Quadrant B Data is divided into 100 sec bins |
 |
 |
| Module-wise count rates for Quadrant C Data is divided into 100 sec bins |
 |
 |
| Module-wise count rates for Quadrant D Data is divided into 100 sec bins |
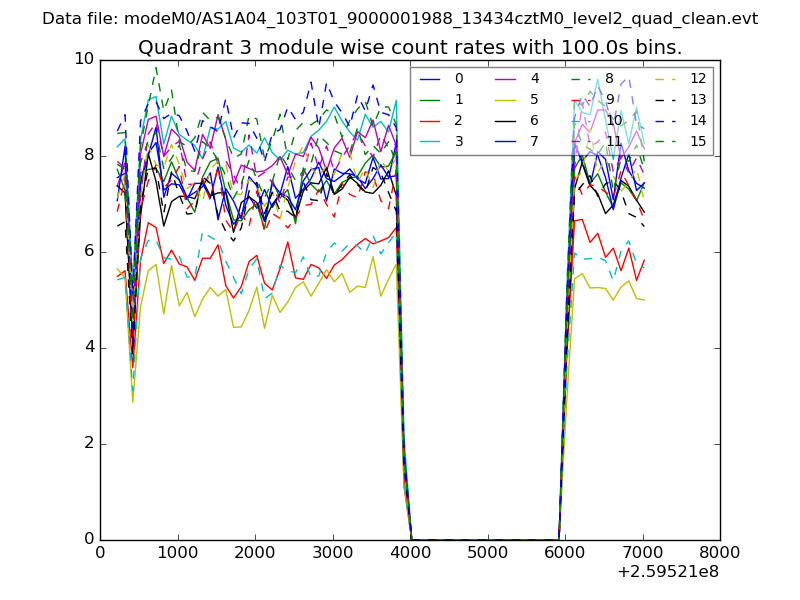 |
 |
| Parameter | Plot |
|---|---|
| CZT HV Monitor | 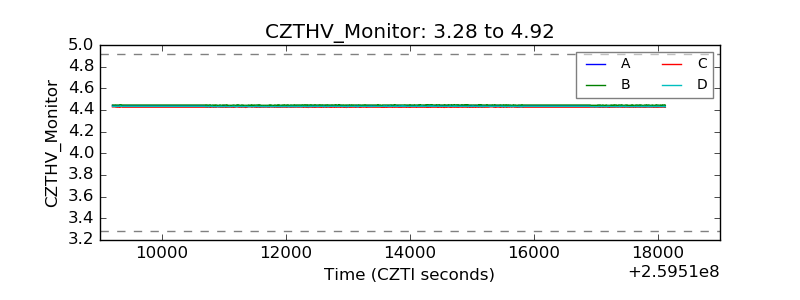 |
| D_VDD | 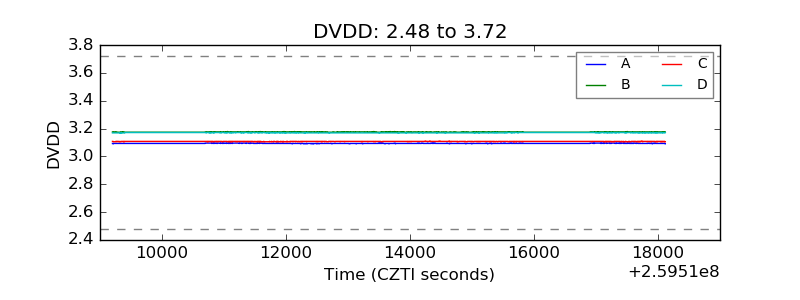 |
| Temperature 1 | 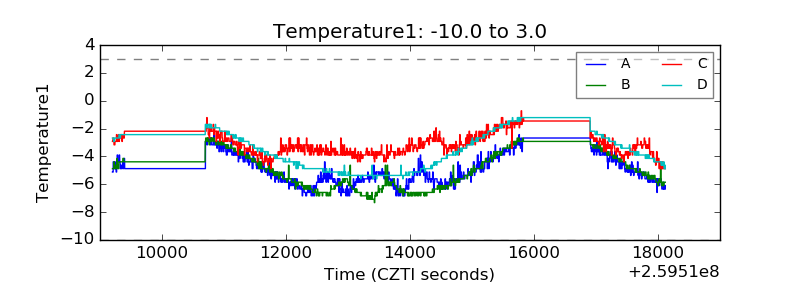 |
| Veto HV Monitor | 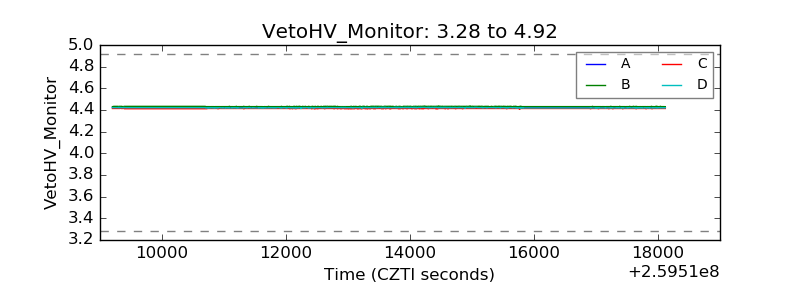 |
| Veto LLD |  |
| Alpha Counter | 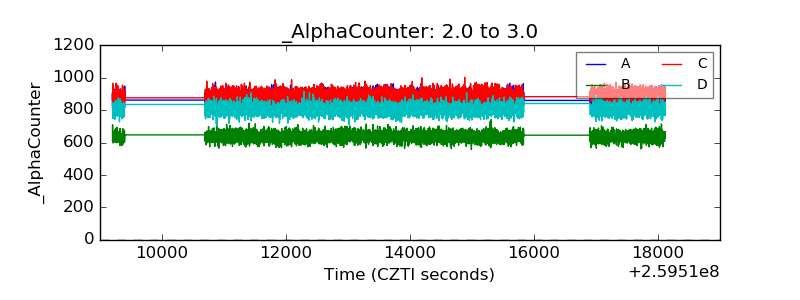 |
| _CPM_Rate | 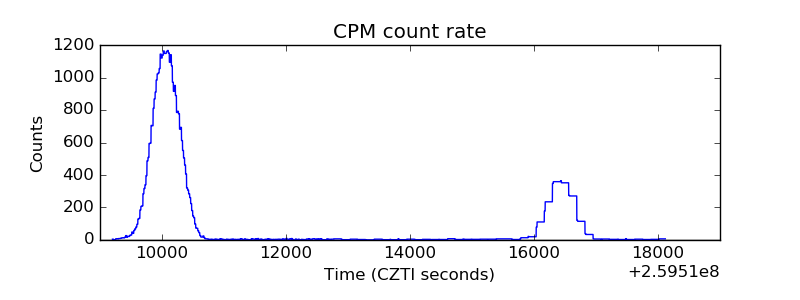 |
| CZT Counter | 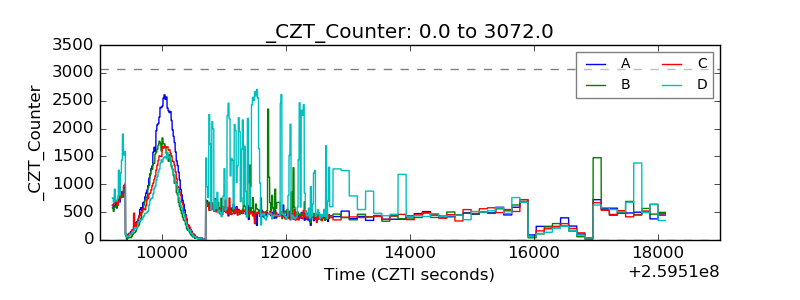 |
| +2.5 Volts monitor |  |
| +5 Volts monitor |  |
| _ROLL_ROT | 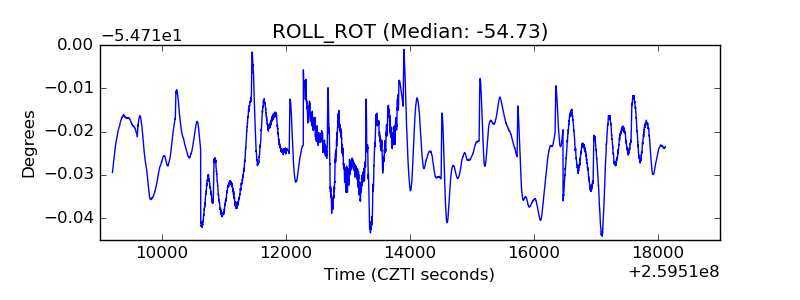 |
| _Roll_DEC | 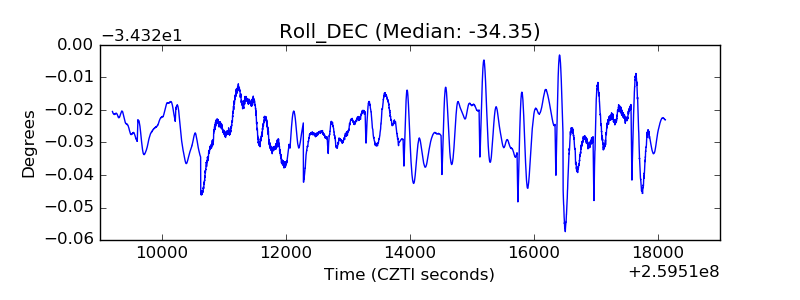 |
| _Roll_RA | 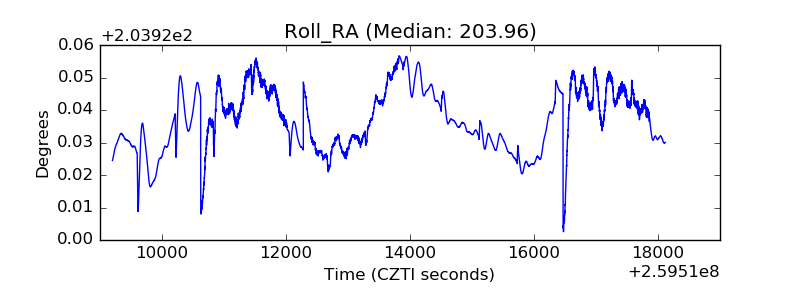 |
| Veto Counter | 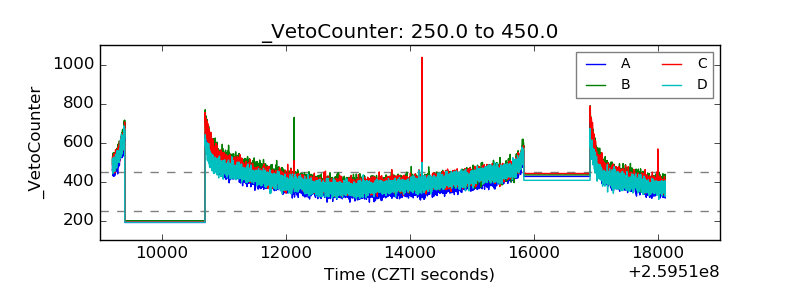 |