| Param | Original file | Final file |
|---|---|---|
| Filename | modeM0/AS1A04_103T01_9000001988_13435cztM0_level2.evt | modeM0/AS1A04_103T01_9000001988_13435cztM0_level2_quad_clean.evt |
| Size (bytes) | 578,427,840 | 105,644,160 |
| Size | 551.6 MB | 100.8 MB |
| Events in quadrant A | 3,733,056 | 674,425 |
| Events in quadrant B | 4,044,035 | 686,726 |
| Events in quadrant C | 3,674,607 | 667,490 |
| Events in quadrant D | 5,534,292 | 625,527 |
| Mode M0 | |||
|---|---|---|---|
| Quadrant | BADHDUFLAG | Total packets | Discarded packets |
| A | 0 | 16425 | 3 |
| B | 0 | 17253 | 2 |
| C | 0 | 16195 | 2 |
| D | 0 | 21867 | 2 |
| Mode SS | |||
|---|---|---|---|
| Quadrant | BADHDUFLAG | Total packets | Discarded packets |
| A | 0 | 160 | 0 |
| B | 0 | 160 | 0 |
| C | 0 | 160 | 0 |
| D | 0 | 160 | 0 |
| Mode M9 | |||
|---|---|---|---|
| Quadrant | BADHDUFLAG | Total packets | Discarded packets |
| A | 0 | 18 | 0 |
| B | 0 | 18 | 0 |
| C | 0 | 18 | 0 |
| D | 0 | 18 | 0 |
| Quadrant | Total seconds | Saturated seconds | Saturation percentage |
|---|---|---|---|
| A | 7844 | 54 | 0.688424% |
| B | 7844 | 142 | 1.810301% |
| C | 7844 | 11 | 0.140235% |
| D | 7844 | 379 | 4.831719% |
Noise dominated data is calculated using 1-second bins in cleaned event files. If a bin has >2000 counts, and if more than 50% of those come from <1% of pixels, then it is considered to be noise-dominated and hence unusable.
| Quadrant | # 1 sec bins | Bins with >0 counts | Bins with >2000 counts | High rate bins dominated by noise | Noise dominated (total time) | Noise dominated (detector-on time) | Marked lightcurve |
|---|---|---|---|---|---|---|---|
| A | 9585 | 7847 | 14 | 14 | 0.15% | 0.18% | 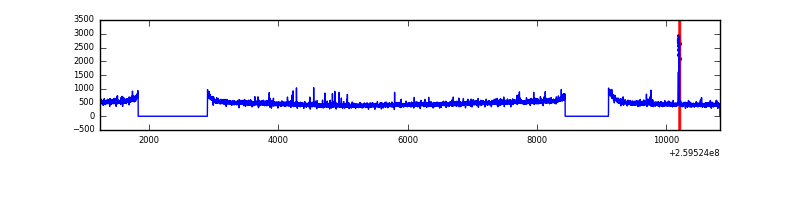 |
| B | 9585 | 7847 | 46 | 46 | 0.48% | 0.59% | 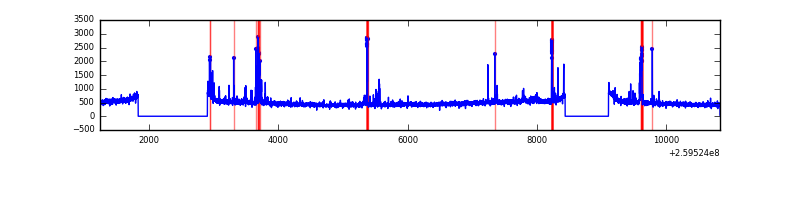 |
| C | 9585 | 7847 | 0 | 0 | 0.00% | 0.00% | 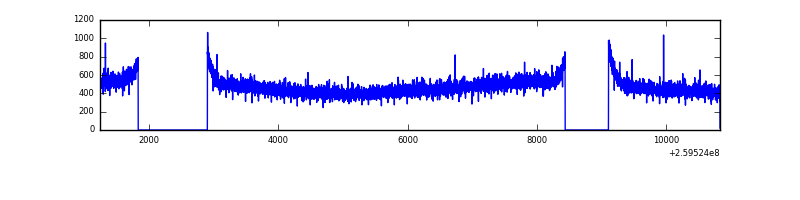 |
| D | 9585 | 7847 | 309 | 309 | 3.22% | 3.94% | 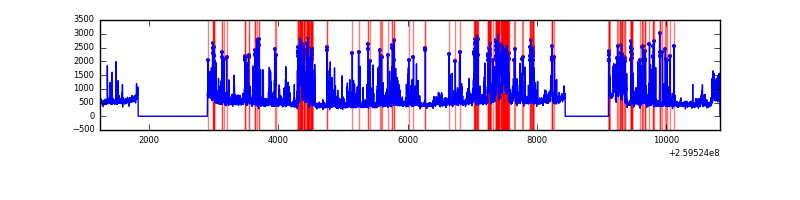 |
Top three noisy pixels from each quadrant. If the there are fewer than three noisy pixels in the level2.evt file, extra rows are filled as -1
| Pixel properties | Quadrant properties | ||||||
|---|---|---|---|---|---|---|---|
| Quadrant | DetID | PixID | Counts | Sigma | Mean | Median | Sigma |
| A | 15 | 69 | 43855 | 224.8 | 946 | 925 | 191.0 |
| A | 1 | 162 | 29831 | 151.36 | 946 | 925 | 191.0 |
| A | 1 | 178 | 9942 | 47.22 | 946 | 925 | 191.0 |
| B | 4 | 142 | 178011 | 985.65 | 949 | 925 | 179.7 |
| B | 3 | 64 | 64820 | 355.63 | 949 | 925 | 179.7 |
| B | 3 | 209 | 28129 | 151.41 | 949 | 925 | 179.7 |
| C | 3 | 233 | 87076 | 404.37 | 919 | 922 | 213.1 |
| C | 13 | 61 | 6592 | 26.61 | 919 | 922 | 213.1 |
| C | 0 | 207 | 4201 | 15.39 | 919 | 922 | 213.1 |
| D | 13 | 249 | 1607996 | 7422.35 | 891 | 867 | 216.5 |
| D | 8 | 195 | 404356 | 1863.47 | 891 | 867 | 216.5 |
| D | 2 | 136 | 88800 | 406.11 | 891 | 867 | 216.5 |
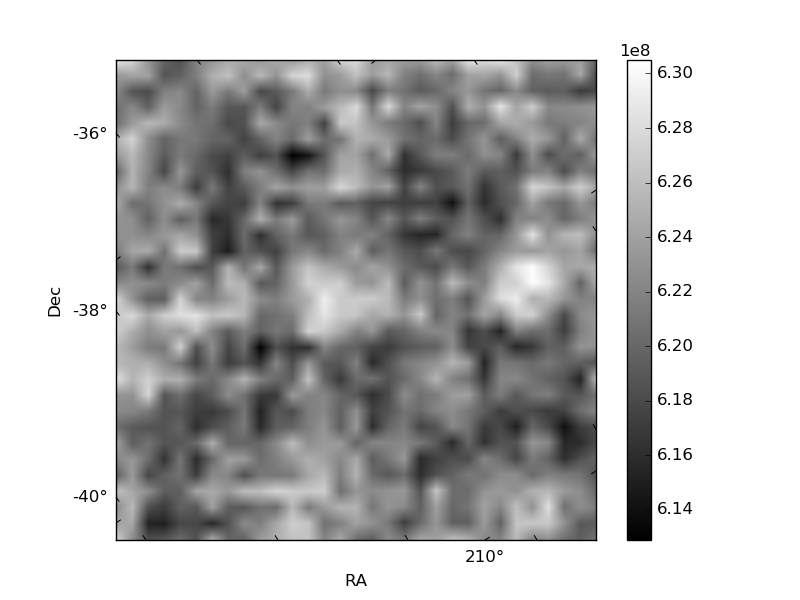
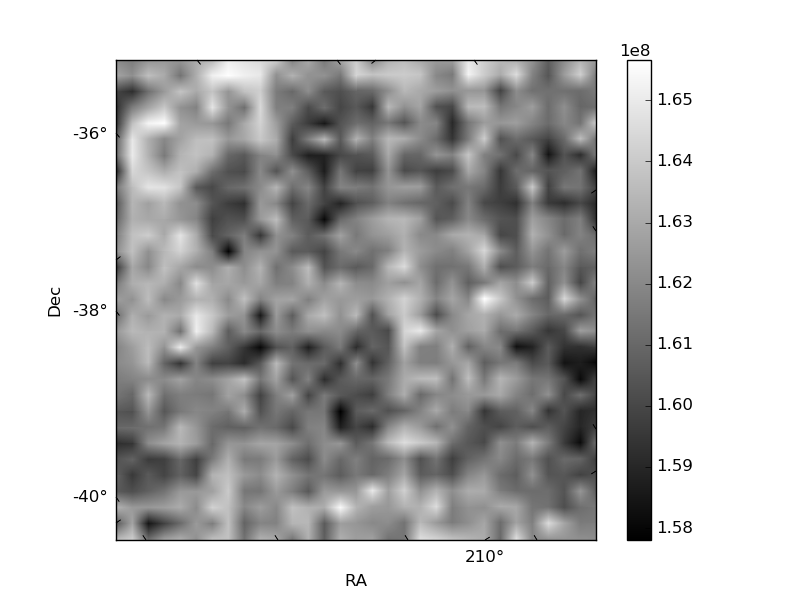
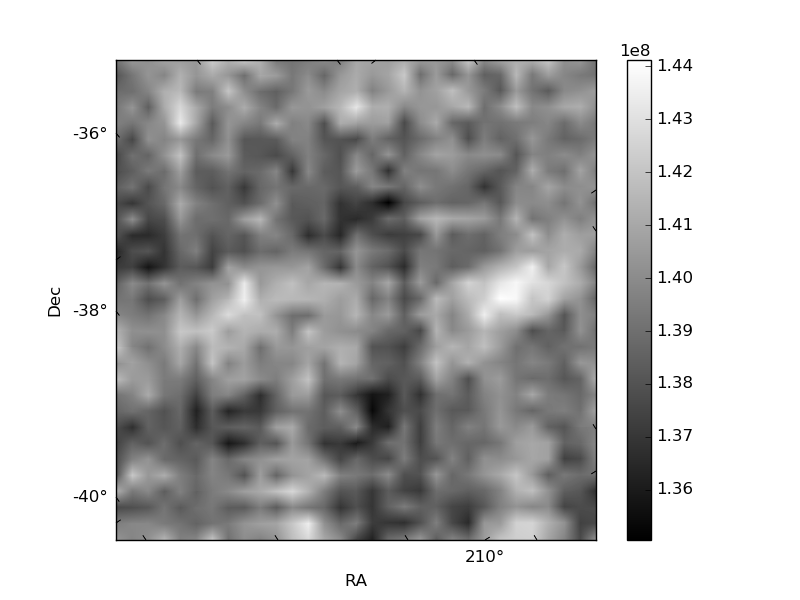
Histogram calculated using DETX and DETY for each event in the final _common_clean file
| Quadrant A | 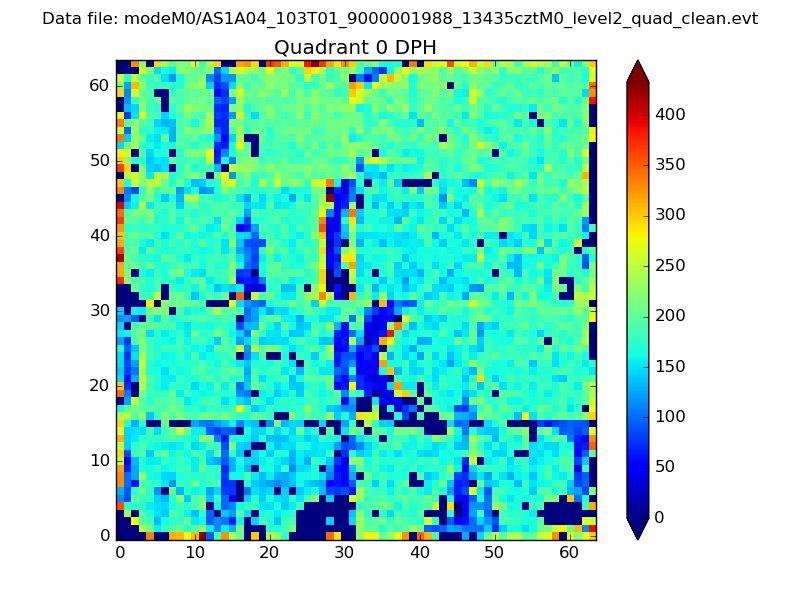 |
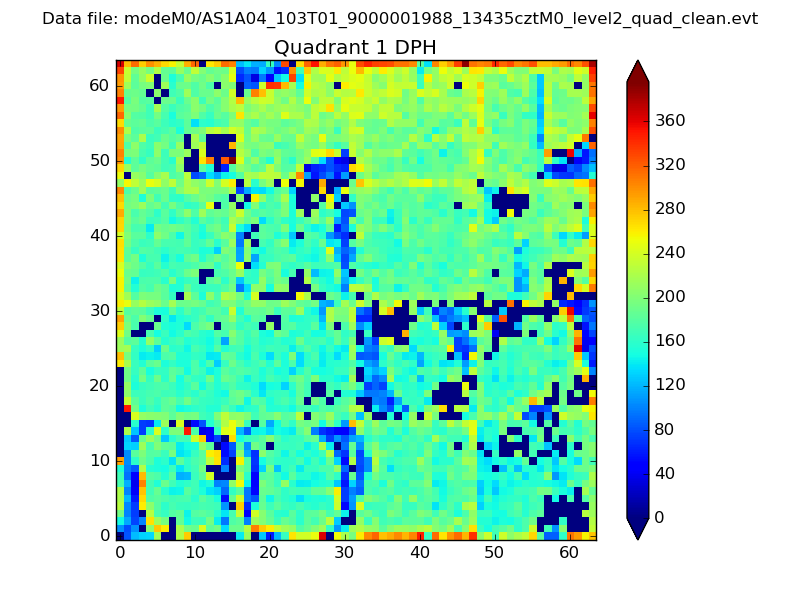 |
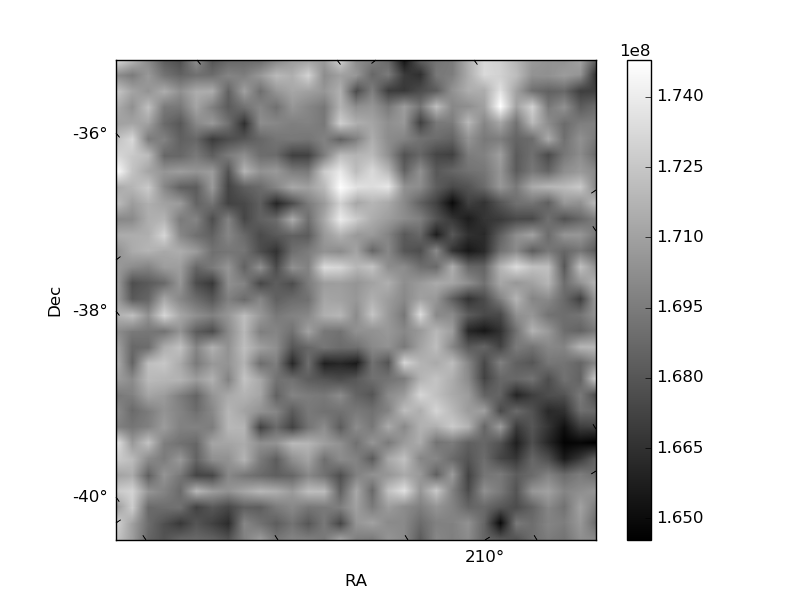
Quadrant B |
|---|---|---|---|
| Quadrant D | 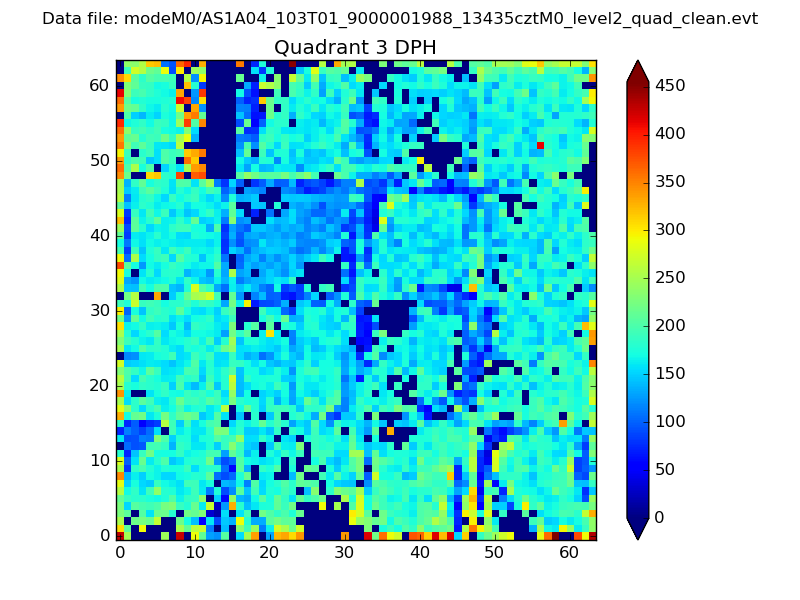 |
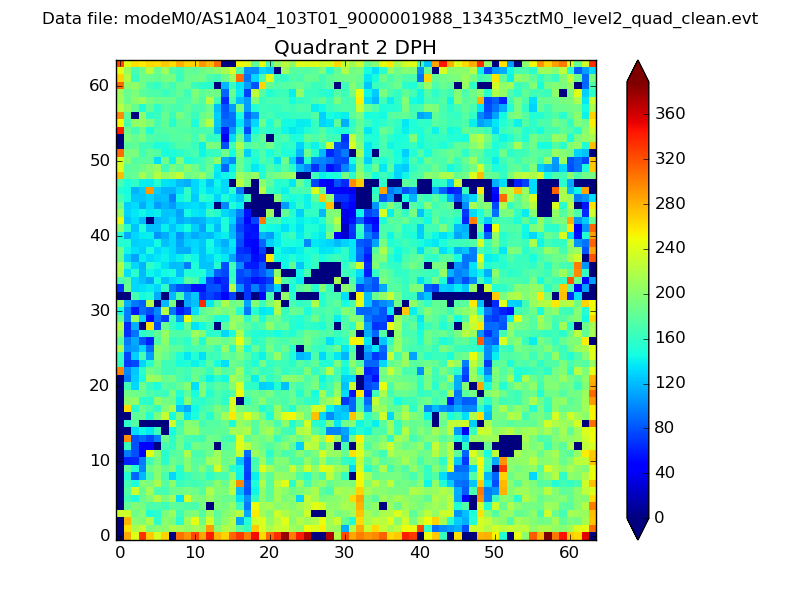 |
Quadrant C |
| Plot type | Count rate plots | Images |
|---|---|---|
| Comparison with Poisson distribution Blue bars denote a histogram of data divided into 1 sec bins. Red curve is a Poisson curve with rate = median count rate of data. |
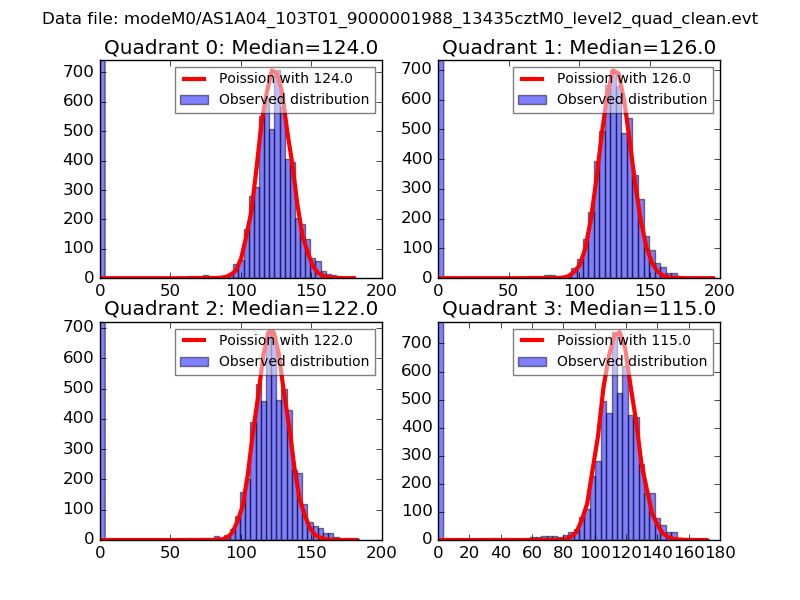 |
 |
| Quadrant-wise count rates Data is divided into 100 sec bins |
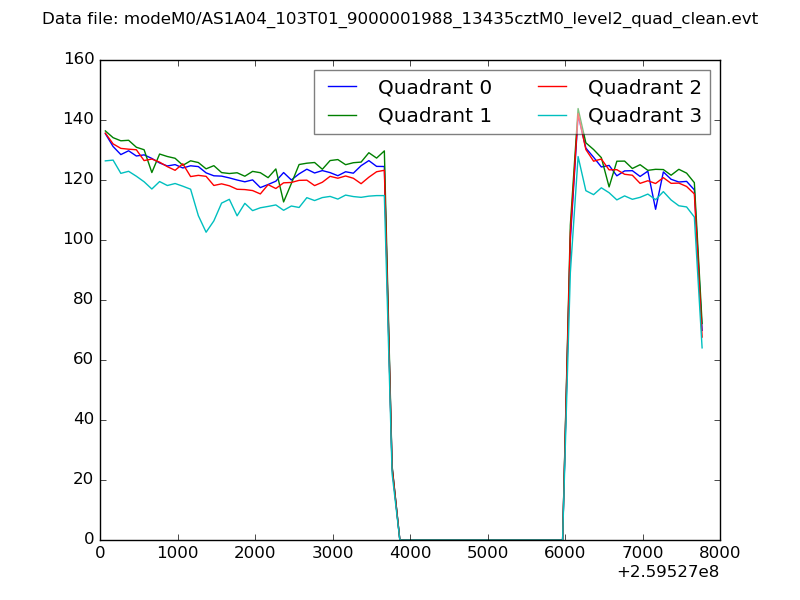 |
|
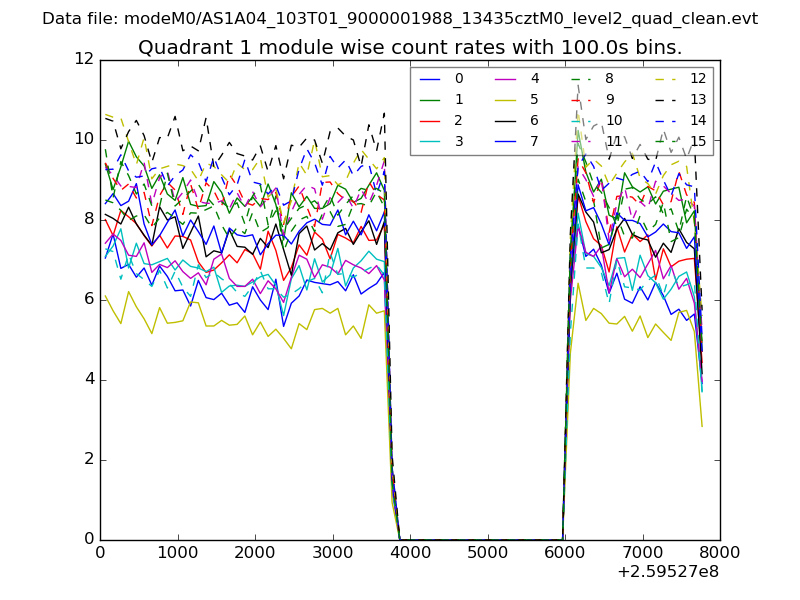
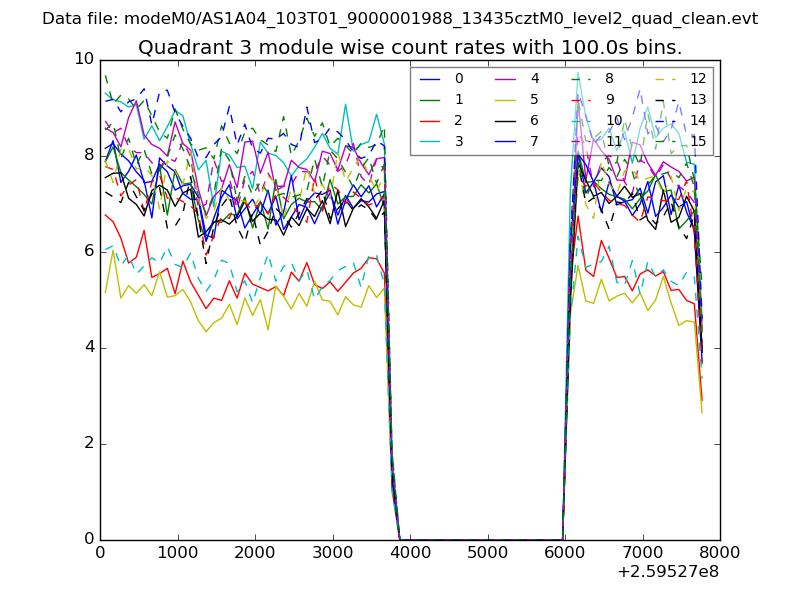
| Module-wise count rates for Quadrant A Data is divided into 100 sec bins |
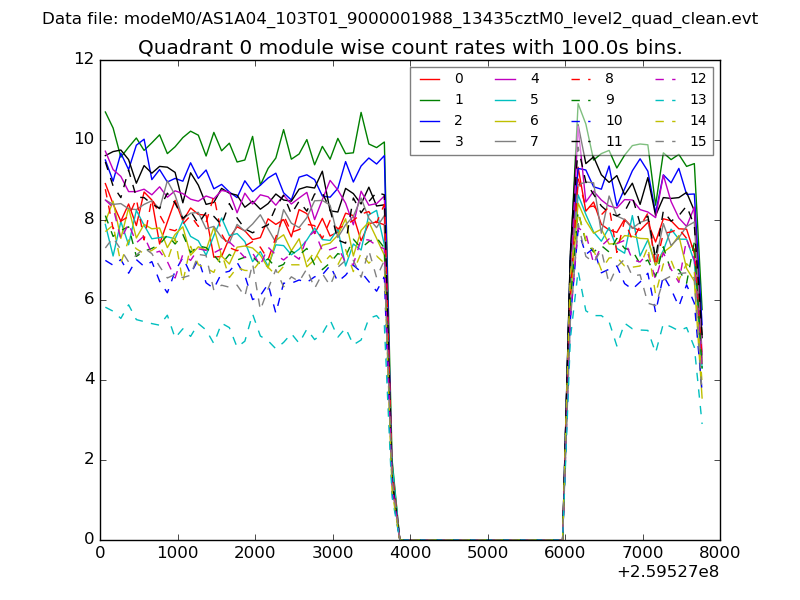 |
 |
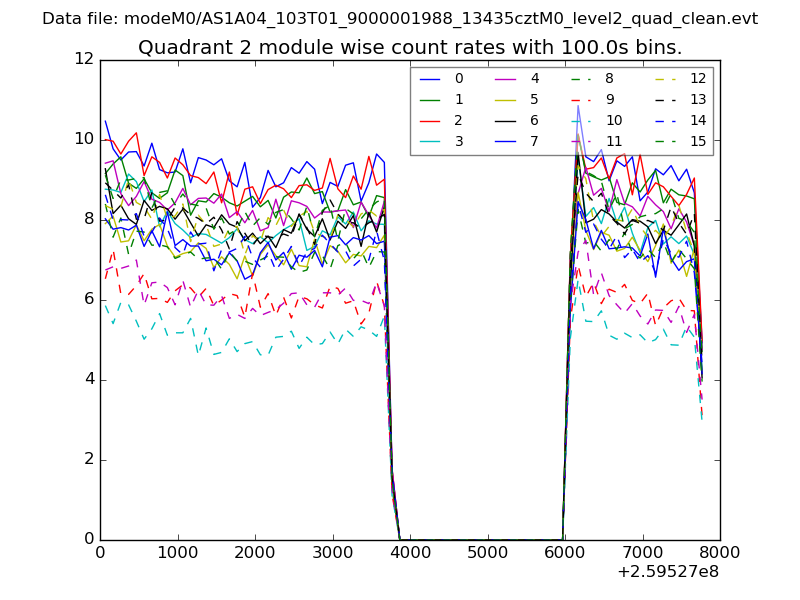
| Module-wise count rates for Quadrant B Data is divided into 100 sec bins |
 |
 |
| Module-wise count rates for Quadrant C Data is divided into 100 sec bins |
 |
 |
| Module-wise count rates for Quadrant D Data is divided into 100 sec bins |
 |
 |
| Parameter | Plot |
|---|---|
| CZT HV Monitor | 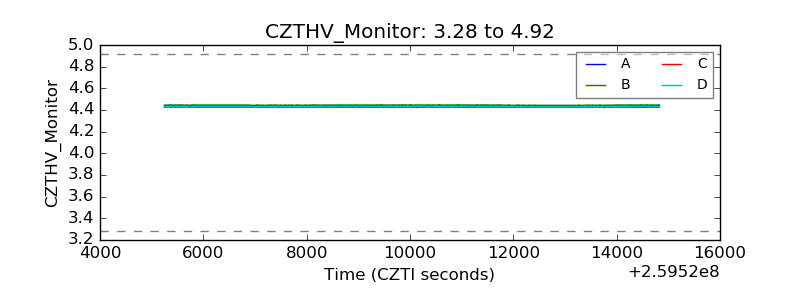 |
| D_VDD | 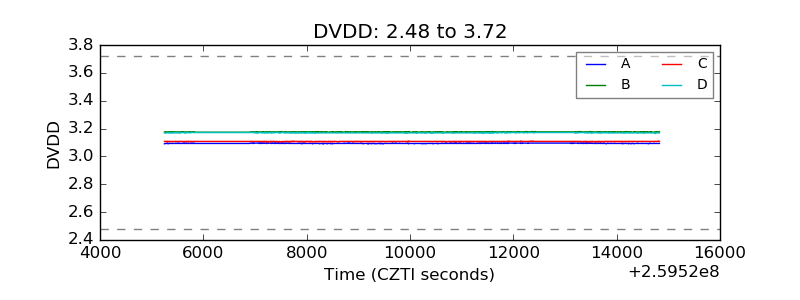 |
| Temperature 1 |  |
| Veto HV Monitor | 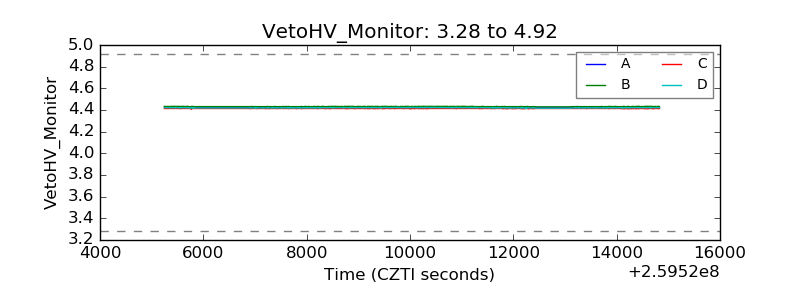 |
| Veto LLD | 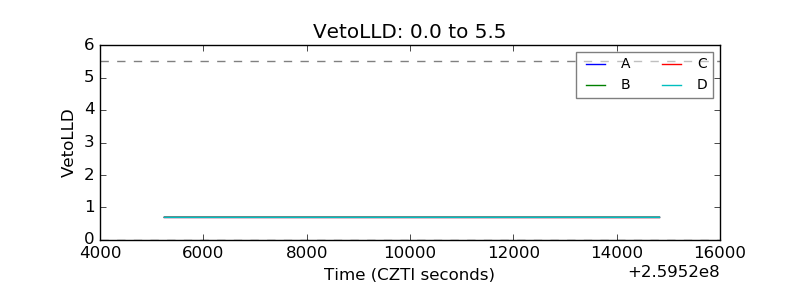 |
| Alpha Counter | 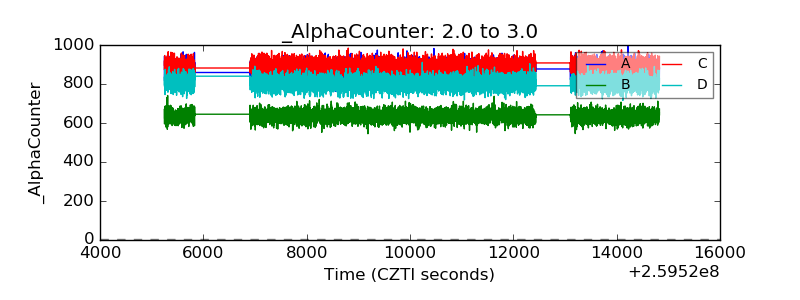 |
| _CPM_Rate | 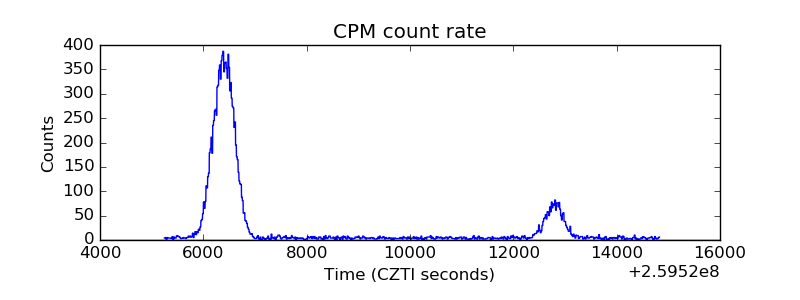 |
| CZT Counter | 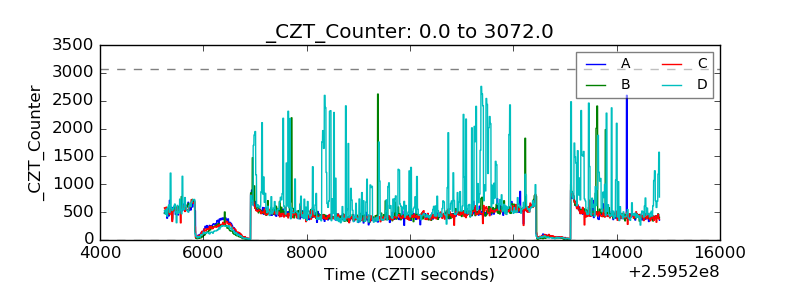 |
| +2.5 Volts monitor |  |
| +5 Volts monitor | 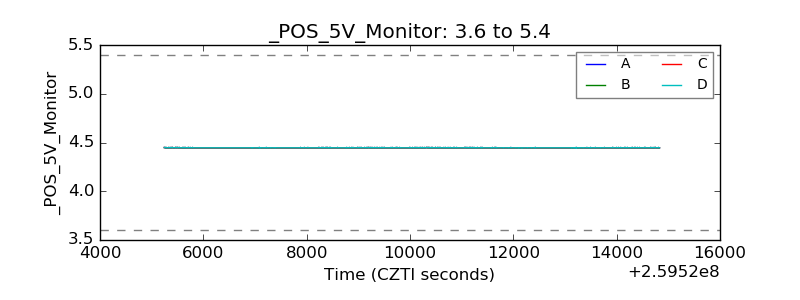 |
| _ROLL_ROT | 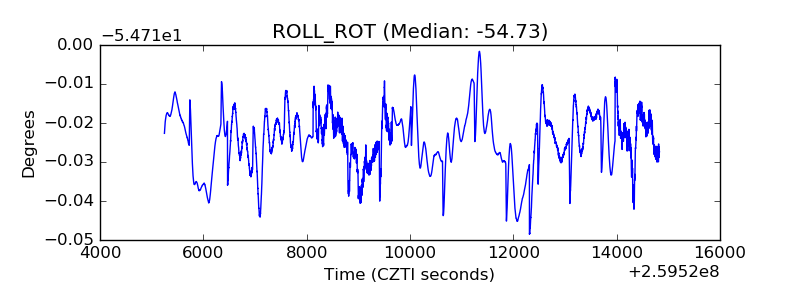 |
| _Roll_DEC | 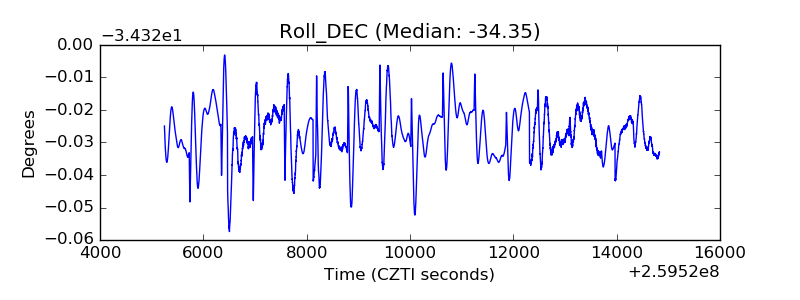 |
| _Roll_RA | 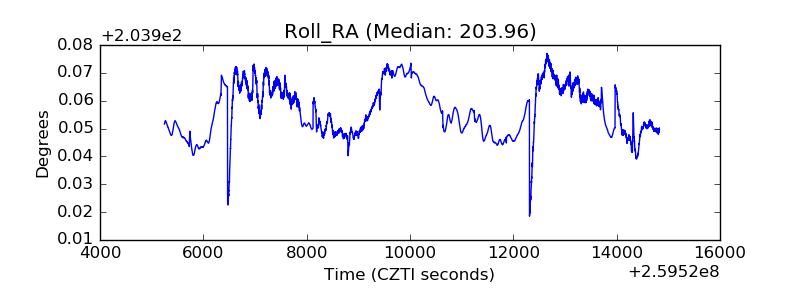 |
| Veto Counter | 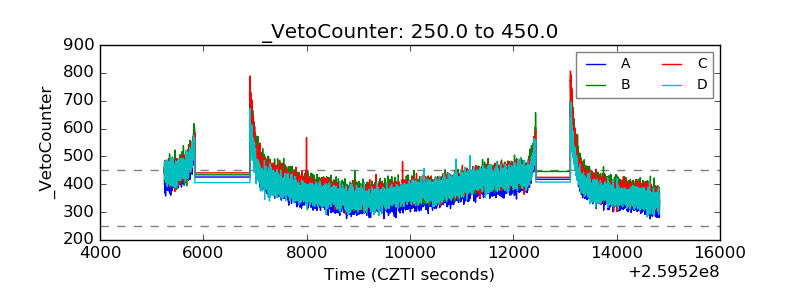 |