| Param | Original file | Final file |
|---|---|---|
| Filename | modeM0/AS1A04_103T01_9000001988_13436cztM0_level2.evt | modeM0/AS1A04_103T01_9000001988_13436cztM0_level2_quad_clean.evt |
| Size (bytes) | 530,159,040 | 103,104,000 |
| Size | 505.6 MB | 98.3 MB |
| Events in quadrant A | 3,583,536 | 656,421 |
| Events in quadrant B | 3,676,656 | 674,355 |
| Events in quadrant C | 3,499,832 | 651,472 |
| Events in quadrant D | 4,785,151 | 616,692 |
| Mode M0 | |||
|---|---|---|---|
| Quadrant | BADHDUFLAG | Total packets | Discarded packets |
| A | 0 | 15828 | 3 |
| B | 0 | 16049 | 2 |
| C | 0 | 15476 | 2 |
| D | 0 | 19495 | 2 |
| Mode SS | |||
|---|---|---|---|
| Quadrant | BADHDUFLAG | Total packets | Discarded packets |
| A | 0 | 154 | 0 |
| B | 0 | 154 | 0 |
| C | 0 | 154 | 0 |
| D | 0 | 154 | 0 |
| Mode M9 | |||
|---|---|---|---|
| Quadrant | BADHDUFLAG | Total packets | Discarded packets |
| A | 0 | 3 | 0 |
| B | 0 | 3 | 0 |
| C | 0 | 3 | 0 |
| D | 0 | 3 | 0 |
| Quadrant | Total seconds | Saturated seconds | Saturation percentage |
|---|---|---|---|
| A | 7520 | 54 | 0.718085% |
| B | 7520 | 70 | 0.930851% |
| C | 7520 | 21 | 0.279255% |
| D | 7520 | 141 | 1.875000% |
Noise dominated data is calculated using 1-second bins in cleaned event files. If a bin has >2000 counts, and if more than 50% of those come from <1% of pixels, then it is considered to be noise-dominated and hence unusable.
| Quadrant | # 1 sec bins | Bins with >0 counts | Bins with >2000 counts | High rate bins dominated by noise | Noise dominated (total time) | Noise dominated (detector-on time) | Marked lightcurve |
|---|---|---|---|---|---|---|---|
| A | 7861 | 7522 | 35 | 35 | 0.45% | 0.47% | 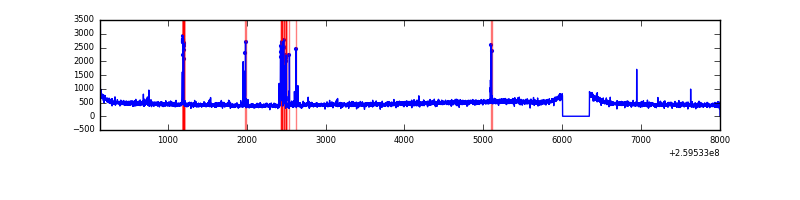 |
| B | 7861 | 7522 | 24 | 24 | 0.31% | 0.32% | 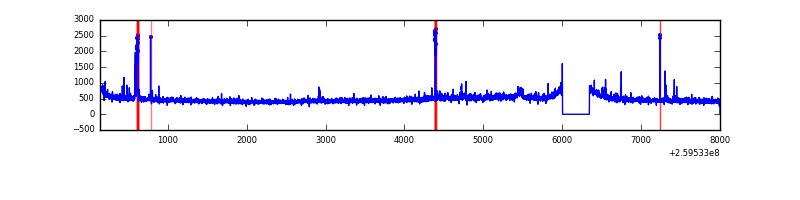 |
| C | 7861 | 7522 | 6 | 6 | 0.08% | 0.08% | 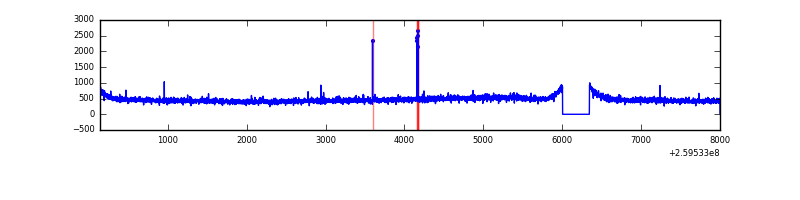 |
| D | 7861 | 7522 | 117 | 117 | 1.49% | 1.56% | 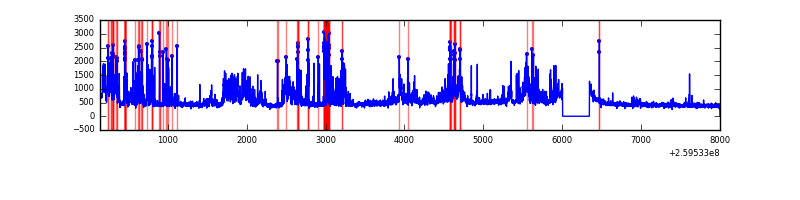 |
Top three noisy pixels from each quadrant. If the there are fewer than three noisy pixels in the level2.evt file, extra rows are filled as -1
| Pixel properties | Quadrant properties | ||||||
|---|---|---|---|---|---|---|---|
| Quadrant | DetID | PixID | Counts | Sigma | Mean | Median | Sigma |
| A | 15 | 69 | 151273 | 834.65 | 886 | 865 | 180.2 |
| A | 1 | 162 | 13372 | 69.4 | 886 | 865 | 180.2 |
| A | 0 | 226 | 7831 | 38.66 | 886 | 865 | 180.2 |
| B | 4 | 142 | 84666 | 488.03 | 891 | 867 | 171.7 |
| B | 0 | 230 | 39852 | 227.04 | 891 | 867 | 171.7 |
| B | 3 | 64 | 32932 | 186.74 | 891 | 867 | 171.7 |
| C | 3 | 233 | 103510 | 510.93 | 863 | 866 | 200.9 |
| C | 14 | 234 | 18603 | 88.29 | 863 | 866 | 200.9 |
| C | 0 | 207 | 6433 | 27.71 | 863 | 866 | 200.9 |
| D | 13 | 249 | 872627 | 4253.32 | 847 | 824 | 205.0 |
| D | 8 | 195 | 648867 | 3161.65 | 847 | 824 | 205.0 |
| D | 2 | 234 | 29150 | 138.2 | 847 | 824 | 205.0 |
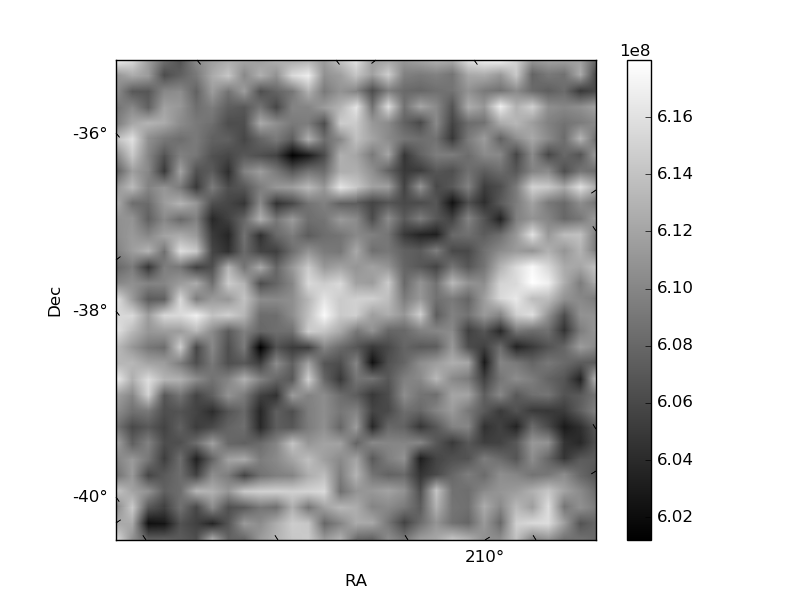
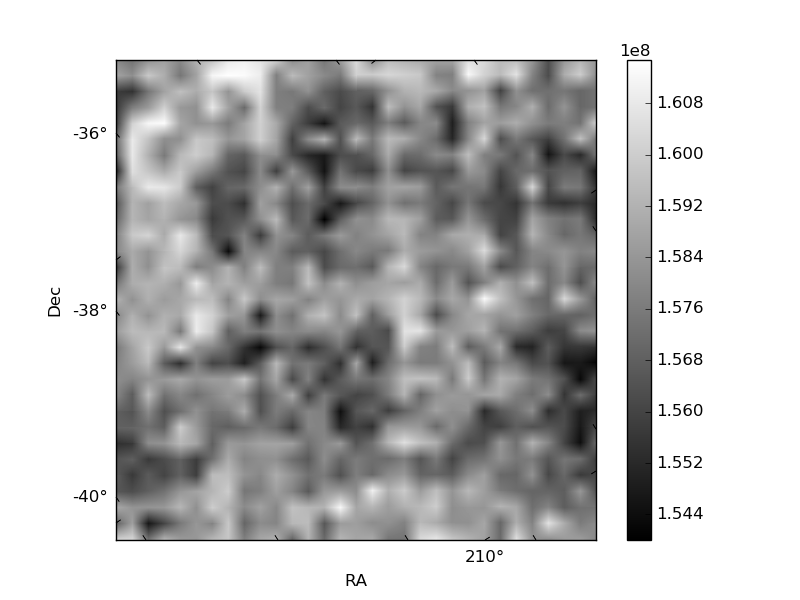
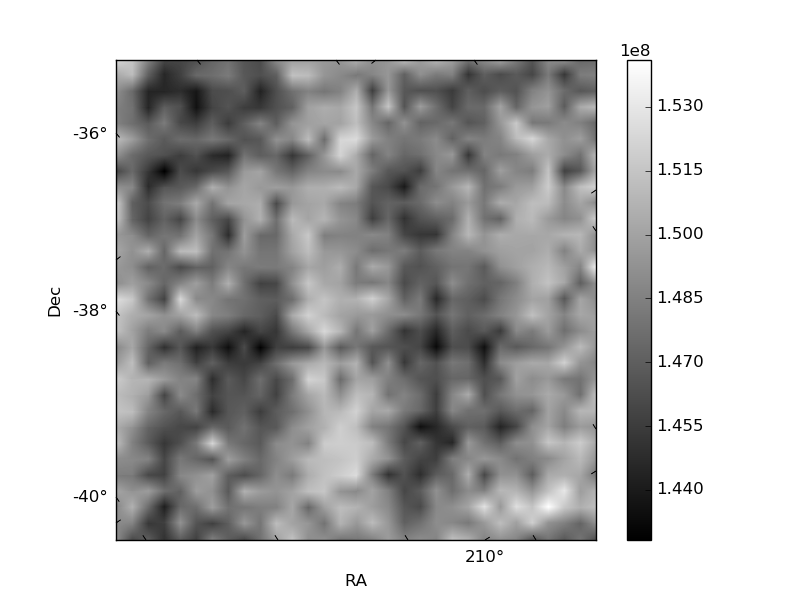
Histogram calculated using DETX and DETY for each event in the final _common_clean file
| Quadrant A | 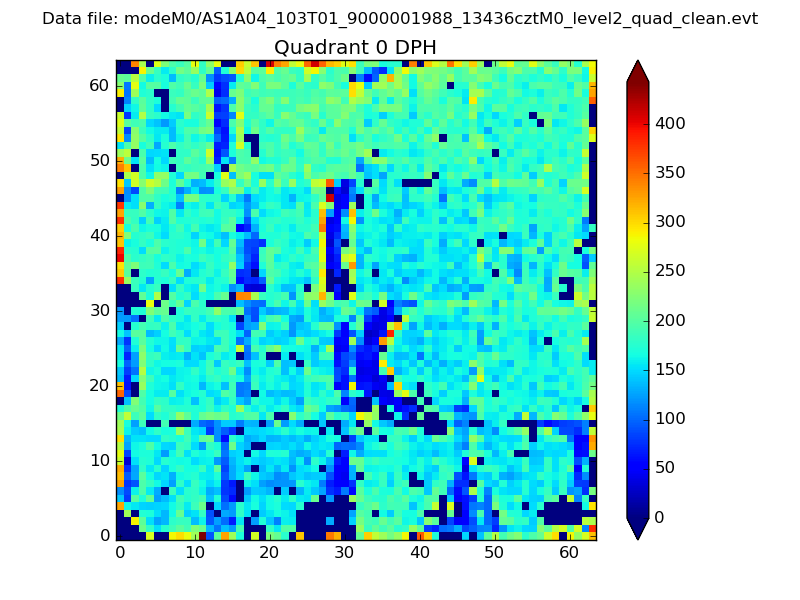 |
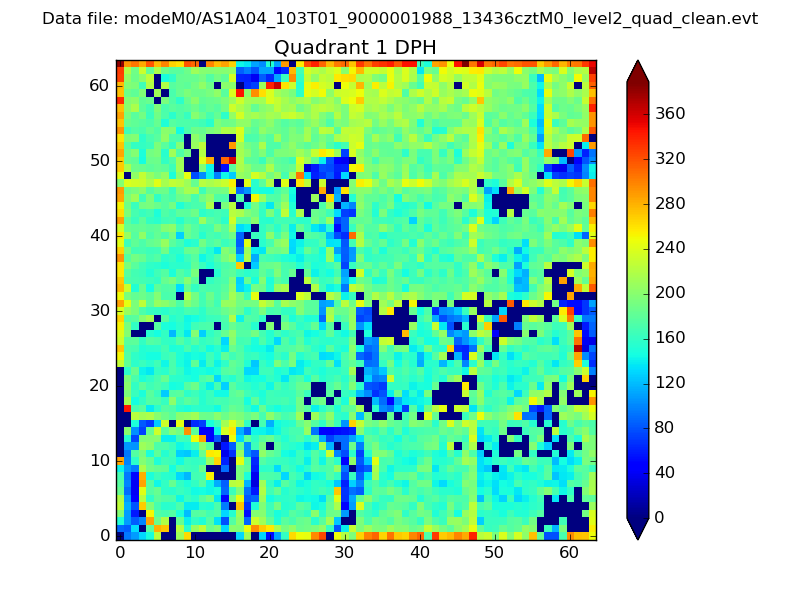 |
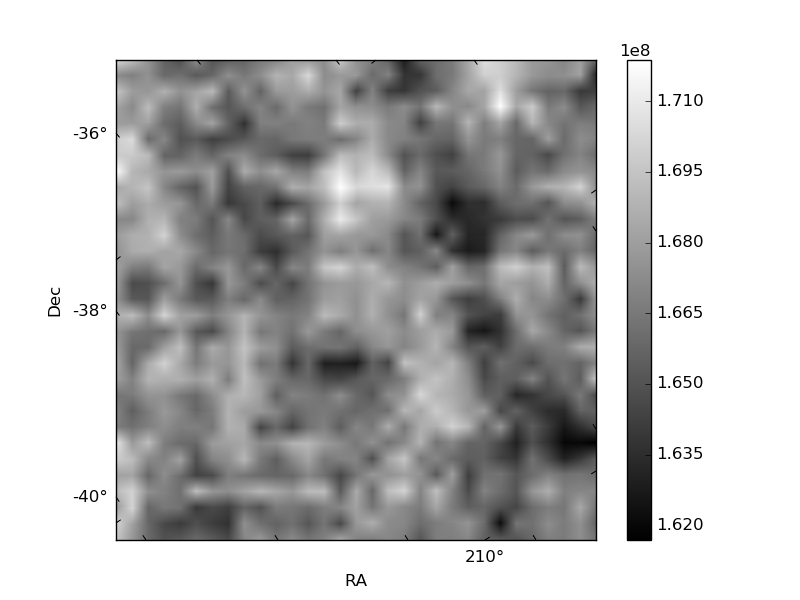
Quadrant B |
|---|---|---|---|
| Quadrant D | 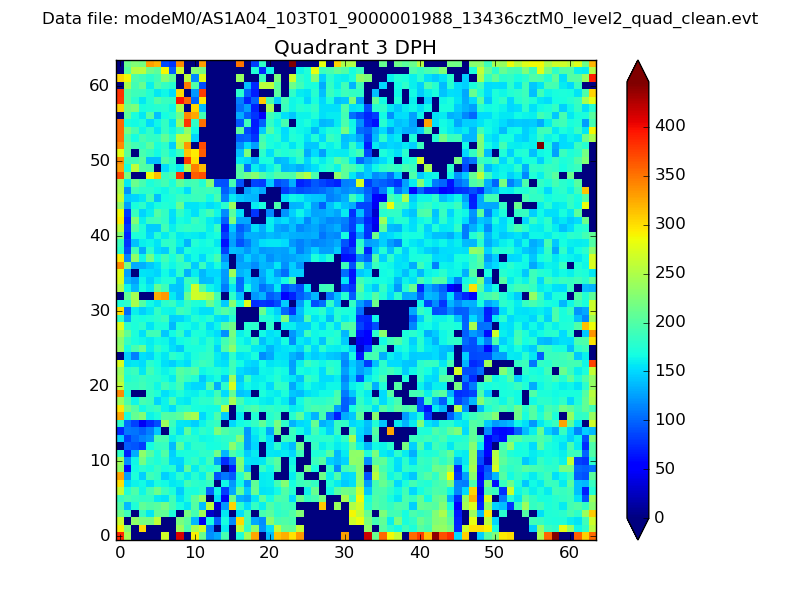 |
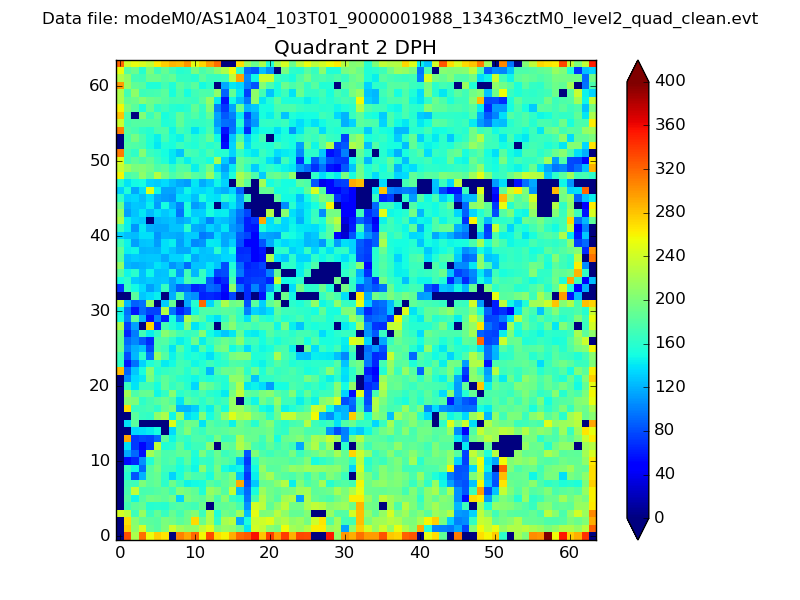 |
Quadrant C |
| Plot type | Count rate plots | Images |
|---|---|---|
| Comparison with Poisson distribution Blue bars denote a histogram of data divided into 1 sec bins. Red curve is a Poisson curve with rate = median count rate of data. |
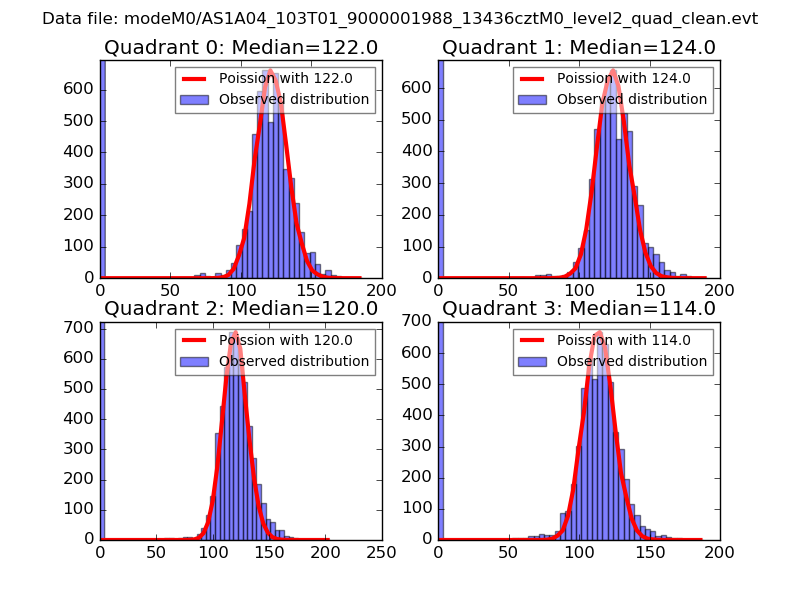 |
 |
| Quadrant-wise count rates Data is divided into 100 sec bins |
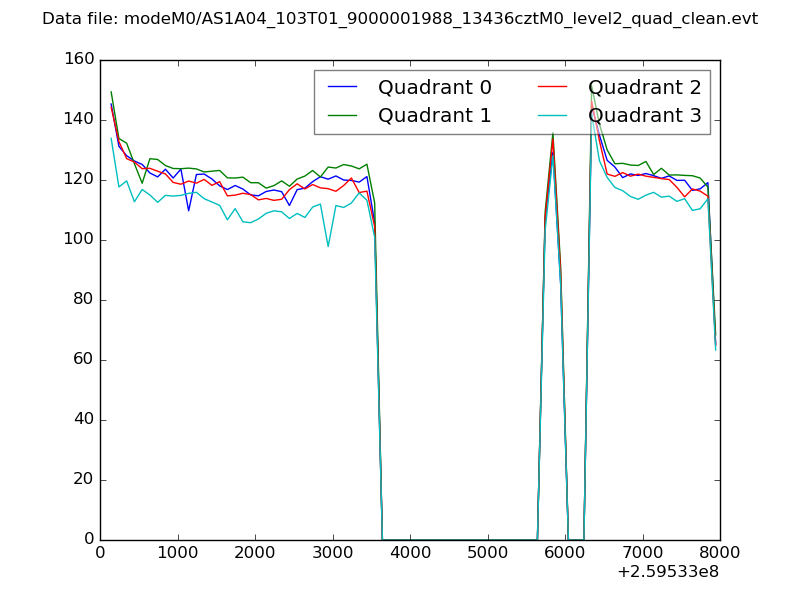 |
|
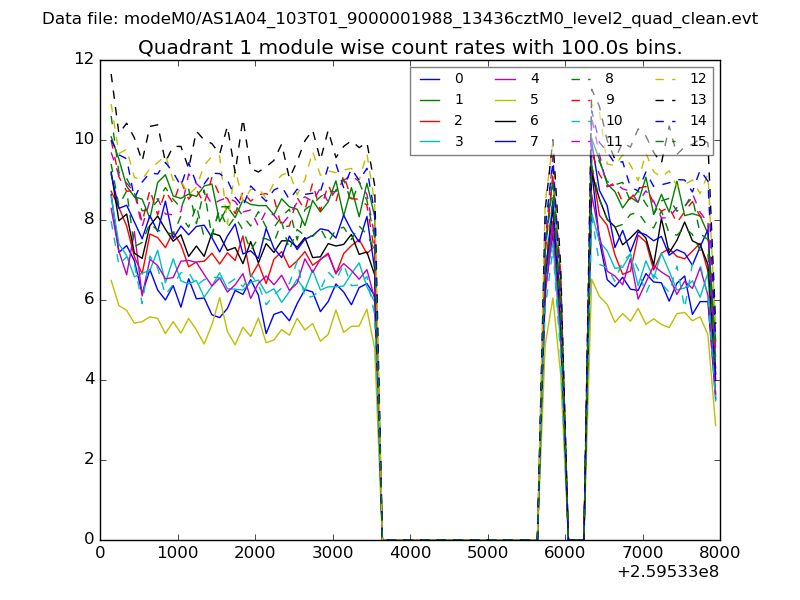
| Module-wise count rates for Quadrant A Data is divided into 100 sec bins |
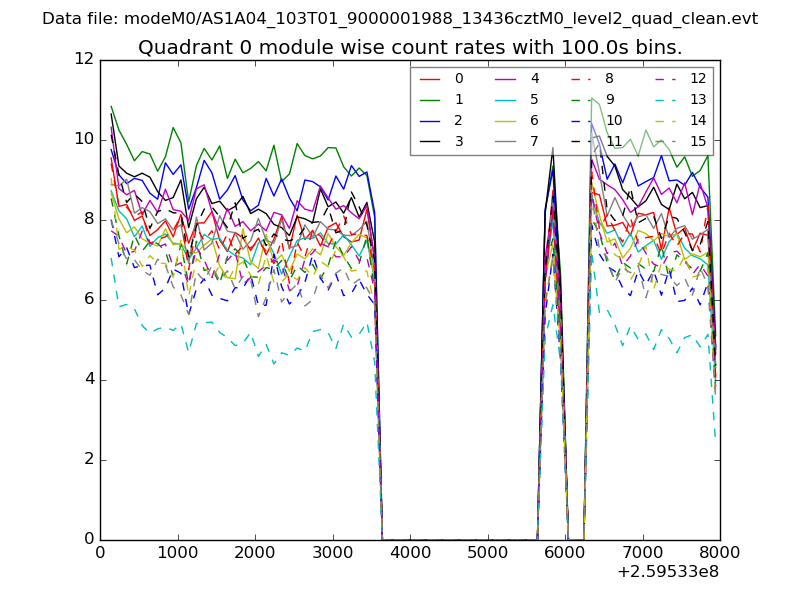 |
 |
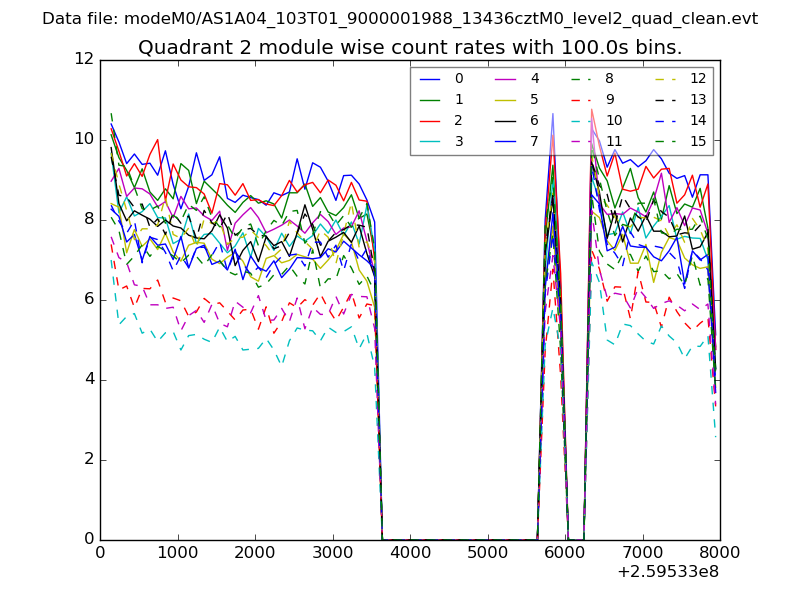
| Module-wise count rates for Quadrant B Data is divided into 100 sec bins |
 |
 |
| Module-wise count rates for Quadrant C Data is divided into 100 sec bins |
 |
 |
| Module-wise count rates for Quadrant D Data is divided into 100 sec bins |
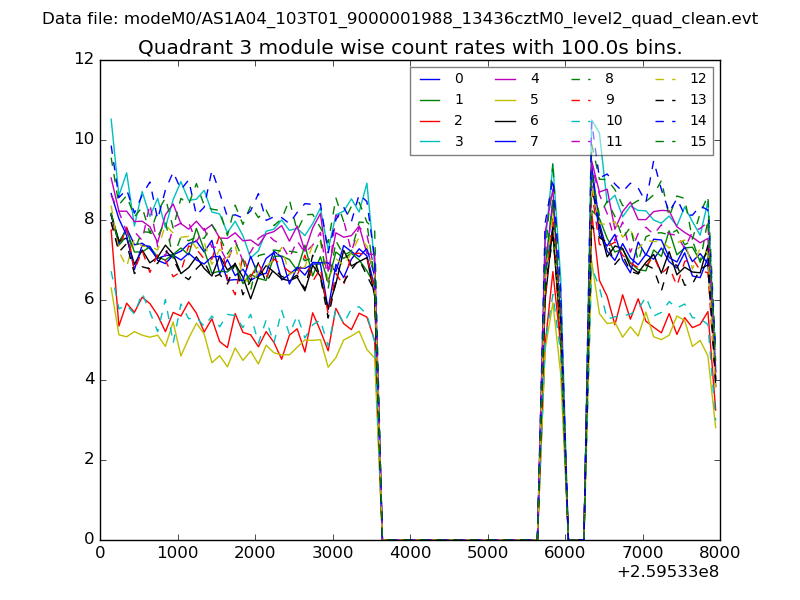 |
 |
| Parameter | Plot |
|---|---|
| CZT HV Monitor | 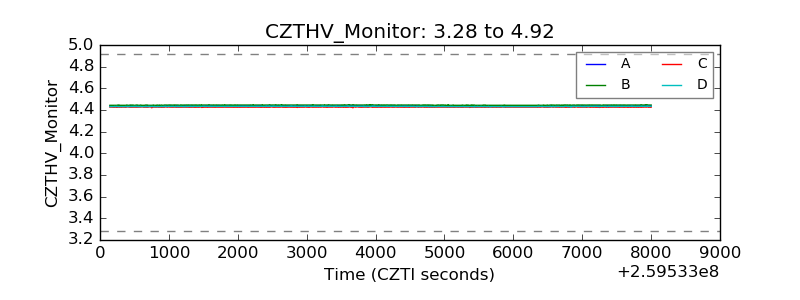 |
| D_VDD | 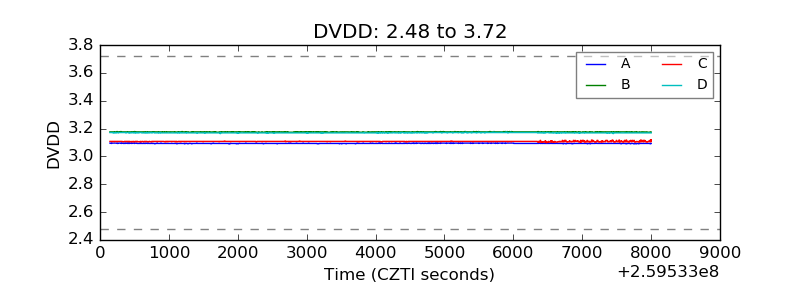 |
| Temperature 1 | 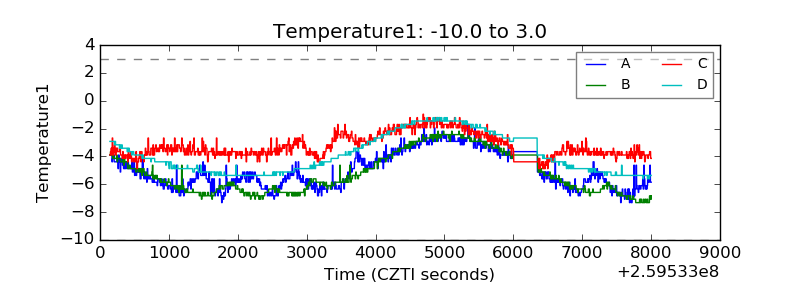 |
| Veto HV Monitor |  |
| Veto LLD | 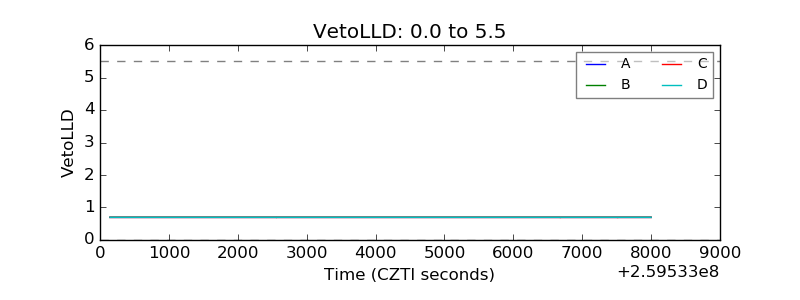 |
| Alpha Counter | 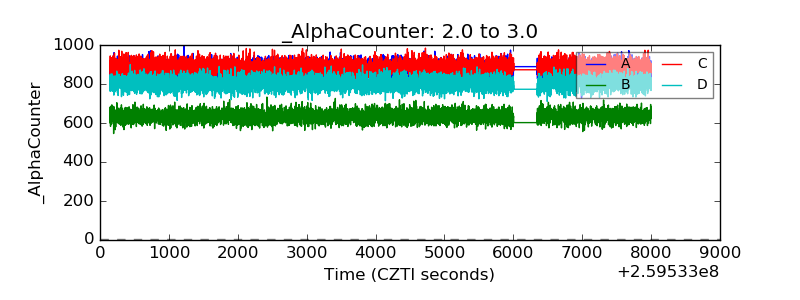 |
| _CPM_Rate | 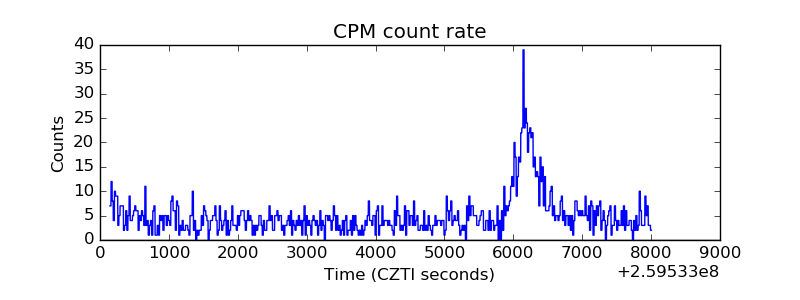 |
| CZT Counter | 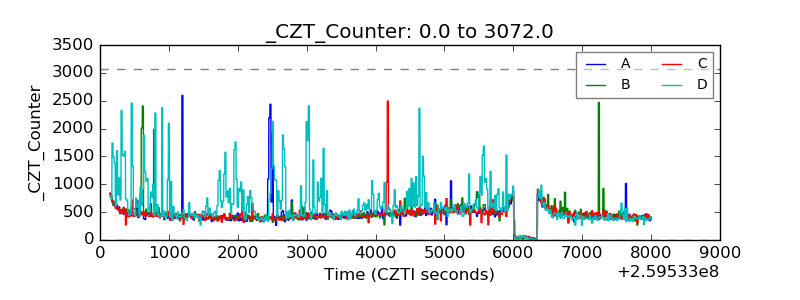 |
| +2.5 Volts monitor |  |
| +5 Volts monitor | 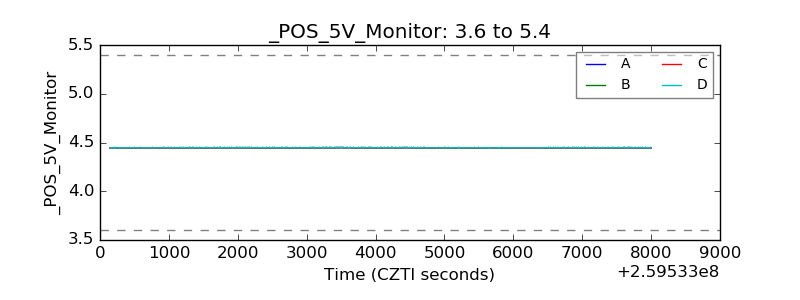 |
| _ROLL_ROT | 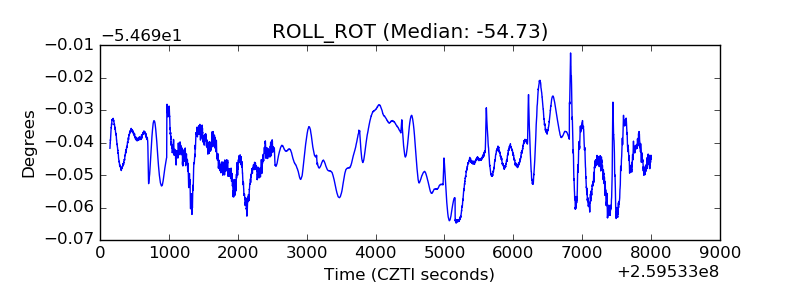 |
| _Roll_DEC | 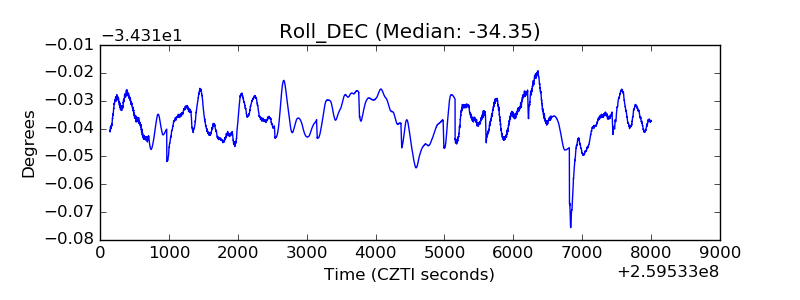 |
| _Roll_RA | 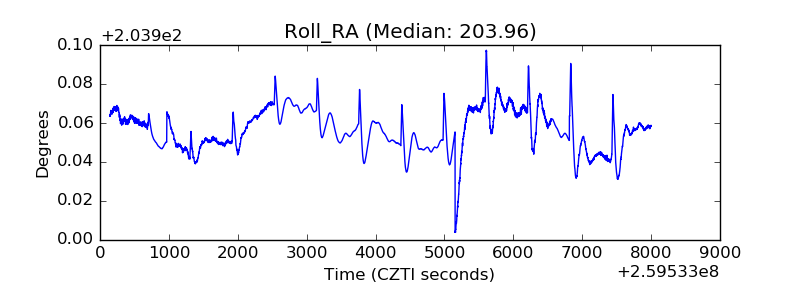 |
| Veto Counter | 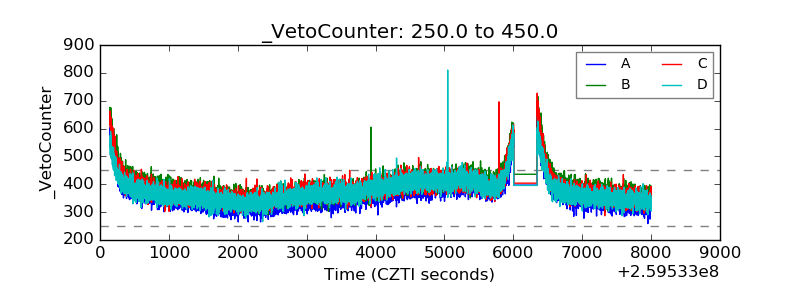 |