| Param | Original file | Final file |
|---|---|---|
| Filename | modeM0/AS1A04_103T01_9000001988_13437cztM0_level2.evt | modeM0/AS1A04_103T01_9000001988_13437cztM0_level2_quad_clean.evt |
| Size (bytes) | 504,129,600 | 109,969,920 |
| Size | 480.8 MB | 104.9 MB |
| Events in quadrant A | 3,650,171 | 701,781 |
| Events in quadrant B | 3,765,100 | 718,196 |
| Events in quadrant C | 3,664,802 | 695,664 |
| Events in quadrant D | 3,651,252 | 665,996 |
| Mode M0 | |||
|---|---|---|---|
| Quadrant | BADHDUFLAG | Total packets | Discarded packets |
| A | 0 | 16358 | 3 |
| B | 0 | 16502 | 2 |
| C | 0 | 16275 | 2 |
| D | 0 | 16619 | 2 |
| Mode SS | |||
|---|---|---|---|
| Quadrant | BADHDUFLAG | Total packets | Discarded packets |
| A | 0 | 162 | 0 |
| B | 0 | 162 | 0 |
| C | 0 | 162 | 0 |
| D | 0 | 162 | 0 |
| Mode M9 | |||
|---|---|---|---|
| Quadrant | BADHDUFLAG | Total packets | Discarded packets |
| A | 0 | 6 | 0 |
| B | 0 | 6 | 0 |
| C | 0 | 6 | 0 |
| D | 0 | 6 | 0 |
| Quadrant | Total seconds | Saturated seconds | Saturation percentage |
|---|---|---|---|
| A | 7894 | 43 | 0.544718% |
| B | 7894 | 76 | 0.962757% |
| C | 7894 | 39 | 0.494046% |
| D | 7894 | 23 | 0.291361% |
Noise dominated data is calculated using 1-second bins in cleaned event files. If a bin has >2000 counts, and if more than 50% of those come from <1% of pixels, then it is considered to be noise-dominated and hence unusable.
| Quadrant | # 1 sec bins | Bins with >0 counts | Bins with >2000 counts | High rate bins dominated by noise | Noise dominated (total time) | Noise dominated (detector-on time) | Marked lightcurve |
|---|---|---|---|---|---|---|---|
| A | 8530 | 7896 | 3 | 3 | 0.04% | 0.04% | 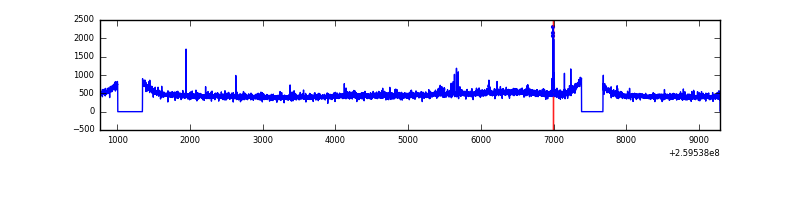 |
| B | 8530 | 7896 | 4 | 4 | 0.05% | 0.05% | 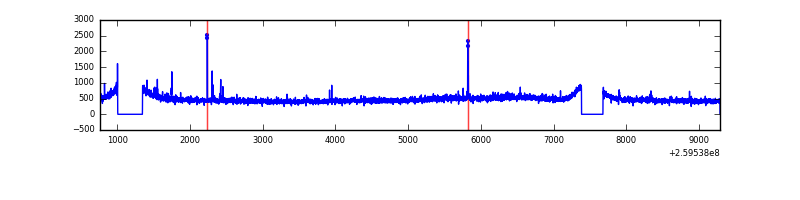 |
| C | 8530 | 7897 | 1 | 1 | 0.01% | 0.01% | 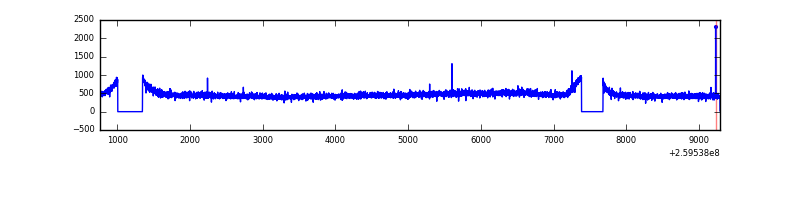 |
| D | 8530 | 7897 | 4 | 4 | 0.05% | 0.05% | 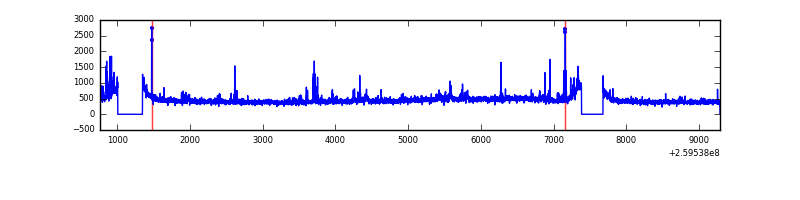 |
Top three noisy pixels from each quadrant. If the there are fewer than three noisy pixels in the level2.evt file, extra rows are filled as -1
| Pixel properties | Quadrant properties | ||||||
|---|---|---|---|---|---|---|---|
| Quadrant | DetID | PixID | Counts | Sigma | Mean | Median | Sigma |
| A | 15 | 69 | 23682 | 120.02 | 933 | 911 | 189.7 |
| A | 1 | 162 | 22115 | 111.76 | 933 | 911 | 189.7 |
| A | 0 | 226 | 8121 | 38.0 | 933 | 911 | 189.7 |
| B | 0 | 230 | 32898 | 175.41 | 942 | 917 | 182.3 |
| B | 0 | 214 | 22620 | 119.04 | 942 | 917 | 182.3 |
| B | 12 | 111 | 21705 | 114.02 | 942 | 917 | 182.3 |
| C | 3 | 233 | 73094 | 338.72 | 914 | 917 | 213.1 |
| C | 8 | 128 | 12820 | 55.86 | 914 | 917 | 213.1 |
| C | 14 | 234 | 8548 | 35.81 | 914 | 917 | 213.1 |
| D | 8 | 195 | 73120 | 329.67 | 901 | 874 | 219.1 |
| D | 2 | 136 | 58747 | 264.08 | 901 | 874 | 219.1 |
| D | 12 | 110 | 54398 | 244.24 | 901 | 874 | 219.1 |
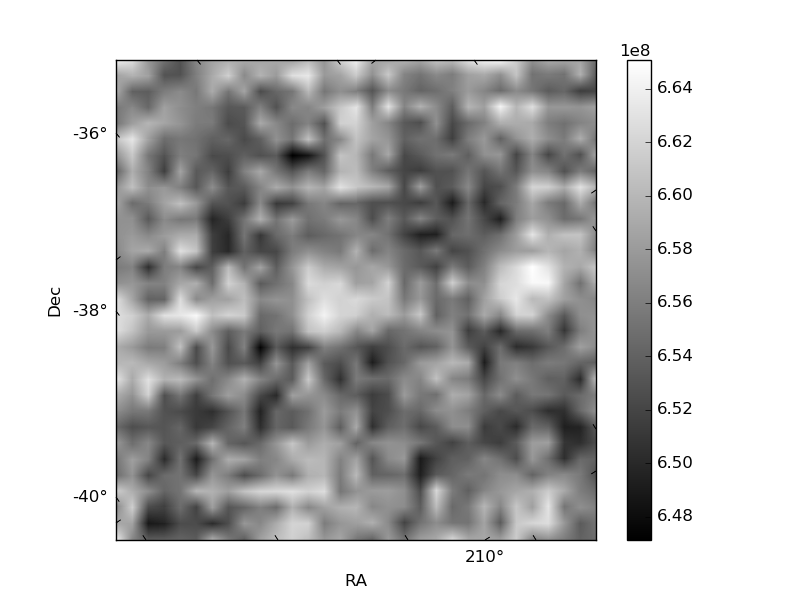
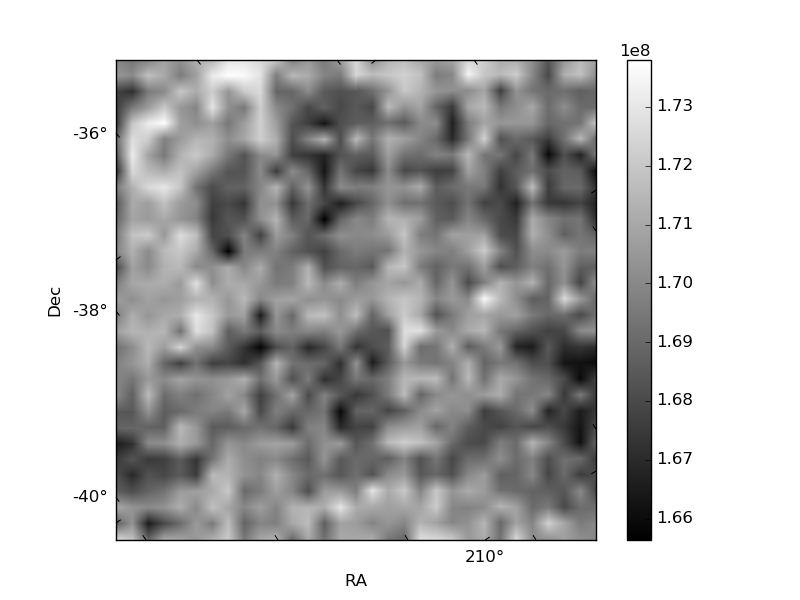
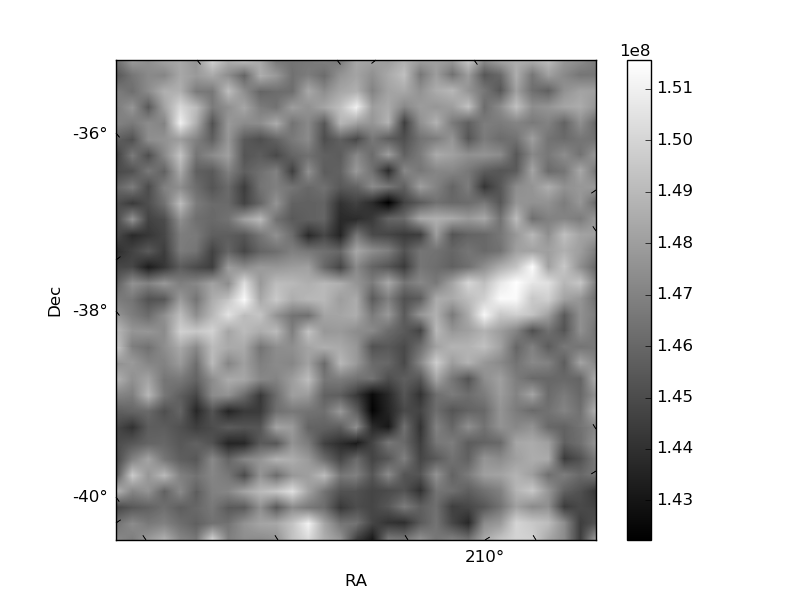
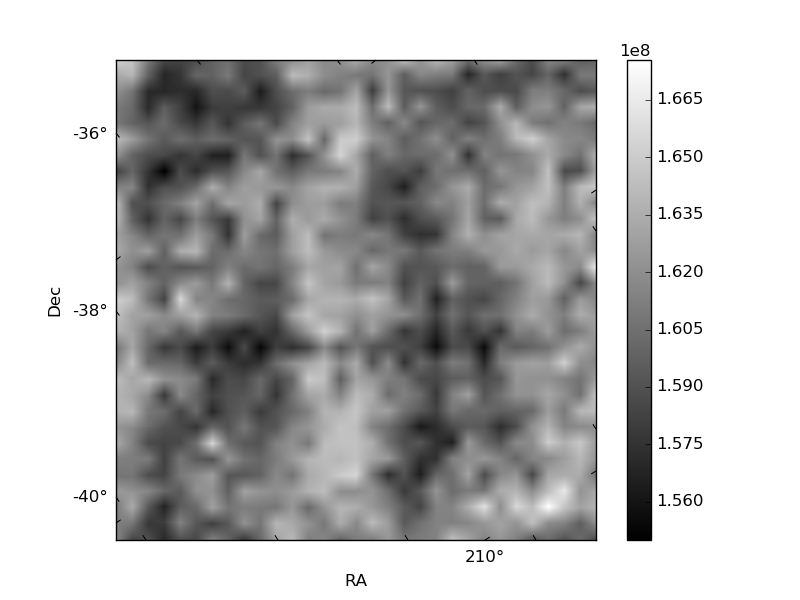
Histogram calculated using DETX and DETY for each event in the final _common_clean file
| Quadrant A | 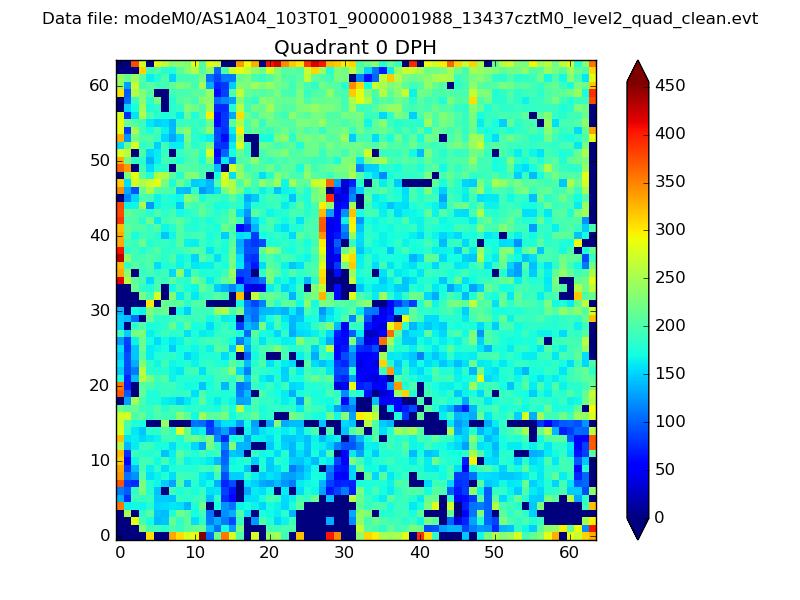 |
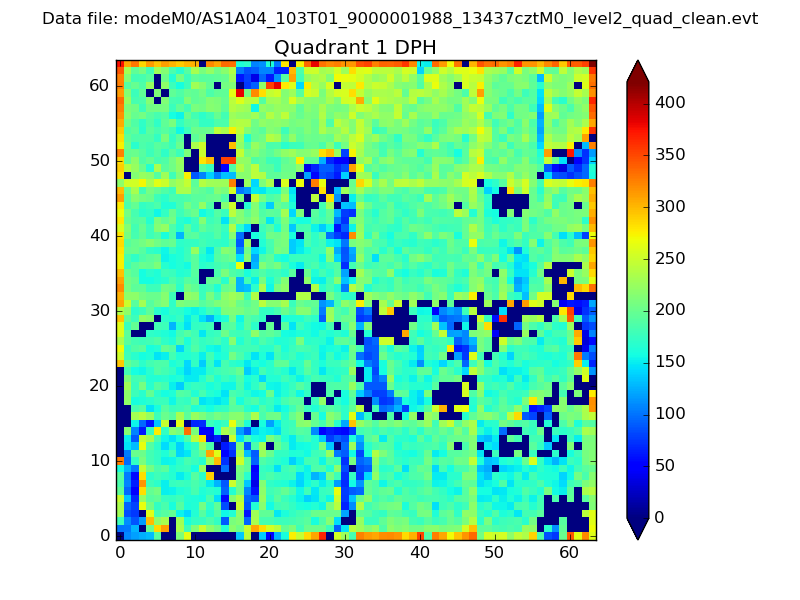 |
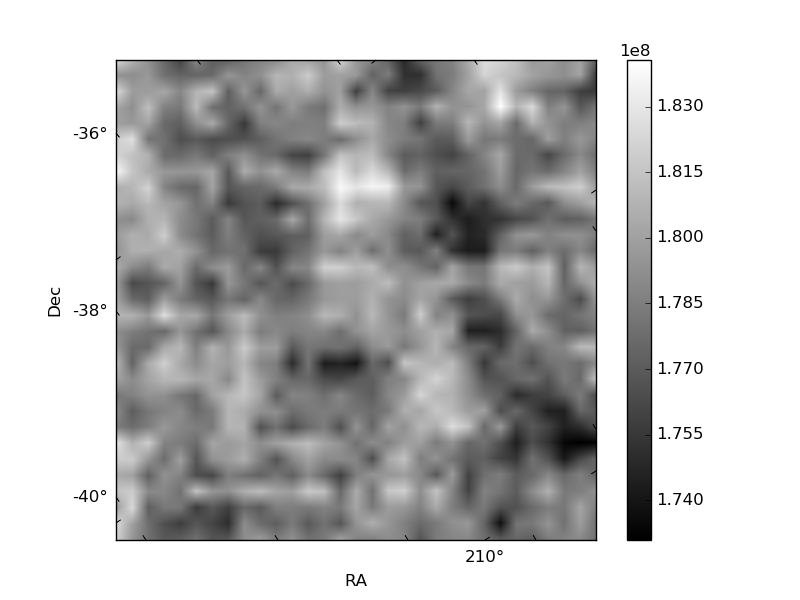
Quadrant B |
|---|---|---|---|
| Quadrant D | 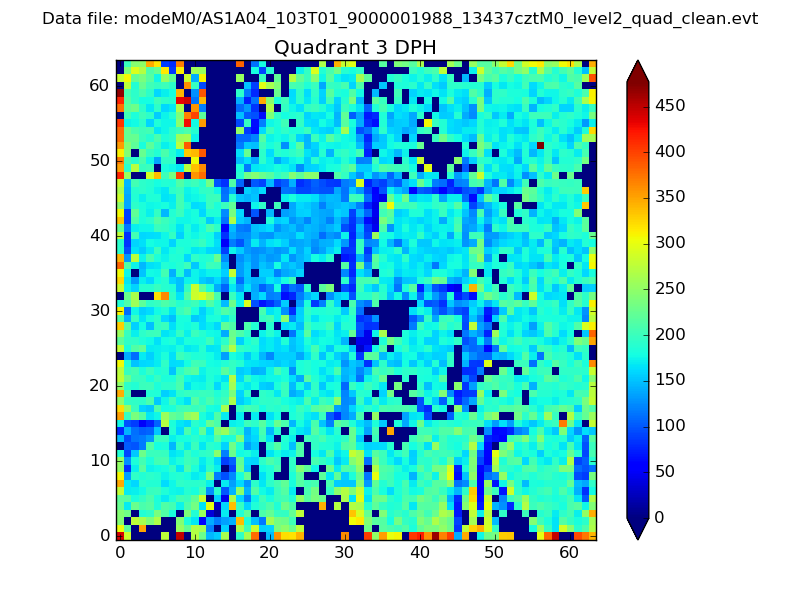 |
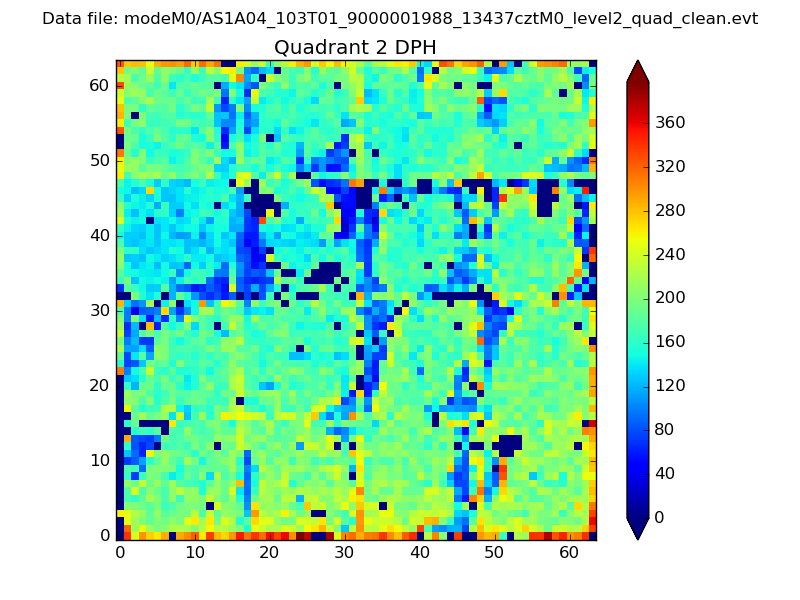 |
Quadrant C |
| Plot type | Count rate plots | Images |
|---|---|---|
| Comparison with Poisson distribution Blue bars denote a histogram of data divided into 1 sec bins. Red curve is a Poisson curve with rate = median count rate of data. |
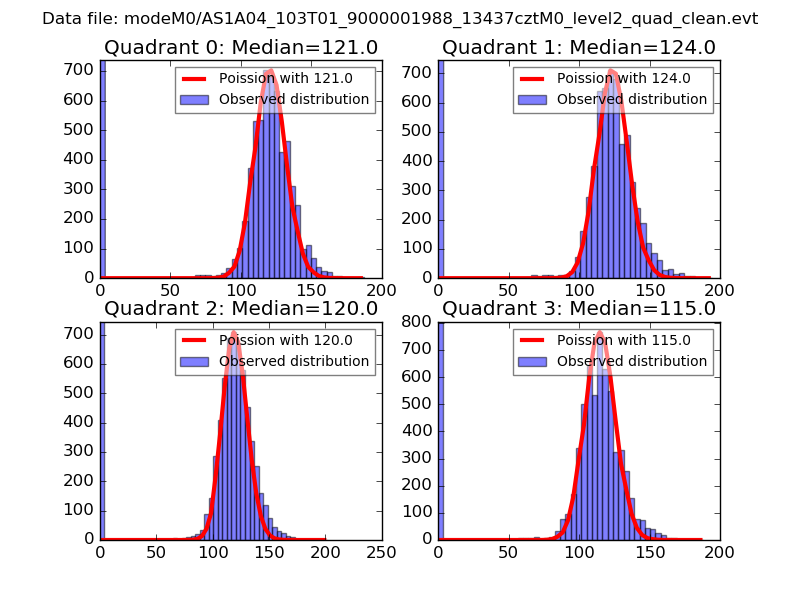 |
 |
| Quadrant-wise count rates Data is divided into 100 sec bins |
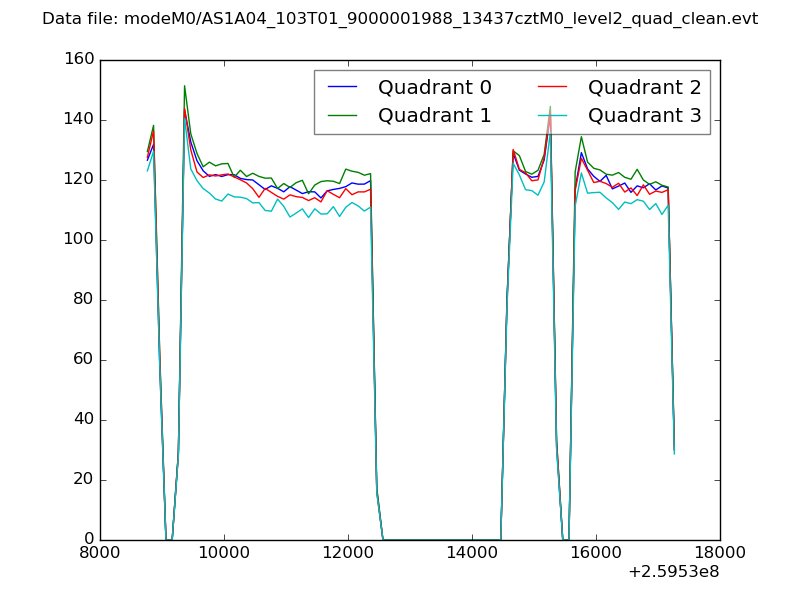 |
|
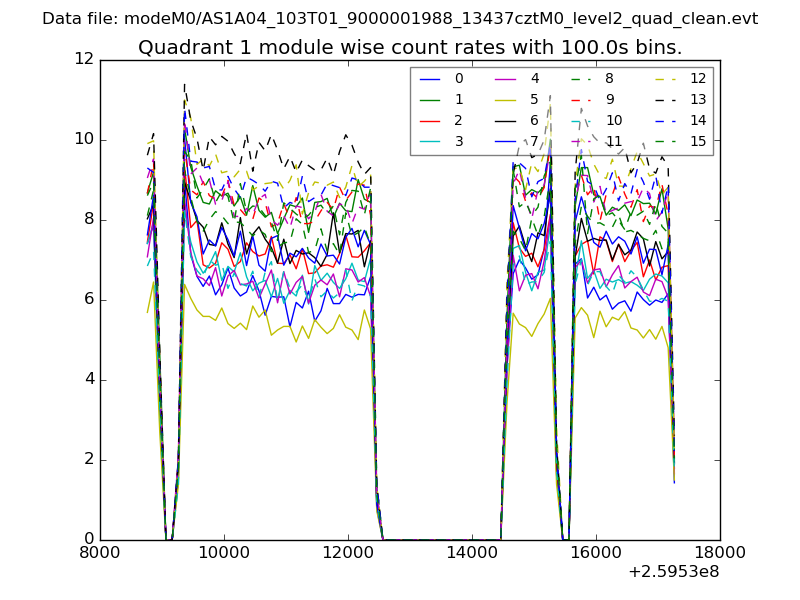
| Module-wise count rates for Quadrant A Data is divided into 100 sec bins |
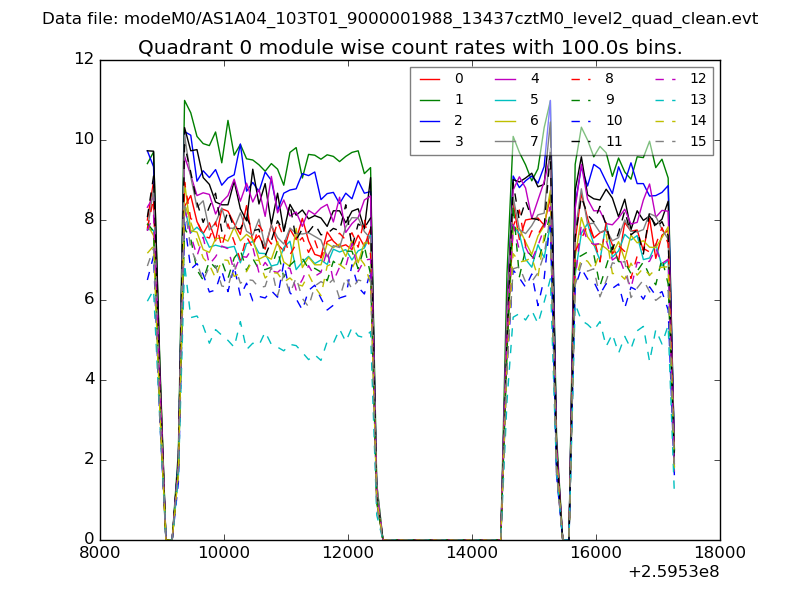 |
 |
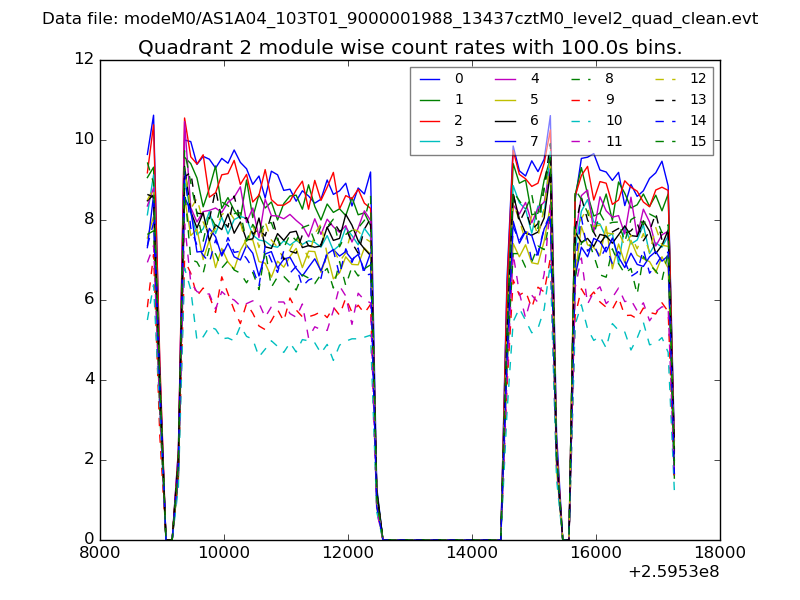
| Module-wise count rates for Quadrant B Data is divided into 100 sec bins |
 |
 |
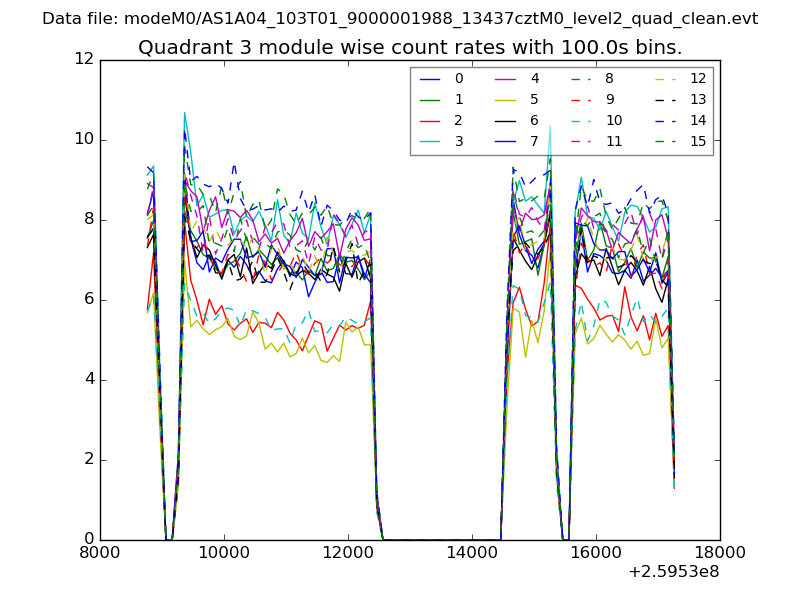
| Module-wise count rates for Quadrant C Data is divided into 100 sec bins |
 |
 |
| Module-wise count rates for Quadrant D Data is divided into 100 sec bins |
 |
 |
| Parameter | Plot |
|---|---|
| CZT HV Monitor | 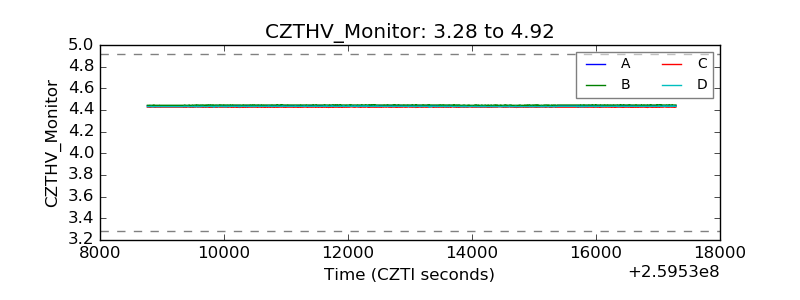 |
| D_VDD | 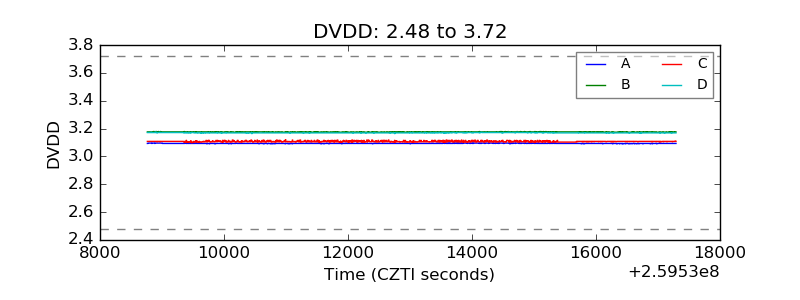 |
| Temperature 1 | 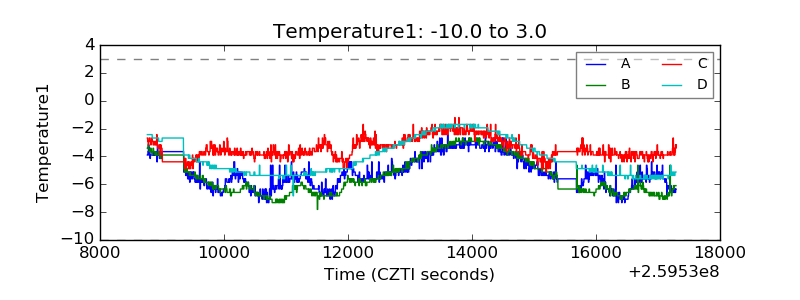 |
| Veto HV Monitor | 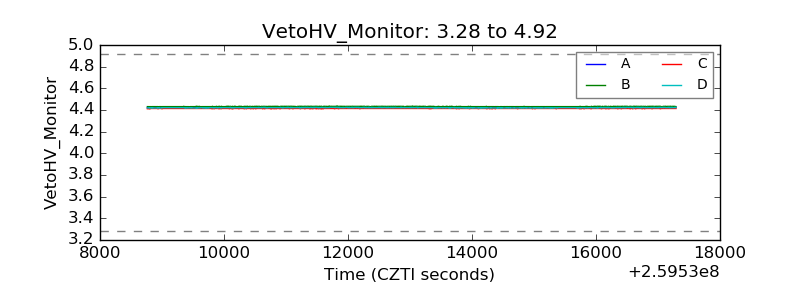 |
| Veto LLD |  |
| Alpha Counter | 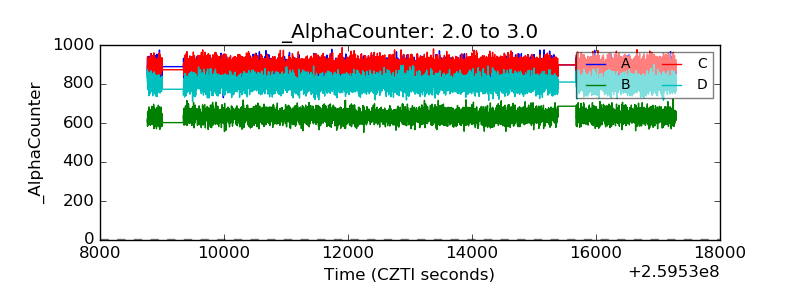 |
| _CPM_Rate | 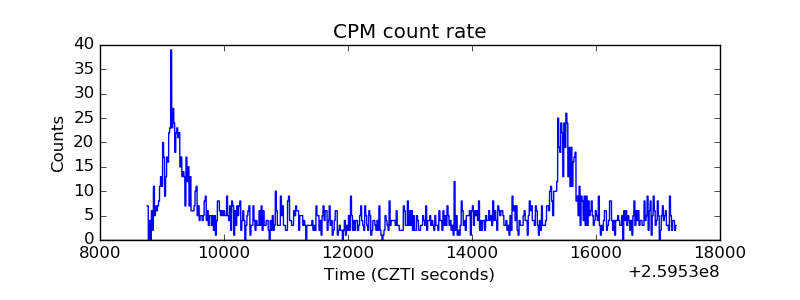 |
| CZT Counter | 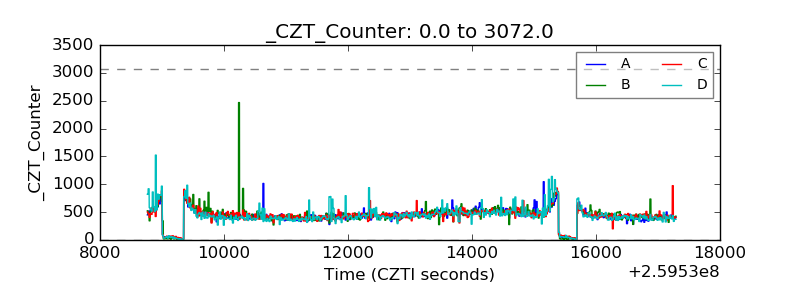 |
| +2.5 Volts monitor | 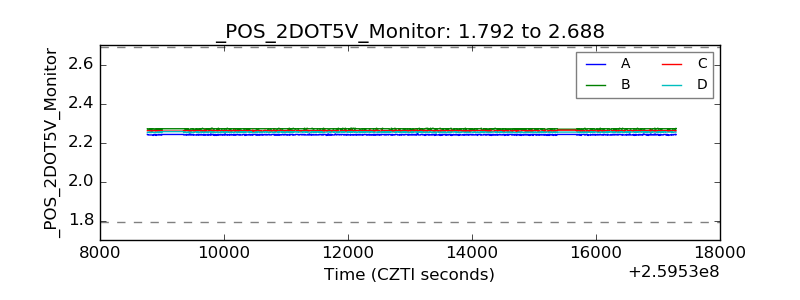 |
| +5 Volts monitor | 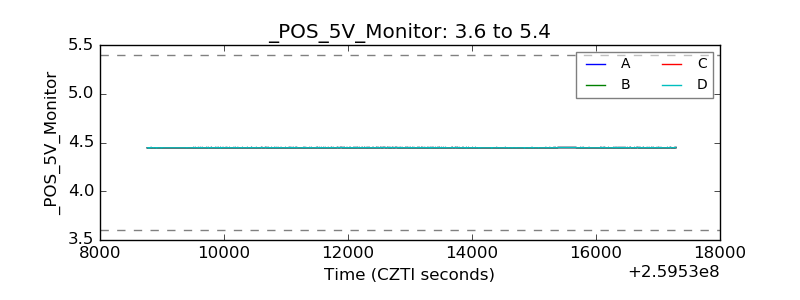 |
| _ROLL_ROT | 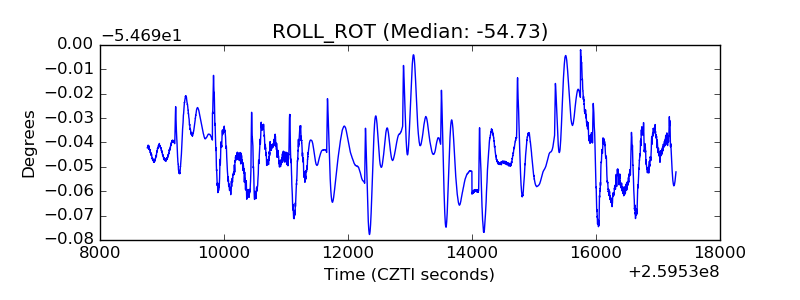 |
| _Roll_DEC | 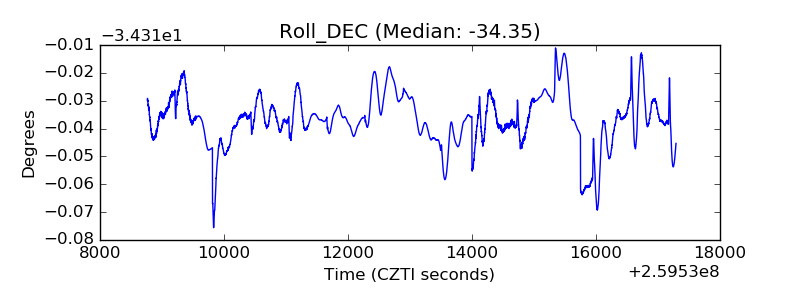 |
| _Roll_RA | 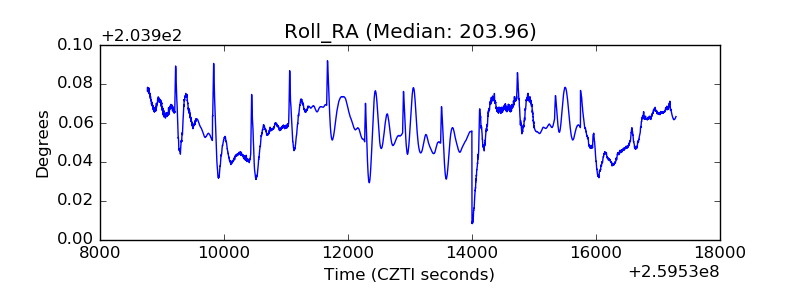 |
| Veto Counter | 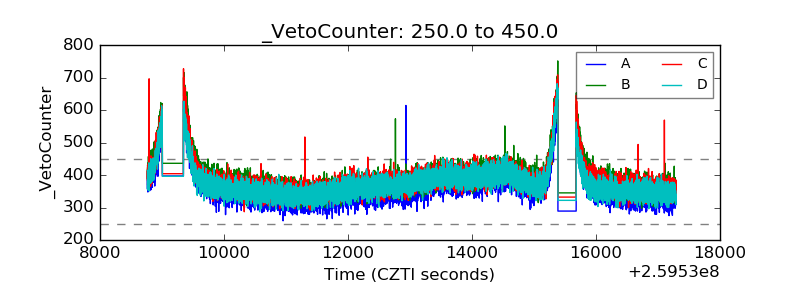 |