| Param | Original file | Final file |
|---|---|---|
| Filename | modeM0/AS1A04_103T01_9000001988_13440cztM0_level2.evt | modeM0/AS1A04_103T01_9000001988_13440cztM0_level2_quad_clean.evt |
| Size (bytes) | 1,232,424,000 | 252,264,960 |
| Size | 1.1 GB | 240.6 MB |
| Events in quadrant A | 8,862,740 | 1,591,083 |
| Events in quadrant B | 9,064,303 | 1,621,888 |
| Events in quadrant C | 8,978,717 | 1,577,322 |
| Events in quadrant D | 9,100,702 | 1,509,435 |
| Mode M0 | |||
|---|---|---|---|
| Quadrant | BADHDUFLAG | Total packets | Discarded packets |
| A | 0 | 39695 | 5 |
| B | 0 | 39776 | 4 |
| C | 0 | 39736 | 4 |
| D | 0 | 41098 | 4 |
| Mode SS | |||
|---|---|---|---|
| Quadrant | BADHDUFLAG | Total packets | Discarded packets |
| A | 0 | 398 | 0 |
| B | 0 | 398 | 0 |
| C | 0 | 398 | 0 |
| D | 0 | 398 | 0 |
| Mode M9 | |||
|---|---|---|---|
| Quadrant | BADHDUFLAG | Total packets | Discarded packets |
| A | 0 | 19 | 0 |
| B | 0 | 19 | 0 |
| C | 0 | 19 | 0 |
| D | 0 | 19 | 0 |
| Quadrant | Total seconds | Saturated seconds | Saturation percentage |
|---|---|---|---|
| A | 19463 | 148 | 0.760417% |
| B | 19463 | 197 | 1.012177% |
| C | 19463 | 192 | 0.986487% |
| D | 19463 | 210 | 1.078970% |
Noise dominated data is calculated using 1-second bins in cleaned event files. If a bin has >2000 counts, and if more than 50% of those come from <1% of pixels, then it is considered to be noise-dominated and hence unusable.
| Quadrant | # 1 sec bins | Bins with >0 counts | Bins with >2000 counts | High rate bins dominated by noise | Noise dominated (total time) | Noise dominated (detector-on time) | Marked lightcurve |
|---|---|---|---|---|---|---|---|
| A | 21419 | 19464 | 4 | 4 | 0.02% | 0.02% | 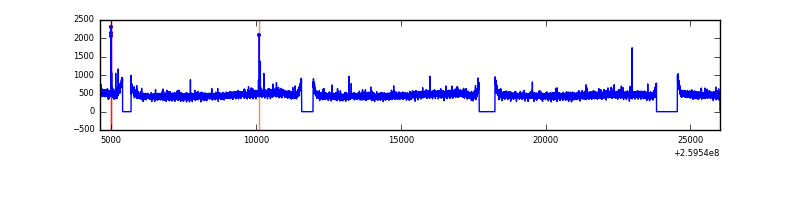 |
| B | 21419 | 19464 | 2 | 2 | 0.01% | 0.01% | 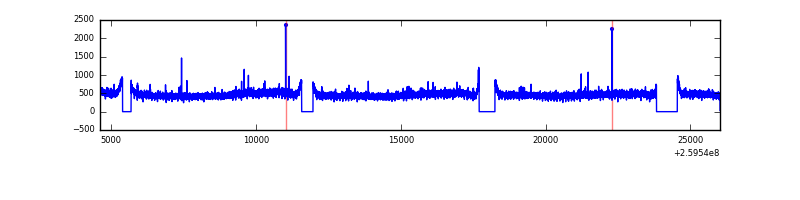 |
| C | 21419 | 19465 | 6 | 6 | 0.03% | 0.03% | 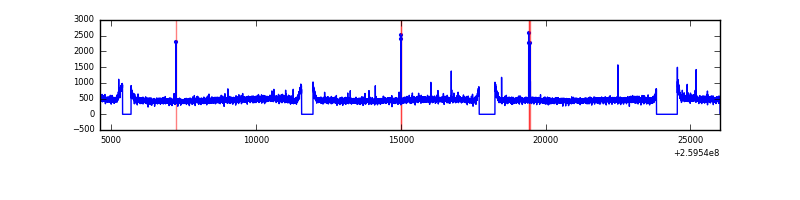 |
| D | 21419 | 19465 | 56 | 56 | 0.26% | 0.29% | 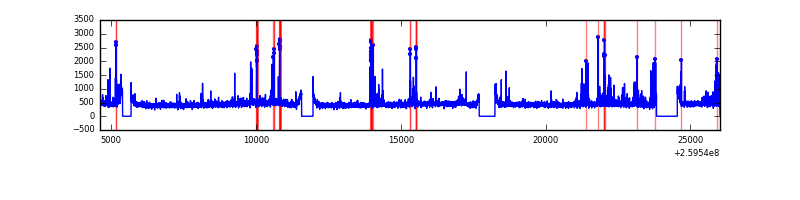 |
Top three noisy pixels from each quadrant. If the there are fewer than three noisy pixels in the level2.evt file, extra rows are filled as -1
| Pixel properties | Quadrant properties | ||||||
|---|---|---|---|---|---|---|---|
| Quadrant | DetID | PixID | Counts | Sigma | Mean | Median | Sigma |
| A | 15 | 69 | 33889 | 68.45 | 2288 | 2239 | 462.4 |
| A | 0 | 226 | 20243 | 38.94 | 2288 | 2239 | 462.4 |
| A | 1 | 162 | 19125 | 36.52 | 2288 | 2239 | 462.4 |
| B | 12 | 111 | 53392 | 116.64 | 2295 | 2233 | 438.6 |
| B | 11 | 111 | 44937 | 97.36 | 2295 | 2233 | 438.6 |
| B | 3 | 209 | 38106 | 81.79 | 2295 | 2233 | 438.6 |
| C | 3 | 233 | 191750 | 364.27 | 2243 | 2250 | 520.2 |
| C | 14 | 234 | 29825 | 53.01 | 2243 | 2250 | 520.2 |
| C | 13 | 61 | 16147 | 26.71 | 2243 | 2250 | 520.2 |
| D | 13 | 249 | 342929 | 640.53 | 2217 | 2152 | 532.0 |
| D | 12 | 110 | 158300 | 293.5 | 2217 | 2152 | 532.0 |
| D | 13 | 104 | 90908 | 166.83 | 2217 | 2152 | 532.0 |
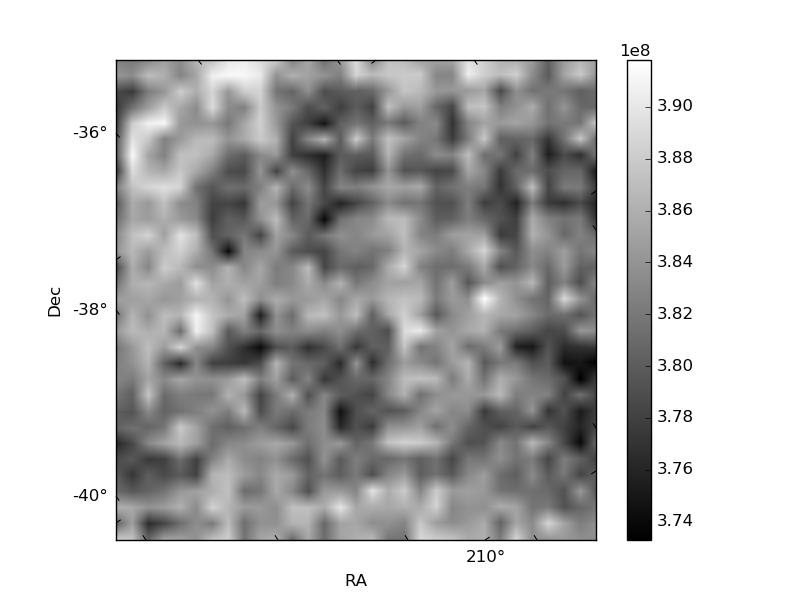
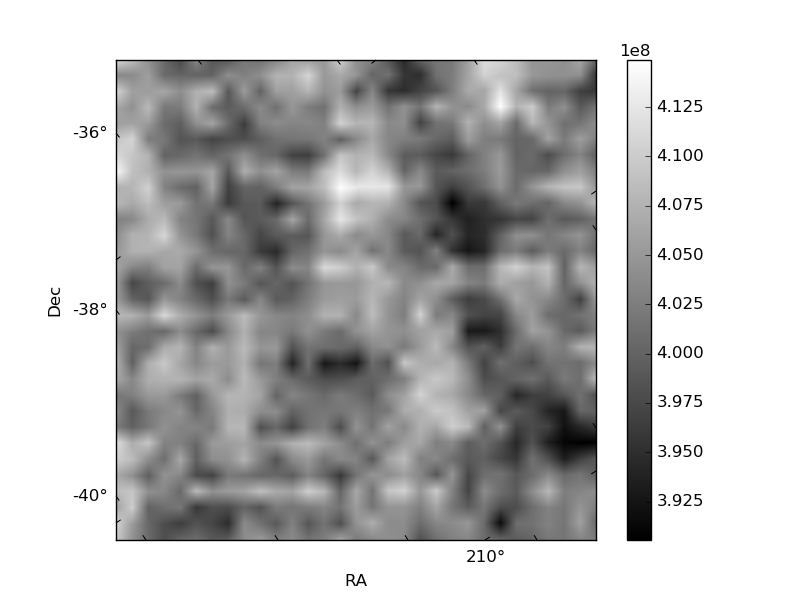
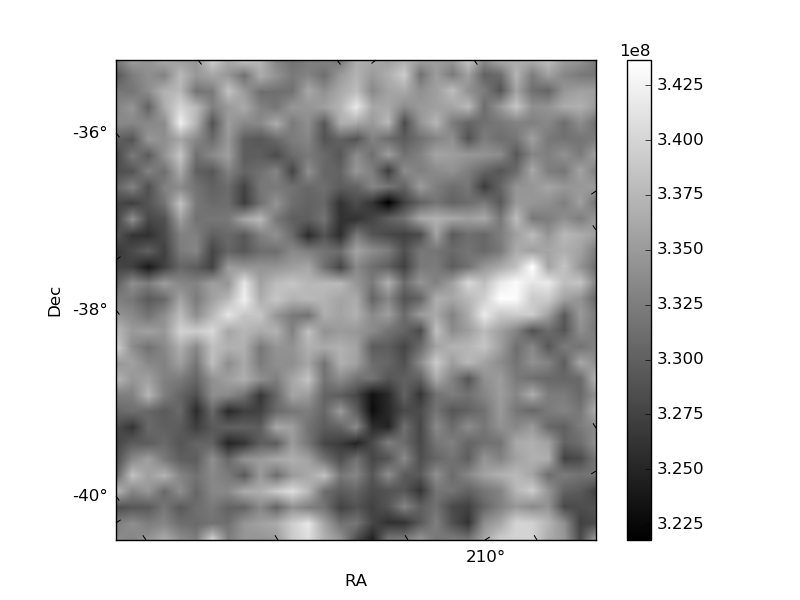
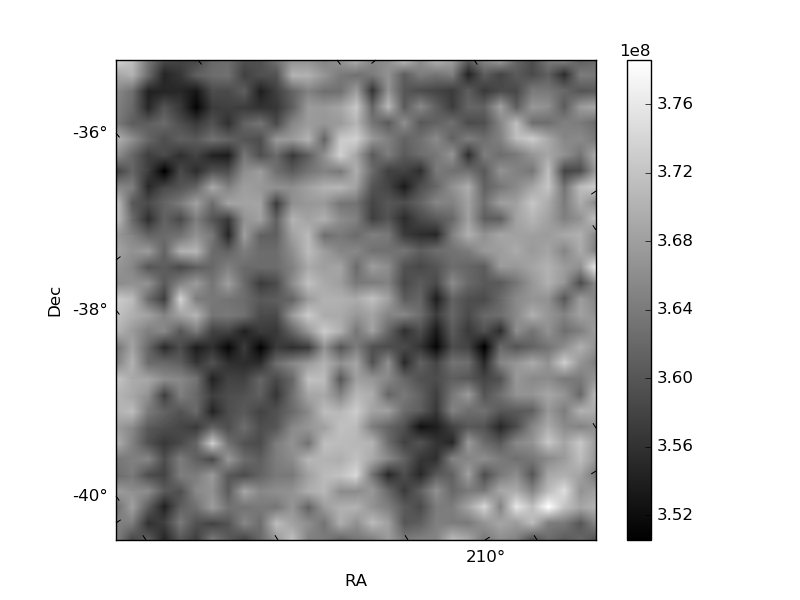
Histogram calculated using DETX and DETY for each event in the final _common_clean file
| Quadrant A | 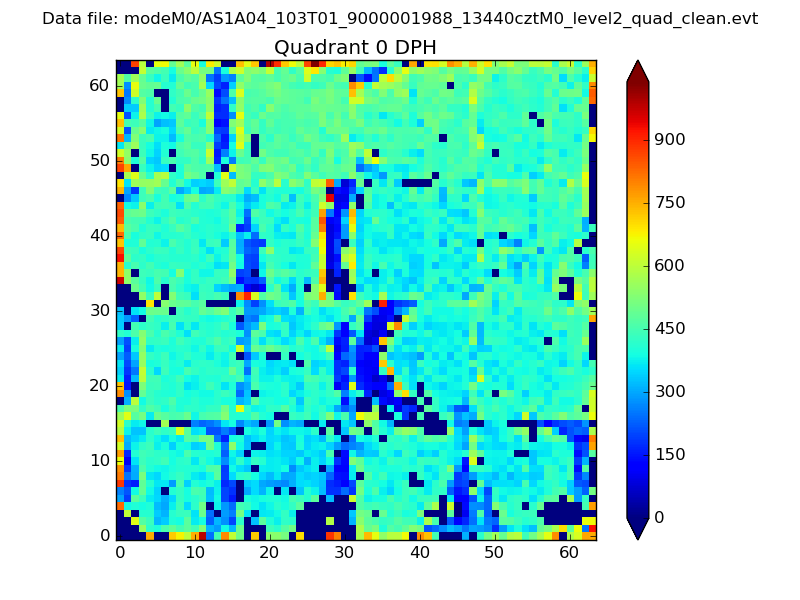 |
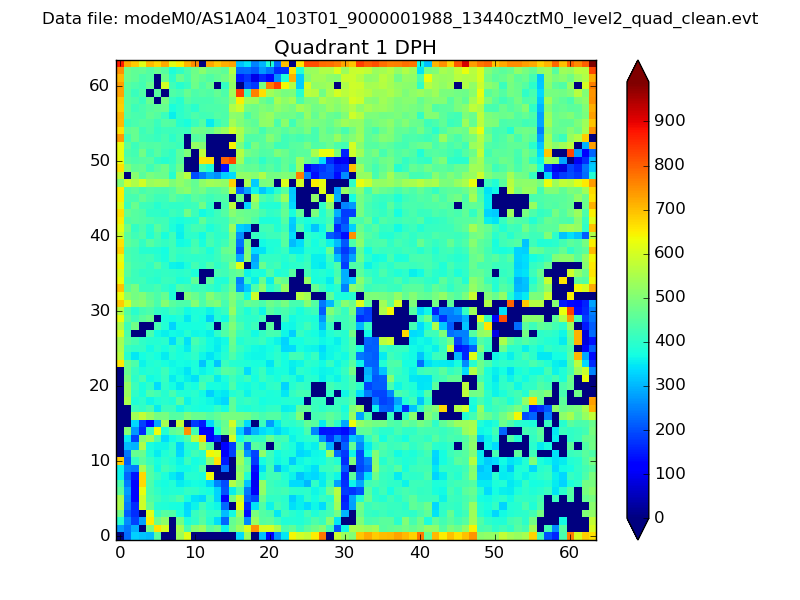 |
Quadrant B |
|---|---|---|---|
| Quadrant D | 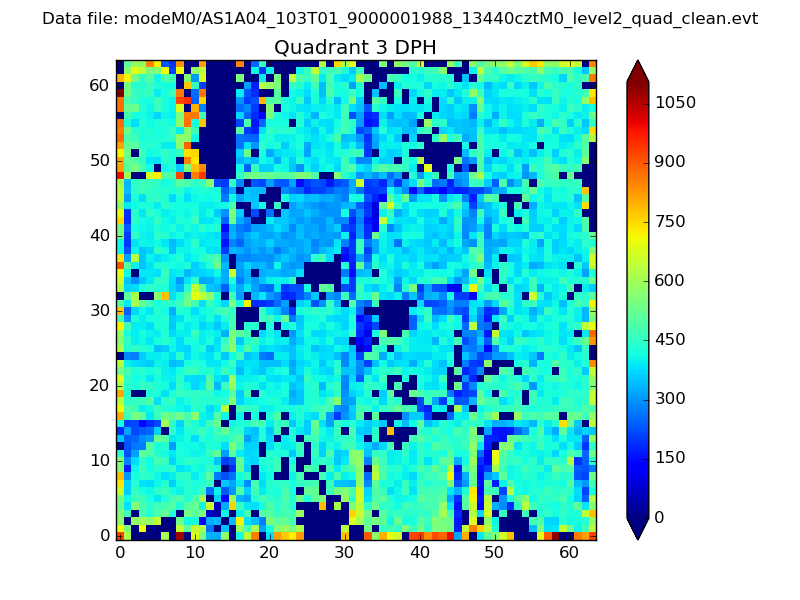 |
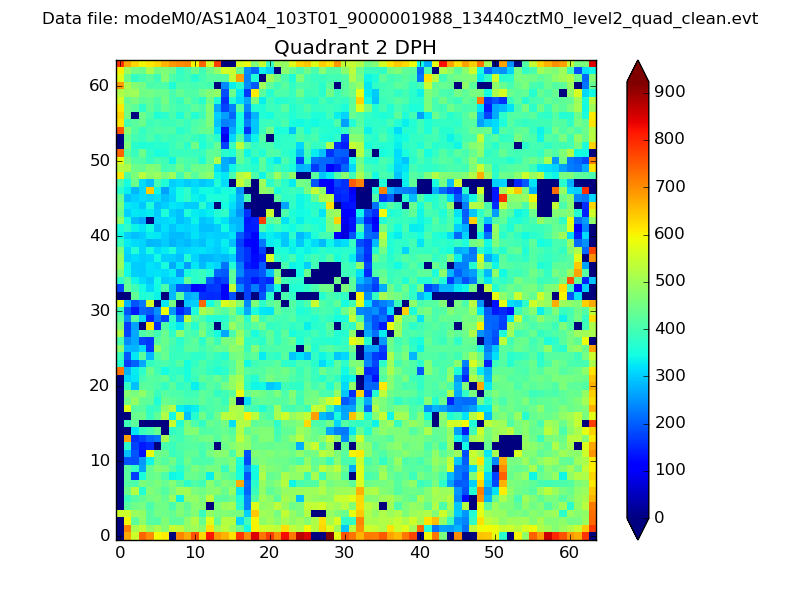 |
Quadrant C |
| Plot type | Count rate plots | Images |
|---|---|---|
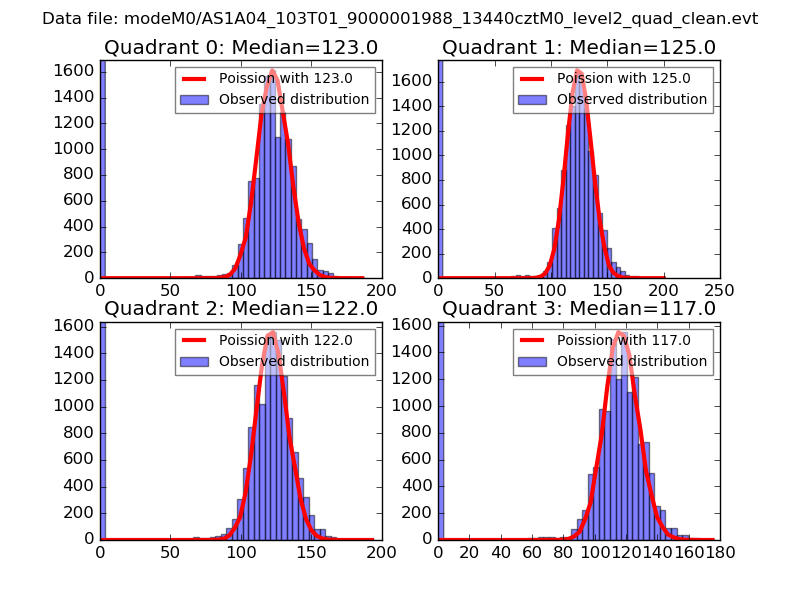
| Comparison with Poisson distribution Blue bars denote a histogram of data divided into 1 sec bins. Red curve is a Poisson curve with rate = median count rate of data. |
 |
 |
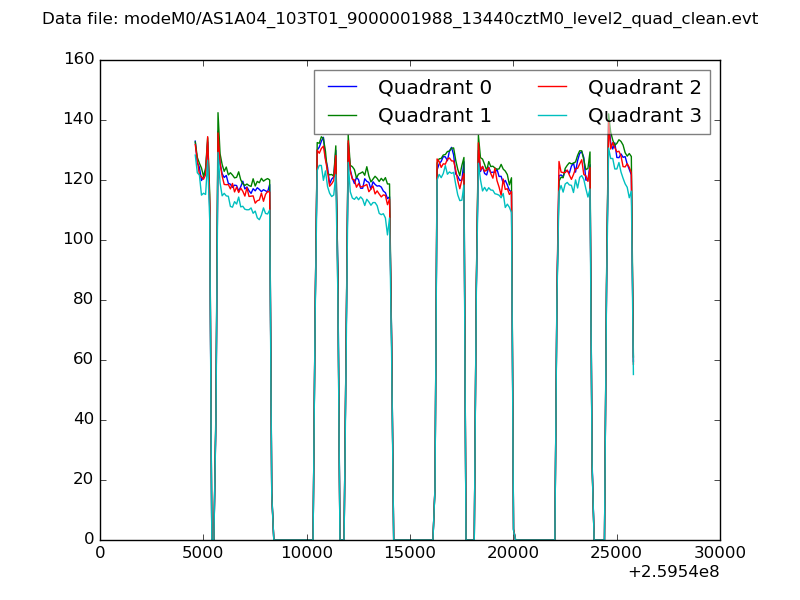
| Quadrant-wise count rates Data is divided into 100 sec bins |
 |
|
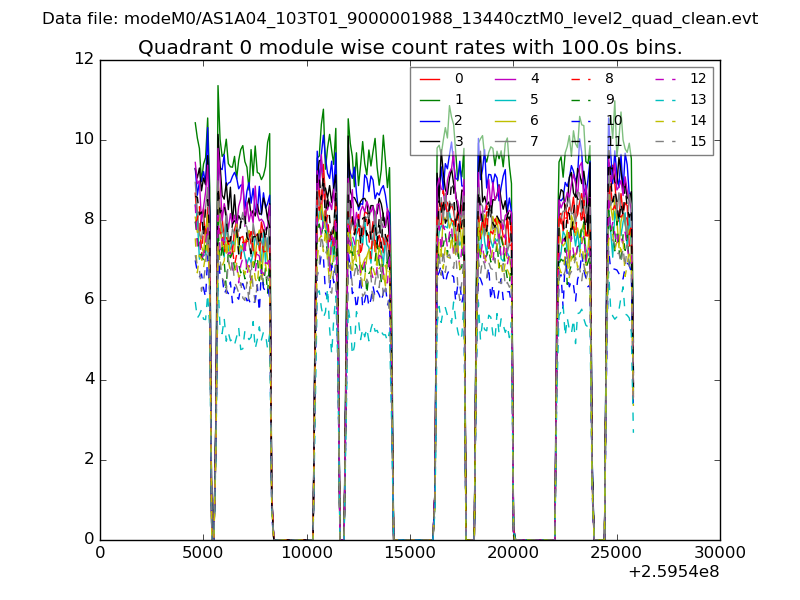
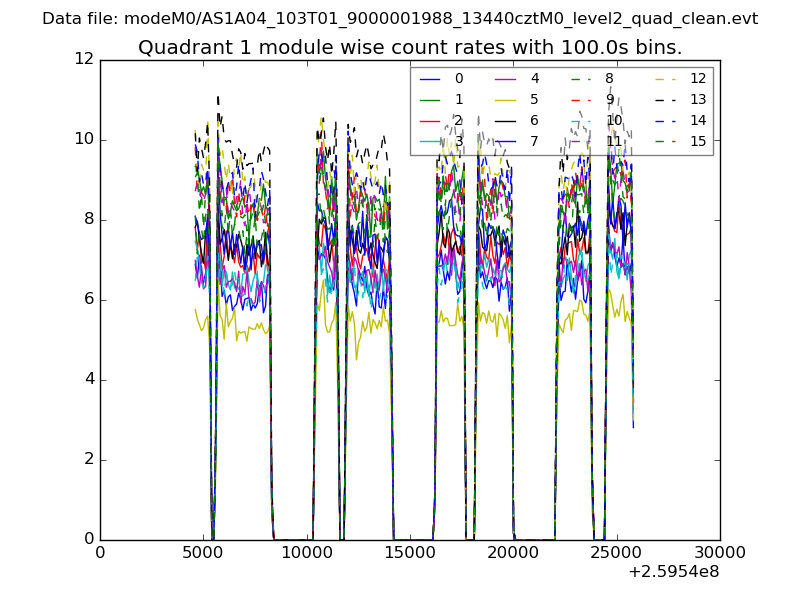
| Module-wise count rates for Quadrant A Data is divided into 100 sec bins |
 |
 |
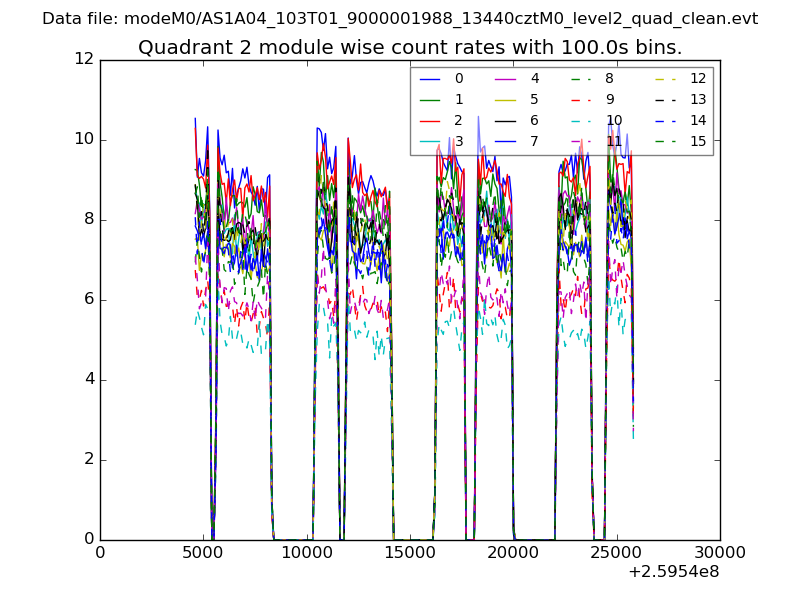
| Module-wise count rates for Quadrant B Data is divided into 100 sec bins |
 |
 |
| Module-wise count rates for Quadrant C Data is divided into 100 sec bins |
 |
 |
| Module-wise count rates for Quadrant D Data is divided into 100 sec bins |
 |
 |
| Parameter | Plot |
|---|---|
| CZT HV Monitor | 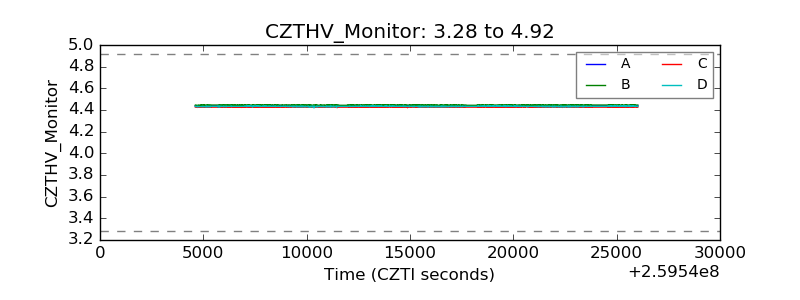 |
| D_VDD | 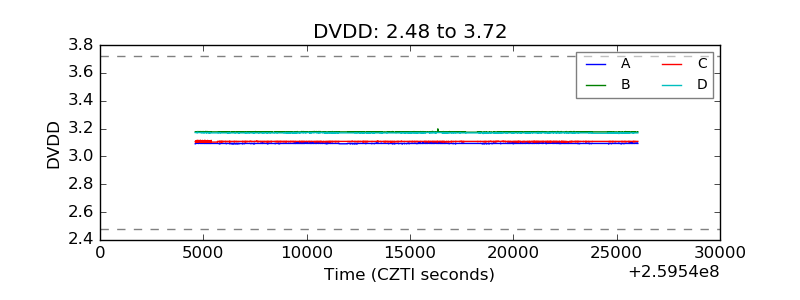 |
| Temperature 1 |  |
| Veto HV Monitor | 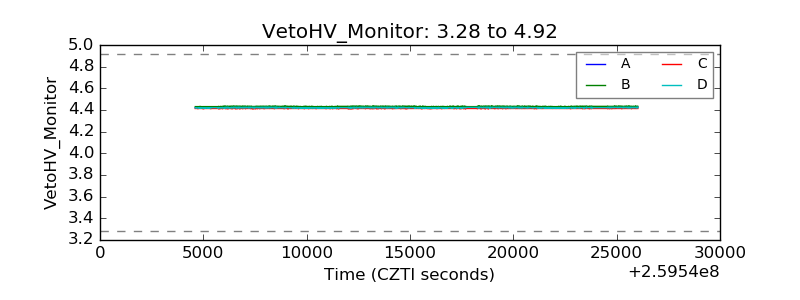 |
| Veto LLD | 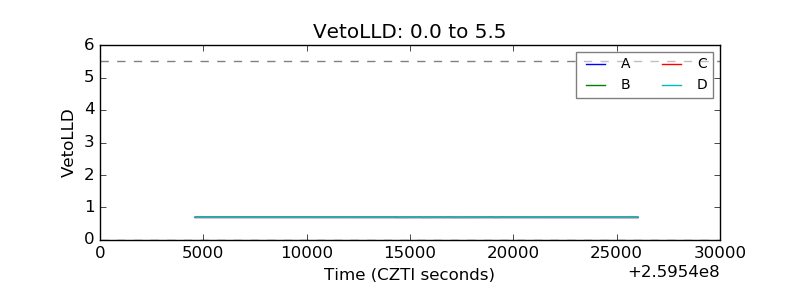 |
| Alpha Counter | 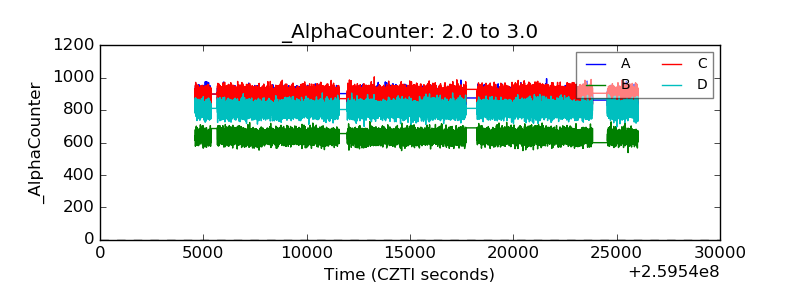 |
| _CPM_Rate | 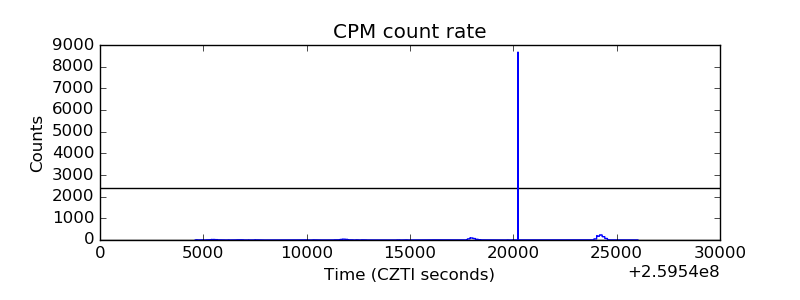 |
| CZT Counter | 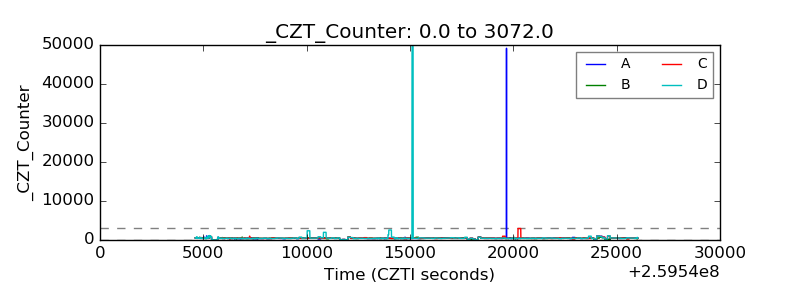 |
| +2.5 Volts monitor |  |
| +5 Volts monitor |  |
| _ROLL_ROT | 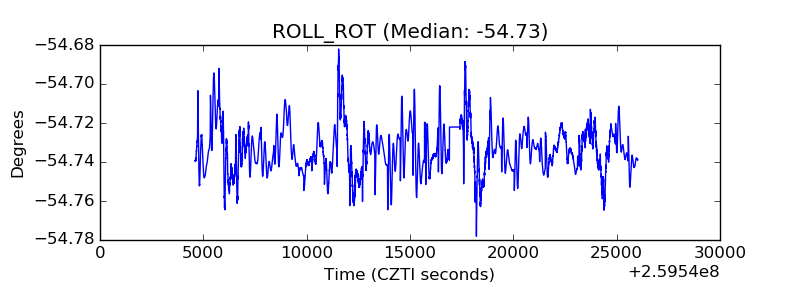 |
| _Roll_DEC |  |
| _Roll_RA | 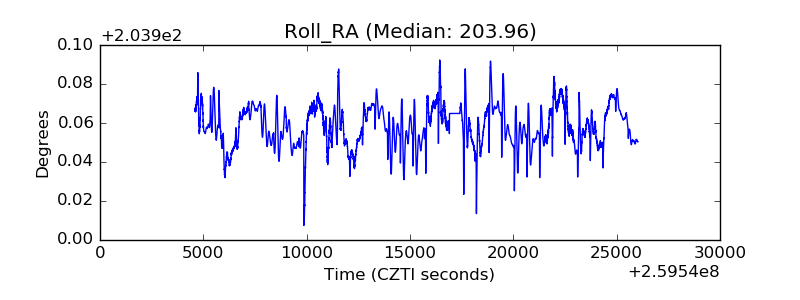 |
| Veto Counter | 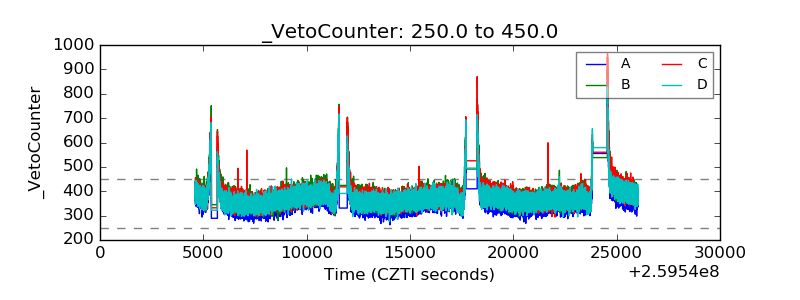 |