| Param | Original file | Final file |
|---|---|---|
| Filename | modeM0/AS1A04_103T01_9000001988_13443cztM0_level2.evt | modeM0/AS1A04_103T01_9000001988_13443cztM0_level2_quad_clean.evt |
| Size (bytes) | 425,689,920 | 68,374,080 |
| Size | 406.0 MB | 65.2 MB |
| Events in quadrant A | 2,959,731 | 410,657 |
| Events in quadrant B | 3,075,552 | 419,691 |
| Events in quadrant C | 2,941,768 | 410,255 |
| Events in quadrant D | 3,488,551 | 391,842 |
| Mode M0 | |||
|---|---|---|---|
| Quadrant | BADHDUFLAG | Total packets | Discarded packets |
| A | 0 | 12936 | 2 |
| B | 0 | 13132 | 1 |
| C | 0 | 12895 | 1 |
| D | 0 | 14655 | 1 |
| Mode SS | |||
|---|---|---|---|
| Quadrant | BADHDUFLAG | Total packets | Discarded packets |
| A | 0 | 128 | 0 |
| B | 0 | 128 | 0 |
| C | 0 | 128 | 0 |
| D | 0 | 128 | 0 |
| Mode M9 | |||
|---|---|---|---|
| Quadrant | BADHDUFLAG | Total packets | Discarded packets |
| A | 0 | 10 | 0 |
| B | 0 | 10 | 0 |
| C | 0 | 10 | 0 |
| D | 0 | 10 | 0 |
| Quadrant | Total seconds | Saturated seconds | Saturation percentage |
|---|---|---|---|
| A | 6271 | 44 | 0.701642% |
| B | 6271 | 49 | 0.781375% |
| C | 6271 | 30 | 0.478393% |
| D | 6271 | 71 | 1.132196% |
Noise dominated data is calculated using 1-second bins in cleaned event files. If a bin has >2000 counts, and if more than 50% of those come from <1% of pixels, then it is considered to be noise-dominated and hence unusable.
| Quadrant | # 1 sec bins | Bins with >0 counts | Bins with >2000 counts | High rate bins dominated by noise | Noise dominated (total time) | Noise dominated (detector-on time) | Marked lightcurve |
|---|---|---|---|---|---|---|---|
| A | 7322 | 6272 | 0 | 0 | 0.00% | 0.00% | 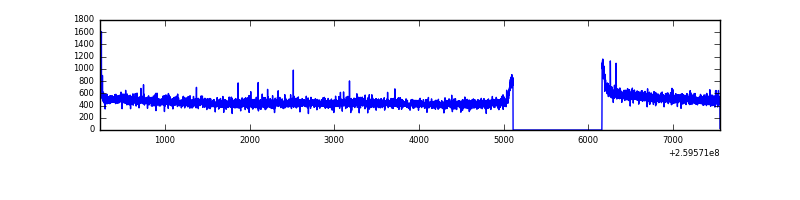 |
| B | 7322 | 6272 | 3 | 3 | 0.04% | 0.05% | 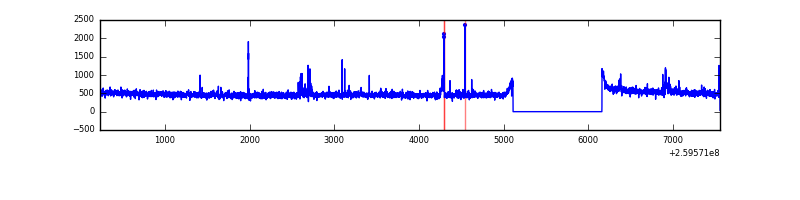 |
| C | 7322 | 6272 | 1 | 1 | 0.01% | 0.02% | 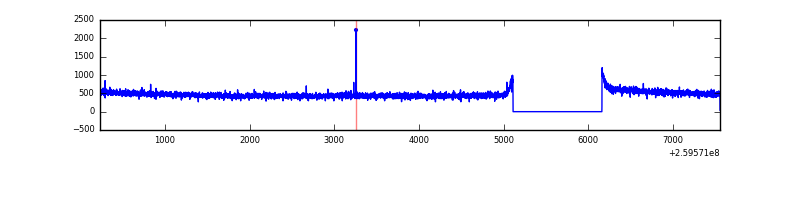 |
| D | 7322 | 6272 | 44 | 44 | 0.60% | 0.70% |  |
Top three noisy pixels from each quadrant. If the there are fewer than three noisy pixels in the level2.evt file, extra rows are filled as -1
| Pixel properties | Quadrant properties | ||||||
|---|---|---|---|---|---|---|---|
| Quadrant | DetID | PixID | Counts | Sigma | Mean | Median | Sigma |
| A | 15 | 69 | 15018 | 92.18 | 762 | 746 | 154.8 |
| A | 1 | 162 | 10472 | 62.82 | 762 | 746 | 154.8 |
| A | 0 | 226 | 6756 | 38.82 | 762 | 746 | 154.8 |
| B | 0 | 214 | 41540 | 283.24 | 760 | 742 | 144.0 |
| B | 3 | 64 | 25183 | 169.68 | 760 | 742 | 144.0 |
| B | 10 | 244 | 19108 | 127.5 | 760 | 742 | 144.0 |
| C | 3 | 233 | 30294 | 171.84 | 745 | 750 | 171.9 |
| C | 13 | 61 | 5250 | 26.17 | 745 | 750 | 171.9 |
| C | 14 | 234 | 3366 | 15.22 | 745 | 750 | 171.9 |
| D | 13 | 249 | 661706 | 3728.98 | 740 | 718 | 177.3 |
| D | 2 | 234 | 22036 | 120.27 | 740 | 718 | 177.3 |
| D | 13 | 172 | 15263 | 82.06 | 740 | 718 | 177.3 |
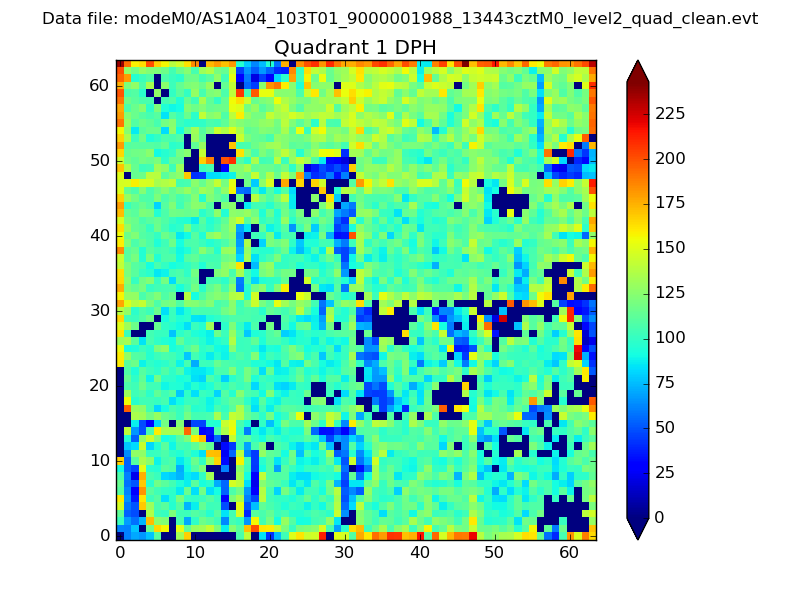
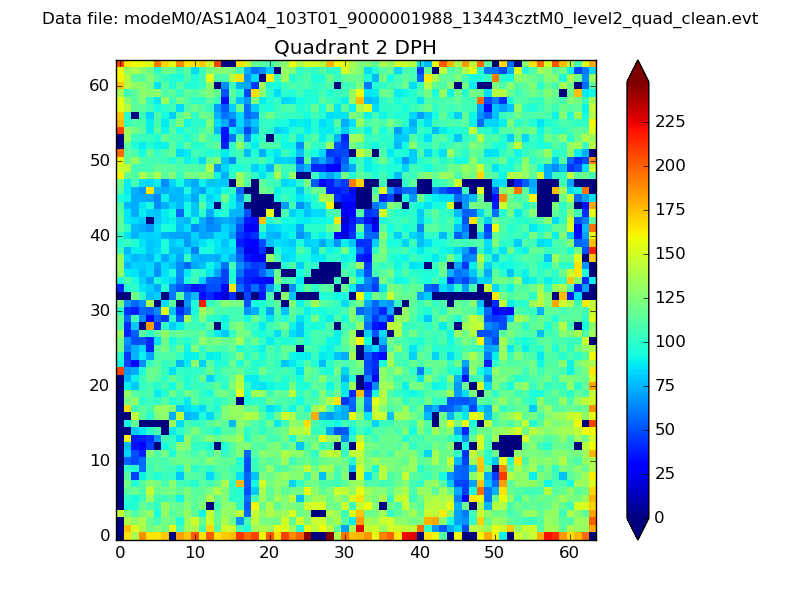
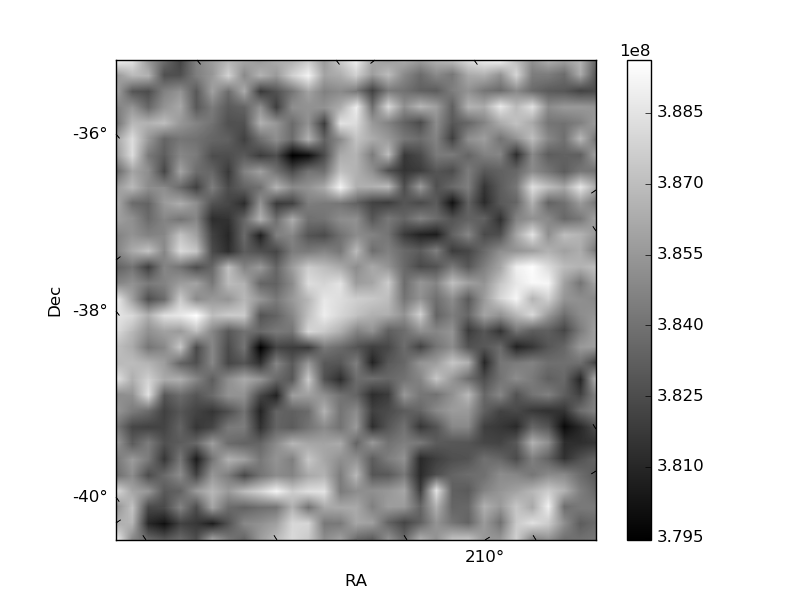
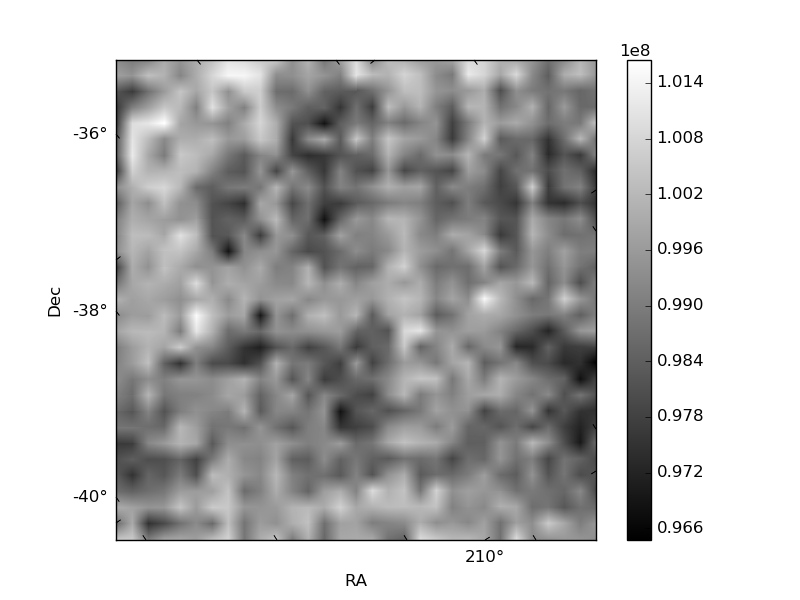
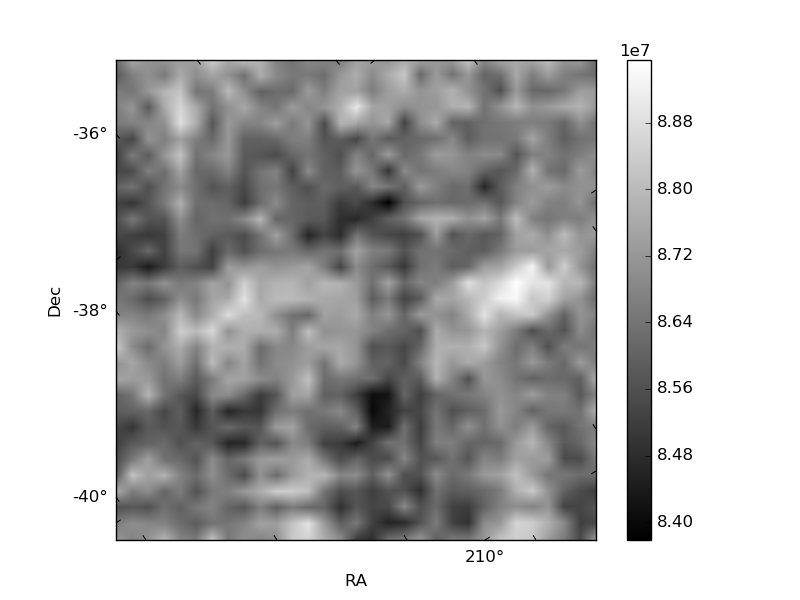
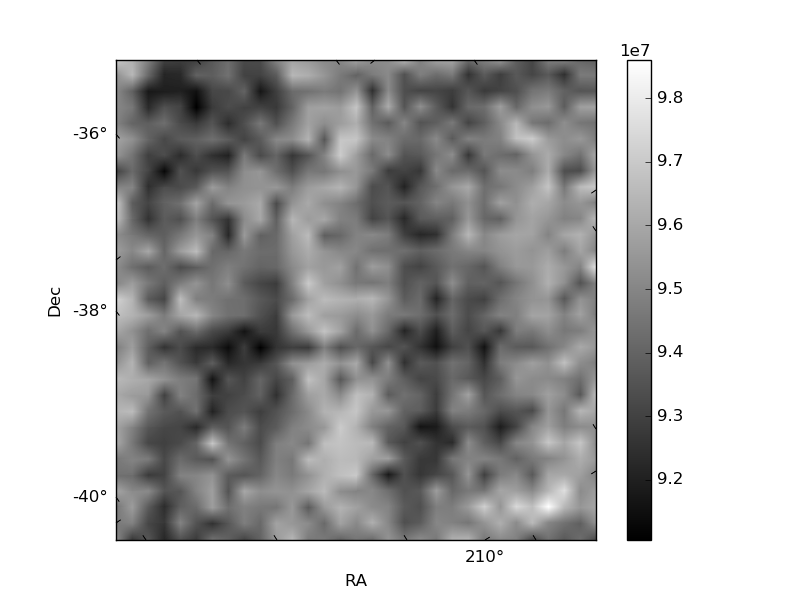
Histogram calculated using DETX and DETY for each event in the final _common_clean file
| Quadrant A | 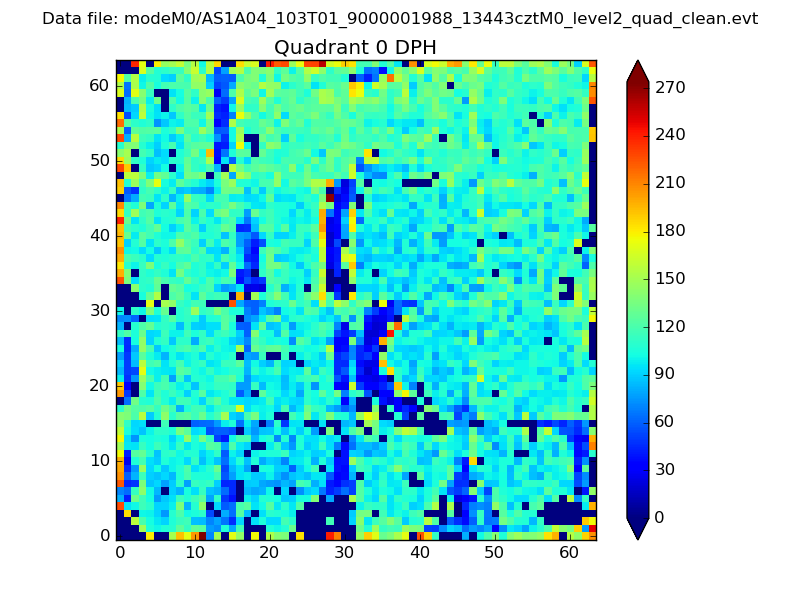 |
 |
Quadrant B |
|---|---|---|---|
| Quadrant D | 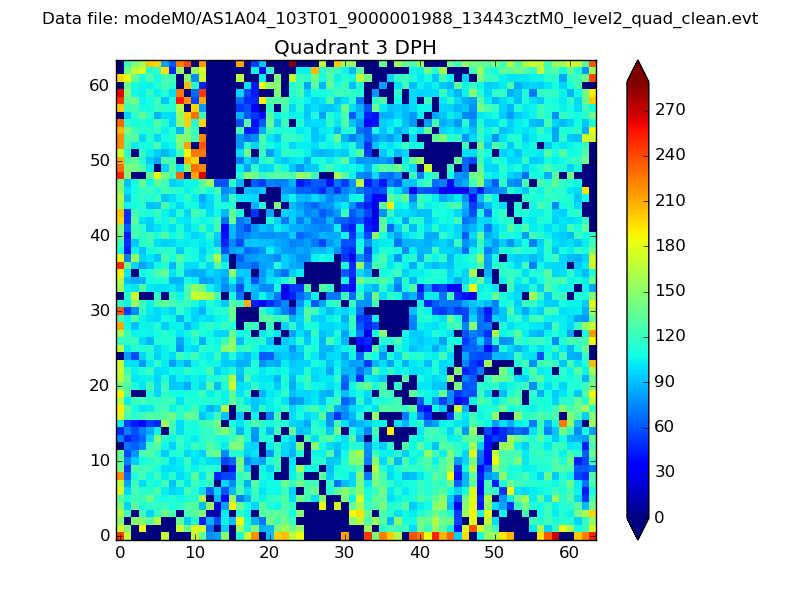 |
 |
Quadrant C |
| Plot type | Count rate plots | Images |
|---|---|---|
| Comparison with Poisson distribution Blue bars denote a histogram of data divided into 1 sec bins. Red curve is a Poisson curve with rate = median count rate of data. |
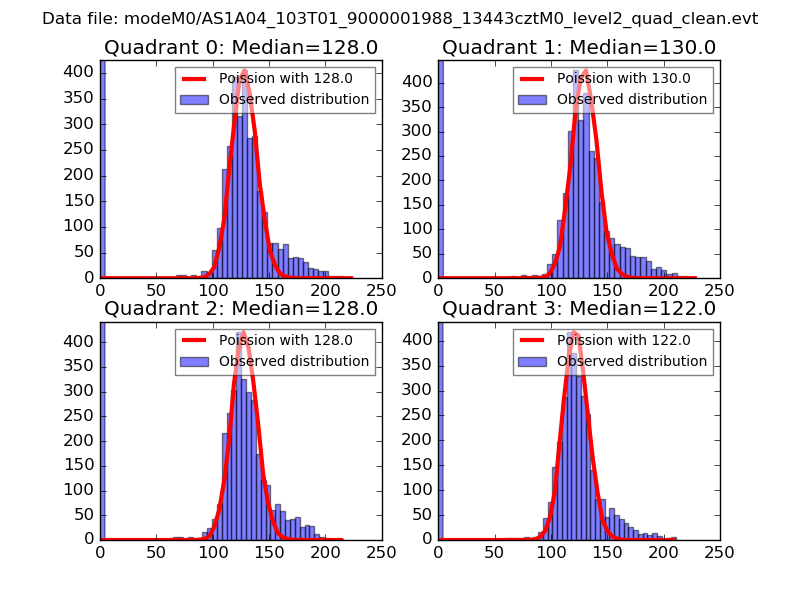 |
 |
| Quadrant-wise count rates Data is divided into 100 sec bins |
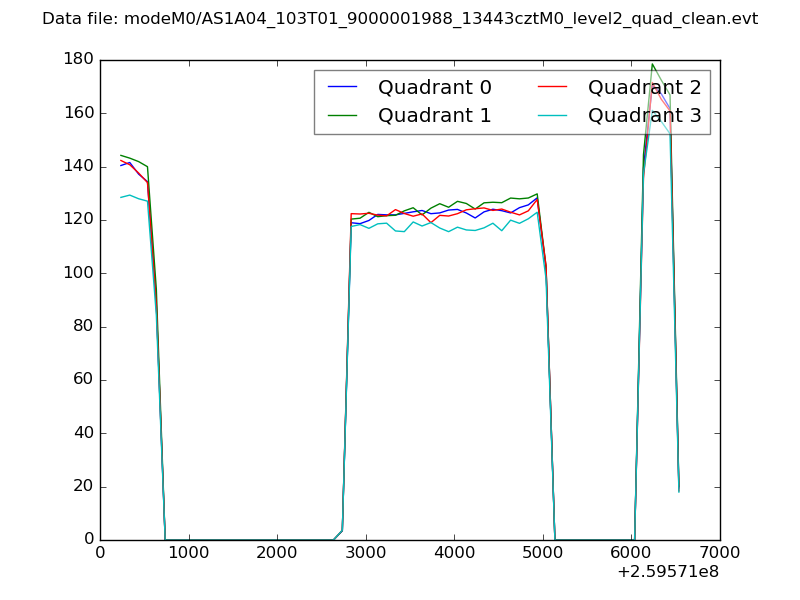 |
|
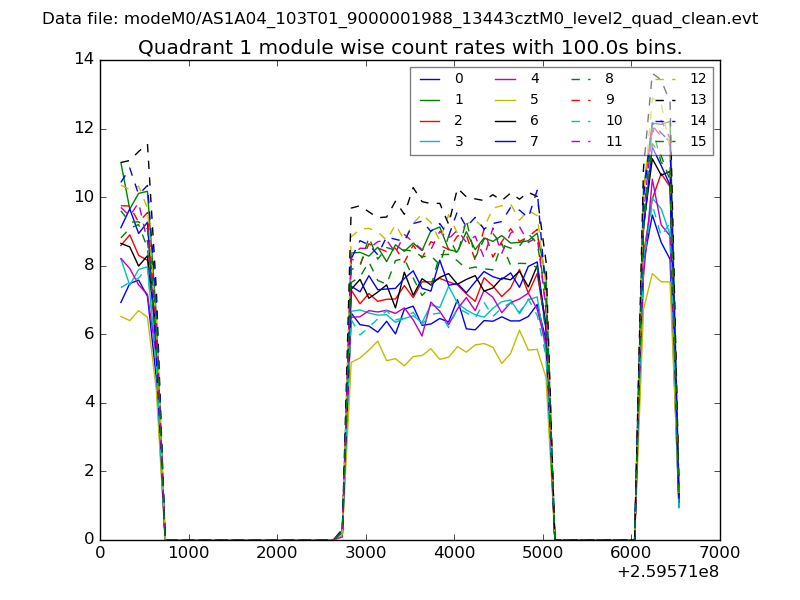
| Module-wise count rates for Quadrant A Data is divided into 100 sec bins |
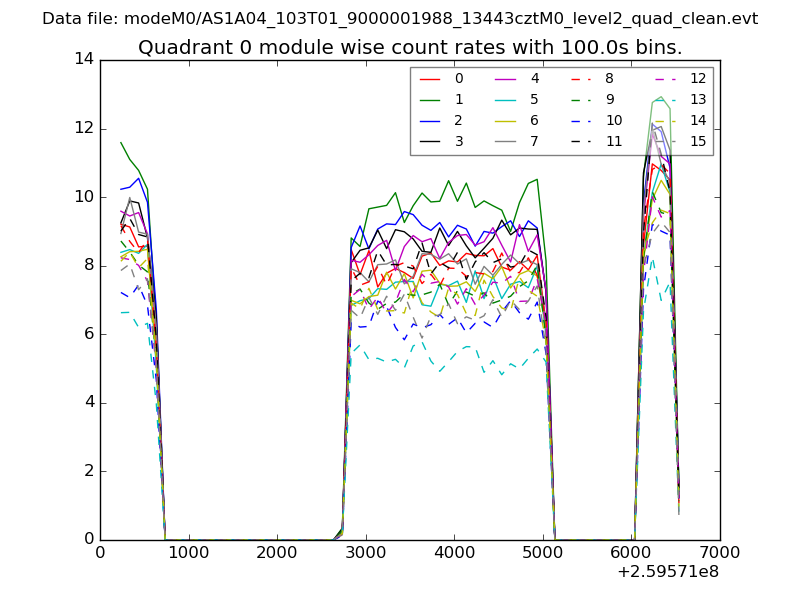 |
 |
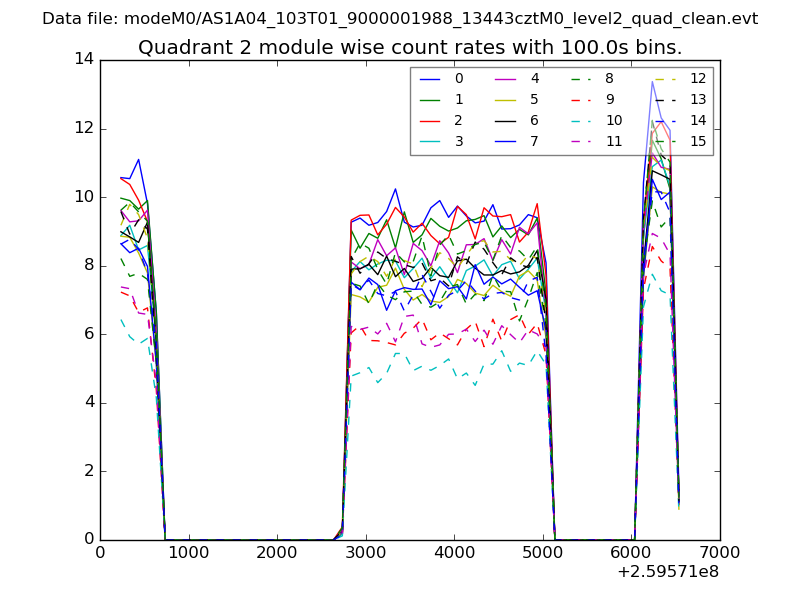
| Module-wise count rates for Quadrant B Data is divided into 100 sec bins |
 |
 |
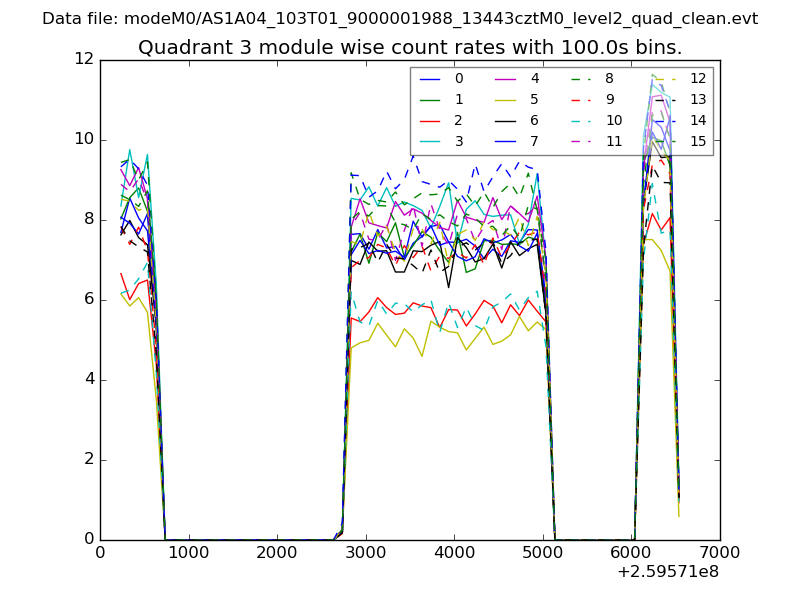
| Module-wise count rates for Quadrant C Data is divided into 100 sec bins |
 |
 |
| Module-wise count rates for Quadrant D Data is divided into 100 sec bins |
 |
 |
| Parameter | Plot |
|---|---|
| CZT HV Monitor | 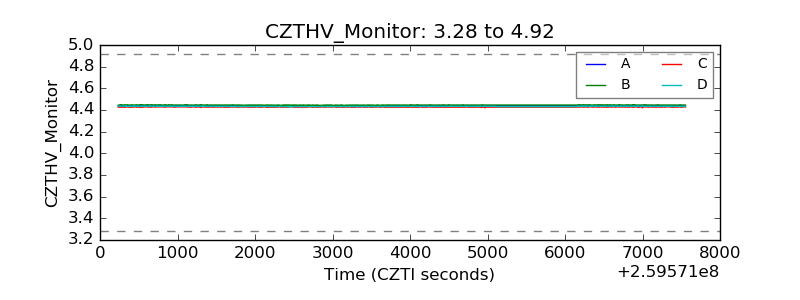 |
| D_VDD |  |
| Temperature 1 | 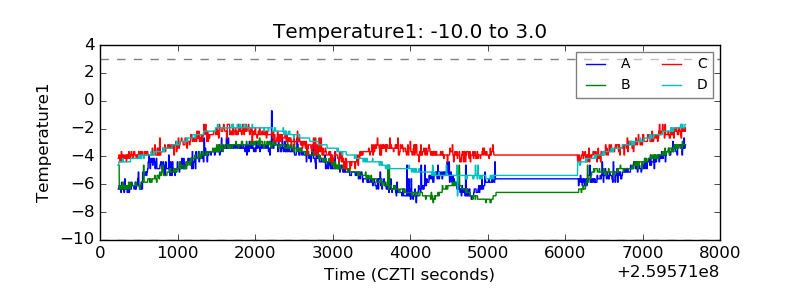 |
| Veto HV Monitor | 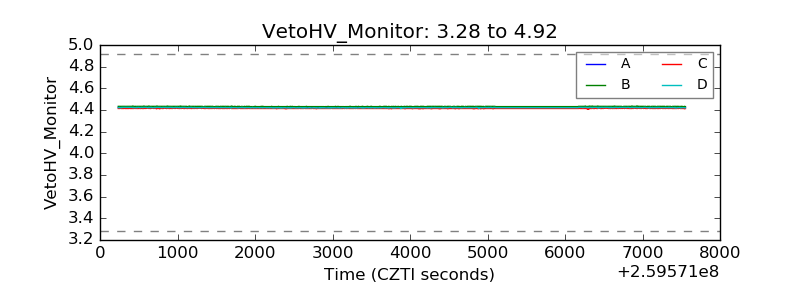 |
| Veto LLD | 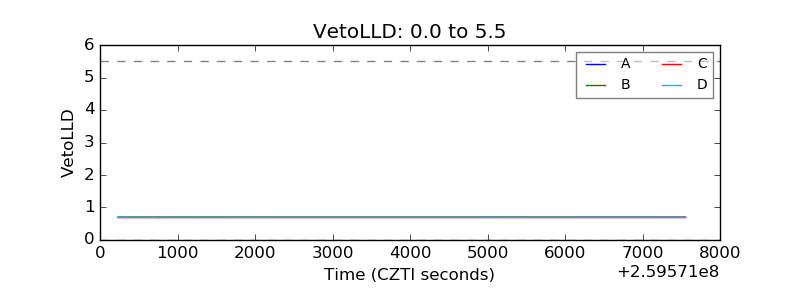 |
| Alpha Counter |  |
| _CPM_Rate | 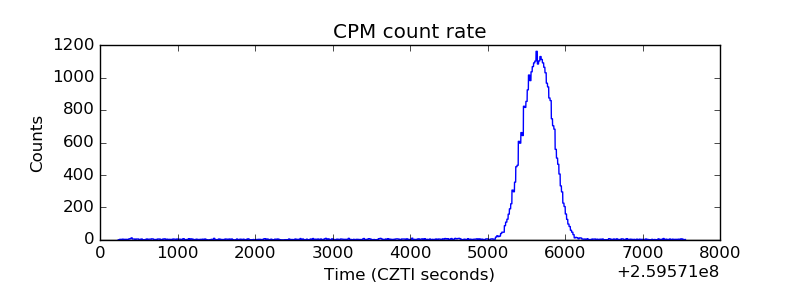 |
| CZT Counter | 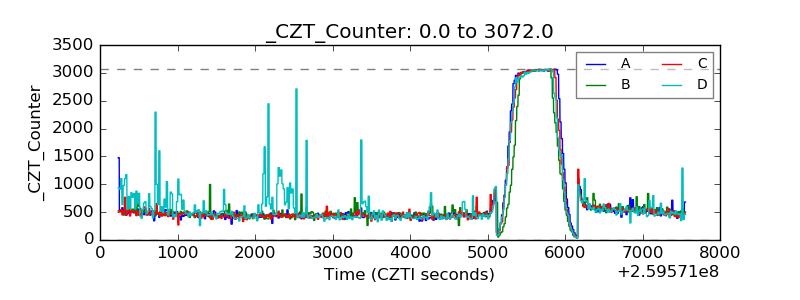 |
| +2.5 Volts monitor |  |
| +5 Volts monitor |  |
| _ROLL_ROT | 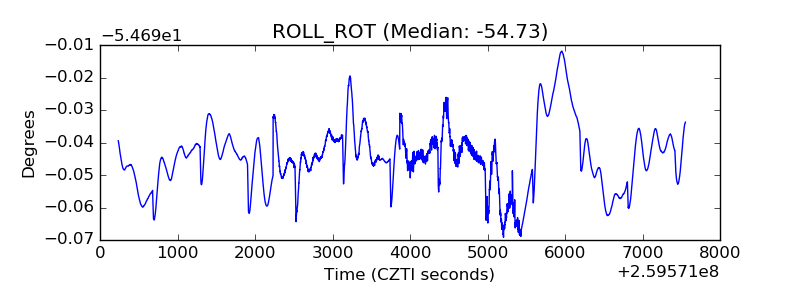 |
| _Roll_DEC | 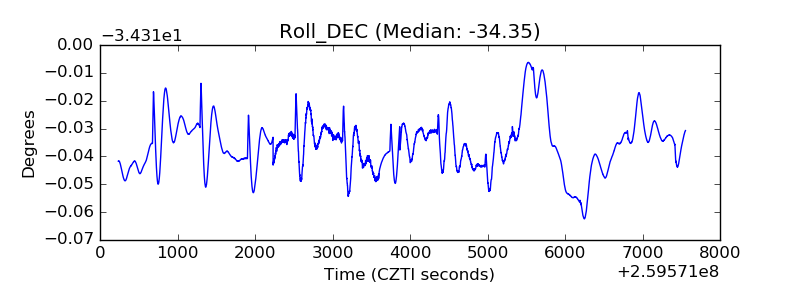 |
| _Roll_RA | 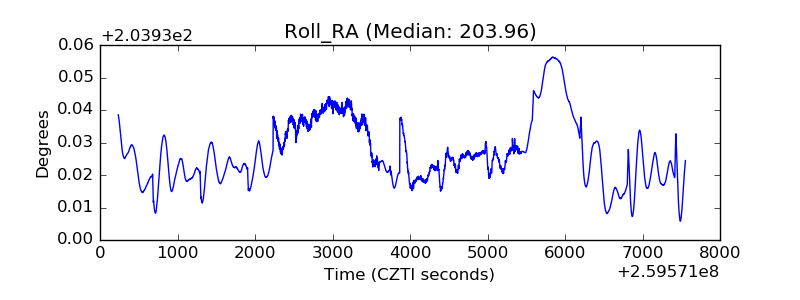 |
| Veto Counter | 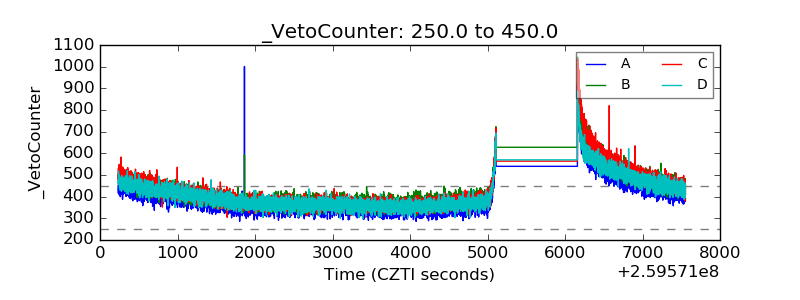 |