| Param | Original file | Final file |
|---|---|---|
| Filename | modeM0/AS1A04_103T01_9000001988_13444cztM0_level2.evt | modeM0/AS1A04_103T01_9000001988_13444cztM0_level2_quad_clean.evt |
| Size (bytes) | 446,561,280 | 66,196,800 |
| Size | 425.9 MB | 63.1 MB |
| Events in quadrant A | 3,118,074 | 395,168 |
| Events in quadrant B | 3,207,853 | 403,342 |
| Events in quadrant C | 3,103,987 | 394,754 |
| Events in quadrant D | 3,668,873 | 374,047 |
| Mode M0 | |||
|---|---|---|---|
| Quadrant | BADHDUFLAG | Total packets | Discarded packets |
| A | 0 | 13366 | 3 |
| B | 0 | 13568 | 2 |
| C | 0 | 13383 | 2 |
| D | 0 | 14966 | 2 |
| Mode SS | |||
|---|---|---|---|
| Quadrant | BADHDUFLAG | Total packets | Discarded packets |
| A | 0 | 126 | 0 |
| B | 0 | 126 | 0 |
| C | 0 | 126 | 0 |
| D | 0 | 126 | 0 |
| Mode M9 | |||
|---|---|---|---|
| Quadrant | BADHDUFLAG | Total packets | Discarded packets |
| A | 0 | 12 | 0 |
| B | 0 | 12 | 0 |
| C | 0 | 12 | 0 |
| D | 0 | 13 | 0 |
| Quadrant | Total seconds | Saturated seconds | Saturation percentage |
|---|---|---|---|
| A | 6266 | 68 | 1.085222% |
| B | 6266 | 70 | 1.117140% |
| C | 6266 | 53 | 0.845835% |
| D | 6266 | 113 | 1.803383% |
Noise dominated data is calculated using 1-second bins in cleaned event files. If a bin has >2000 counts, and if more than 50% of those come from <1% of pixels, then it is considered to be noise-dominated and hence unusable.
| Quadrant | # 1 sec bins | Bins with >0 counts | Bins with >2000 counts | High rate bins dominated by noise | Noise dominated (total time) | Noise dominated (detector-on time) | Marked lightcurve |
|---|---|---|---|---|---|---|---|
| A | 7432 | 6267 | 0 | 0 | 0.00% | 0.00% | 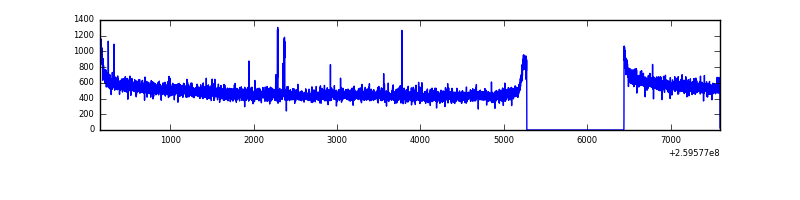 |
| B | 7432 | 6267 | 1 | 1 | 0.01% | 0.02% | 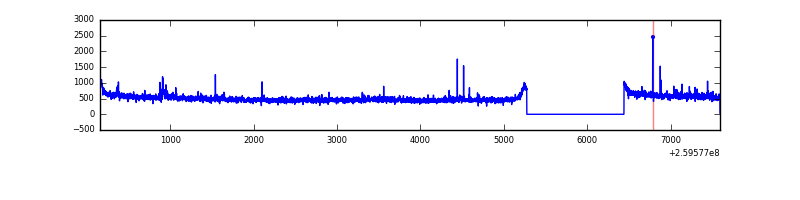 |
| C | 7432 | 6267 | 2 | 2 | 0.03% | 0.03% | 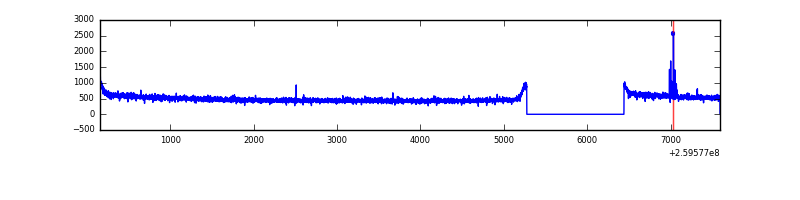 |
| D | 7432 | 6267 | 75 | 75 | 1.01% | 1.20% | 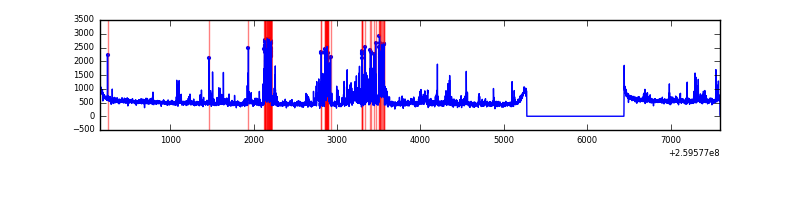 |
Top three noisy pixels from each quadrant. If the there are fewer than three noisy pixels in the level2.evt file, extra rows are filled as -1
| Pixel properties | Quadrant properties | ||||||
|---|---|---|---|---|---|---|---|
| Quadrant | DetID | PixID | Counts | Sigma | Mean | Median | Sigma |
| A | 15 | 69 | 13626 | 79.66 | 803 | 788 | 161.2 |
| A | 1 | 162 | 11109 | 64.04 | 803 | 788 | 161.2 |
| A | 0 | 226 | 7089 | 39.1 | 803 | 788 | 161.2 |
| B | 0 | 214 | 45658 | 295.31 | 801 | 782 | 152.0 |
| B | 12 | 111 | 17559 | 110.4 | 801 | 782 | 152.0 |
| B | 3 | 209 | 15619 | 97.64 | 801 | 782 | 152.0 |
| C | 3 | 233 | 34022 | 185.0 | 782 | 784 | 179.7 |
| C | 14 | 220 | 21764 | 116.77 | 782 | 784 | 179.7 |
| C | 13 | 61 | 5539 | 26.47 | 782 | 784 | 179.7 |
| D | 13 | 249 | 638295 | 3474.78 | 773 | 753 | 183.5 |
| D | 8 | 195 | 86732 | 468.61 | 773 | 753 | 183.5 |
| D | 2 | 234 | 22530 | 118.69 | 773 | 753 | 183.5 |
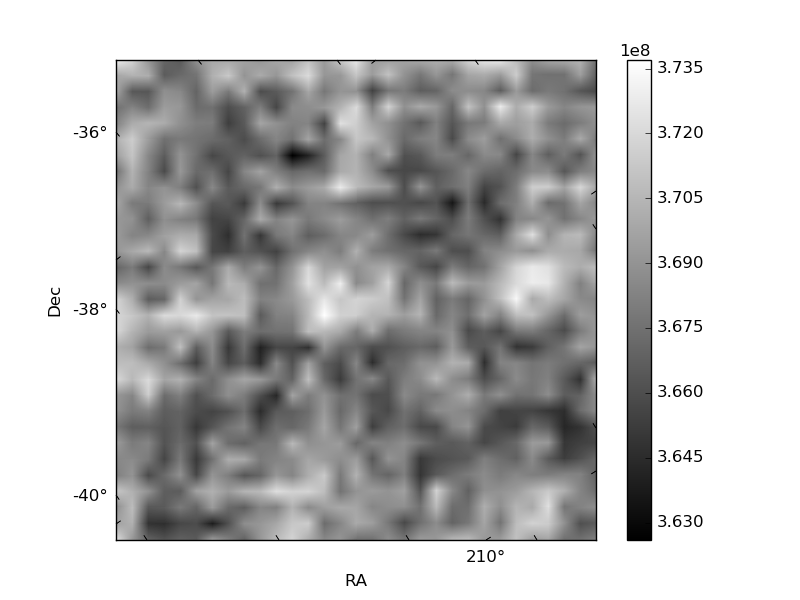
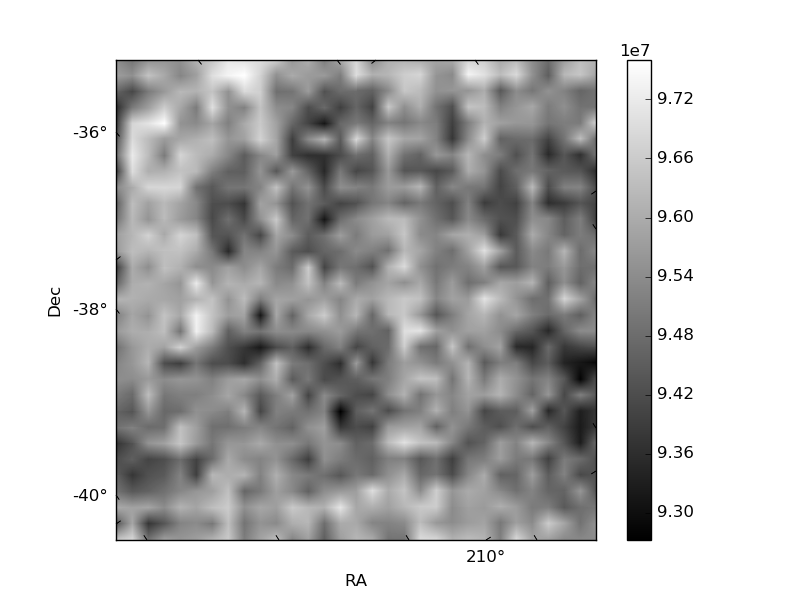
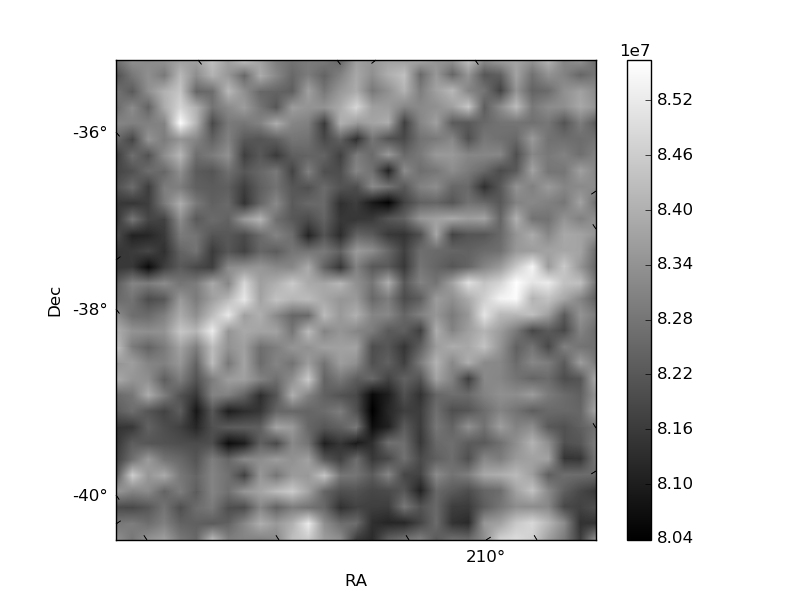
Histogram calculated using DETX and DETY for each event in the final _common_clean file
| Quadrant A | 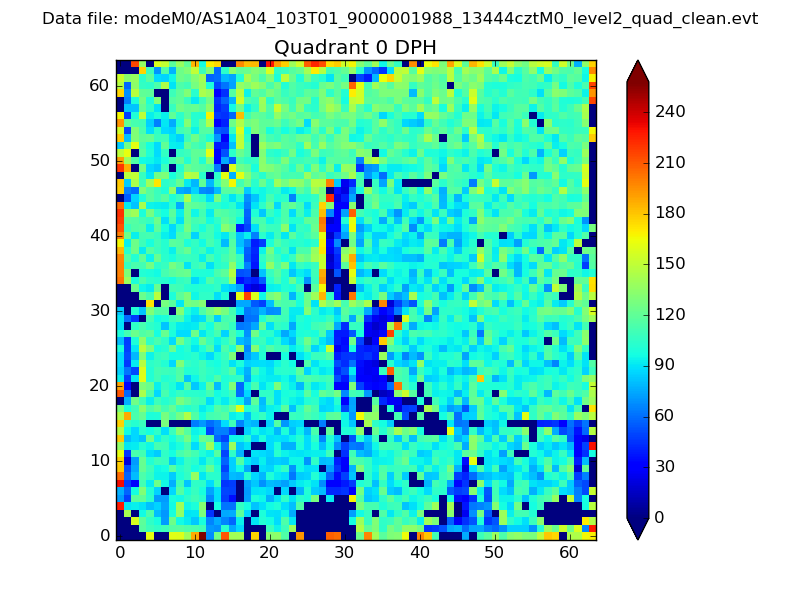 |
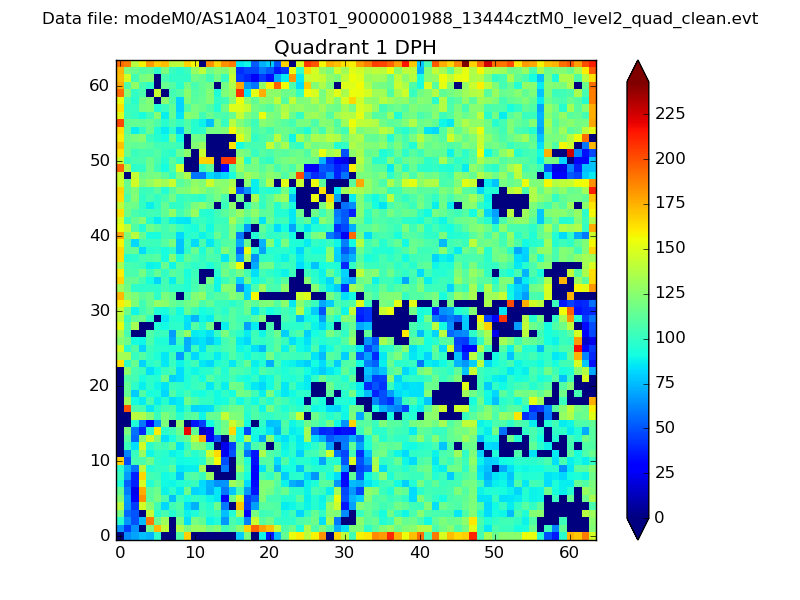 |
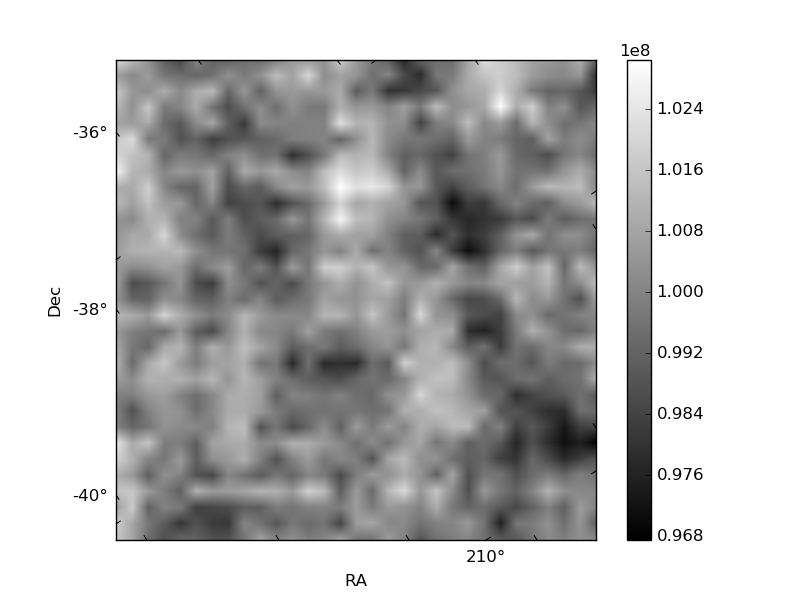
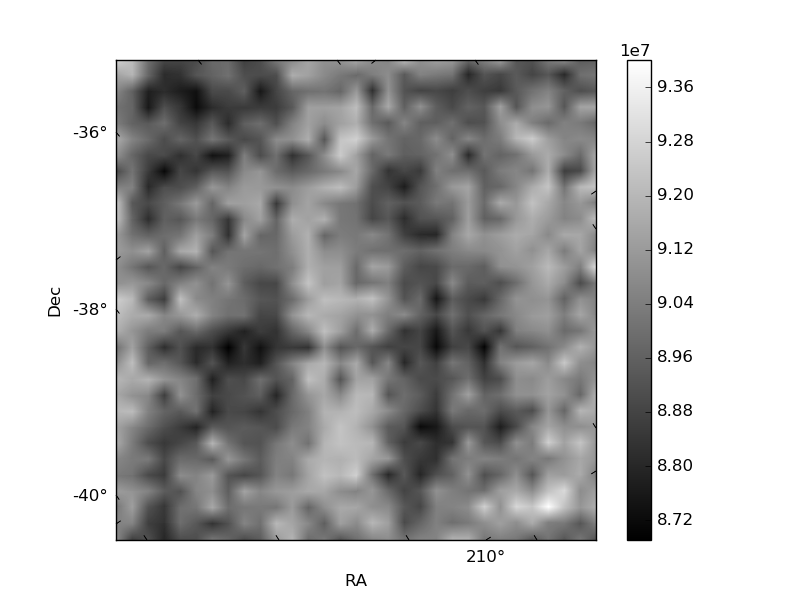
Quadrant B |
|---|---|---|---|
| Quadrant D | 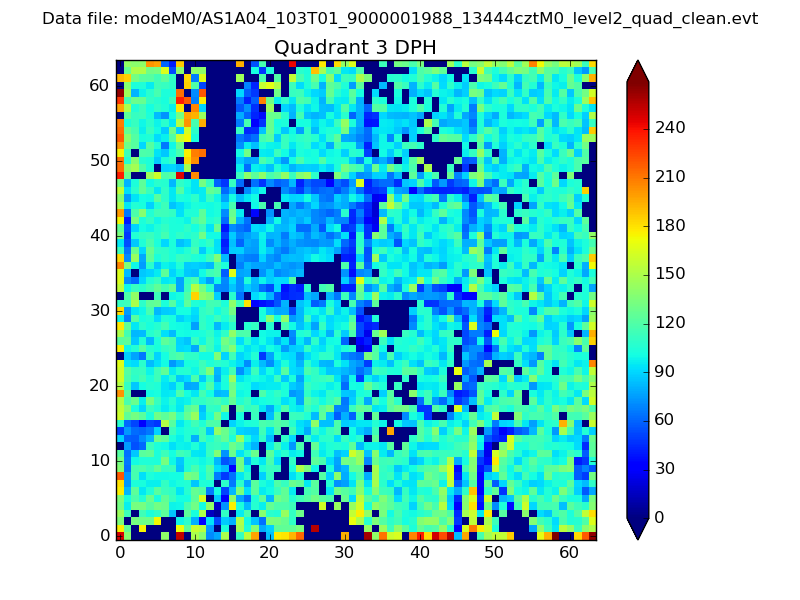 |
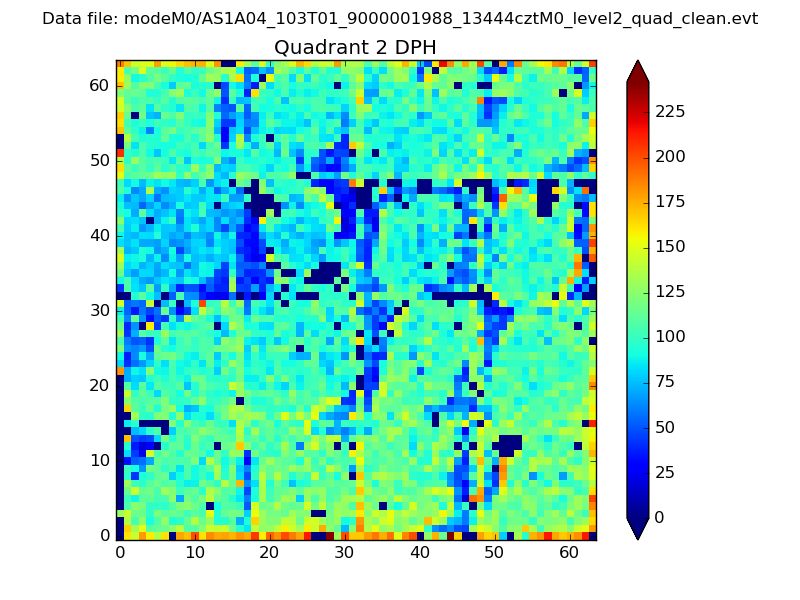 |
Quadrant C |
| Plot type | Count rate plots | Images |
|---|---|---|
| Comparison with Poisson distribution Blue bars denote a histogram of data divided into 1 sec bins. Red curve is a Poisson curve with rate = median count rate of data. |
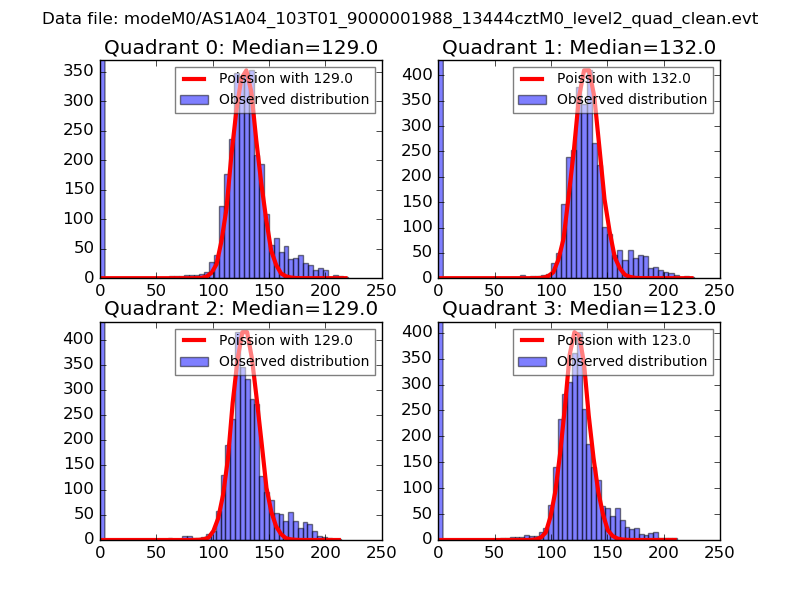 |
 |
| Quadrant-wise count rates Data is divided into 100 sec bins |
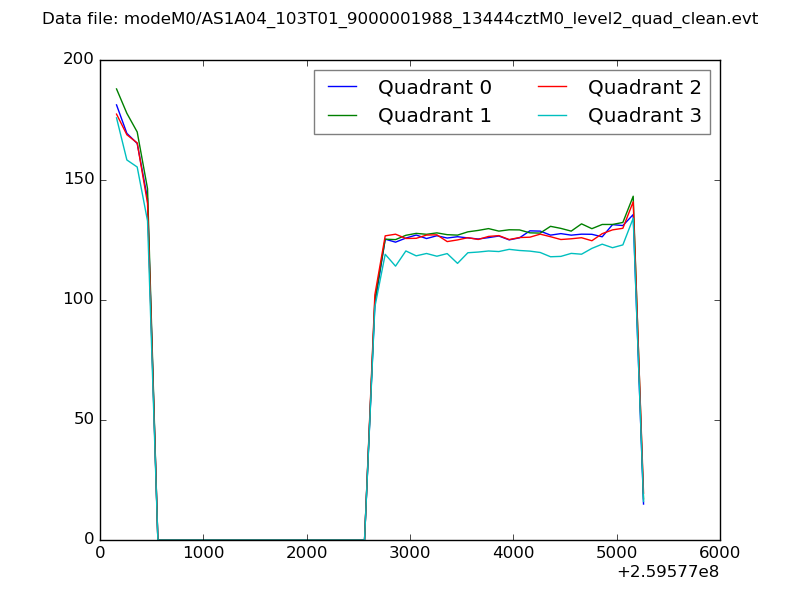 |
|
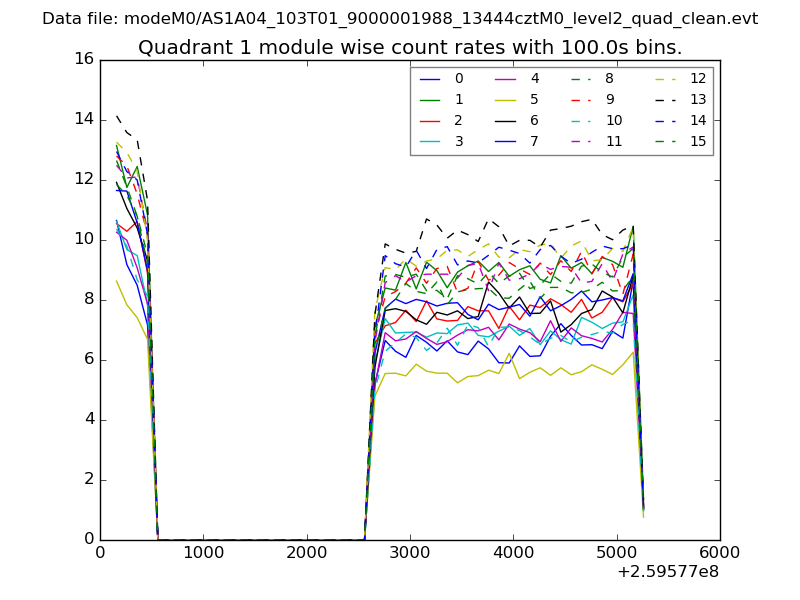
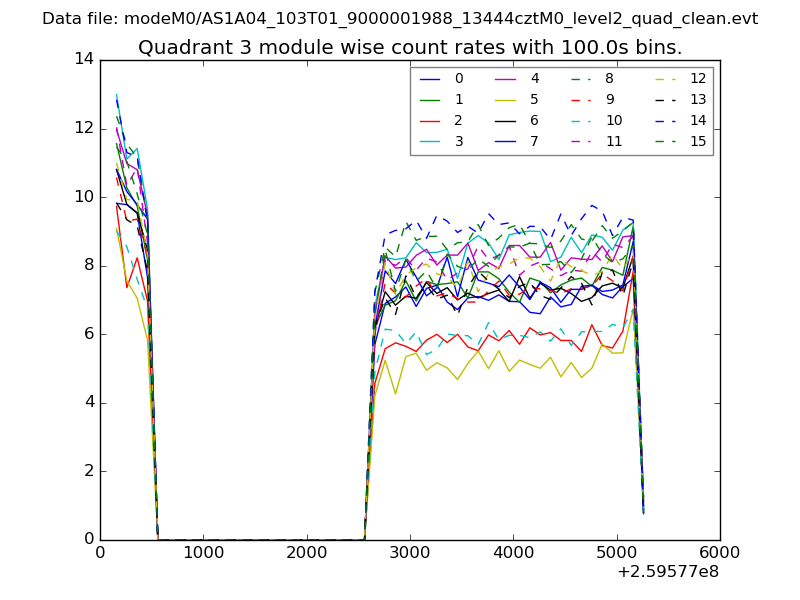
| Module-wise count rates for Quadrant A Data is divided into 100 sec bins |
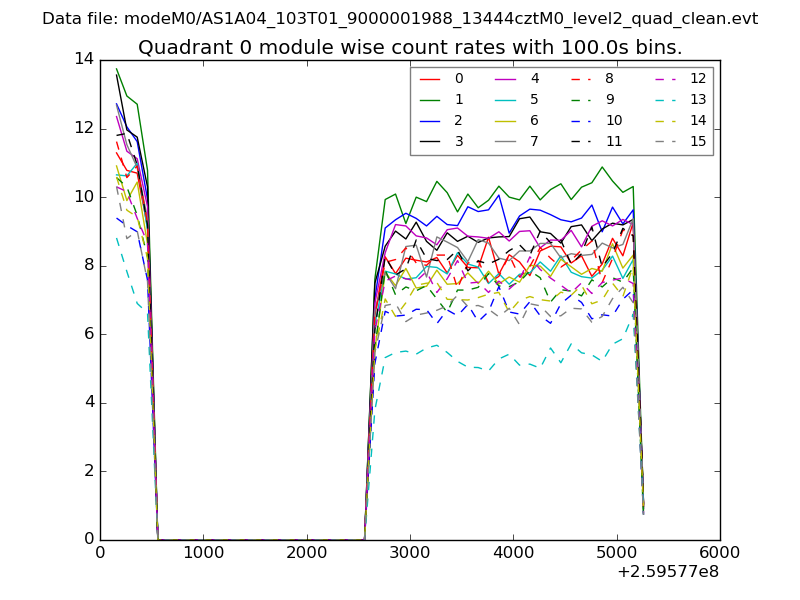 |
 |
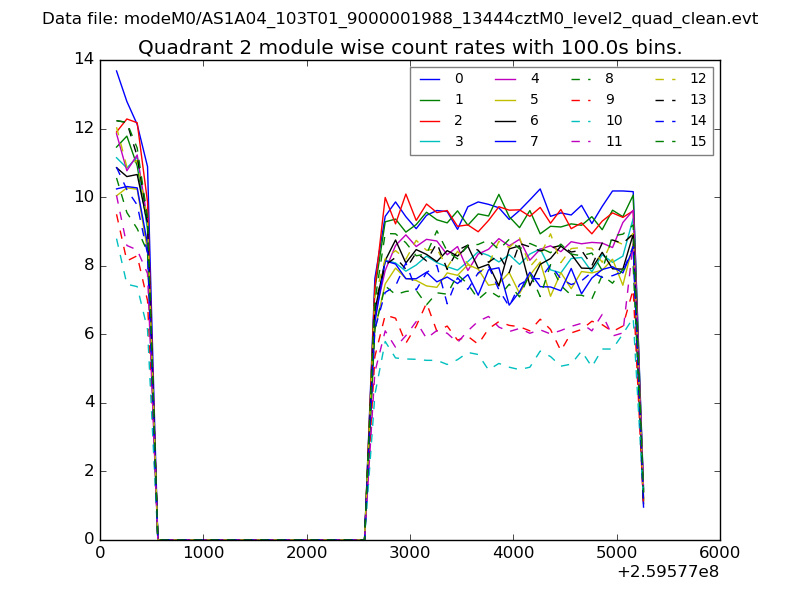
| Module-wise count rates for Quadrant B Data is divided into 100 sec bins |
 |
 |
| Module-wise count rates for Quadrant C Data is divided into 100 sec bins |
 |
 |
| Module-wise count rates for Quadrant D Data is divided into 100 sec bins |
 |
 |
| Parameter | Plot |
|---|---|
| CZT HV Monitor | 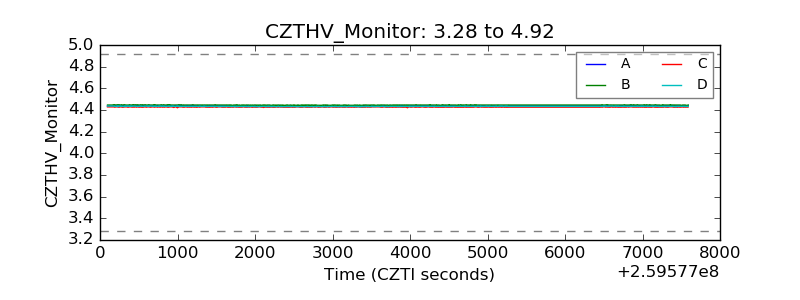 |
| D_VDD | 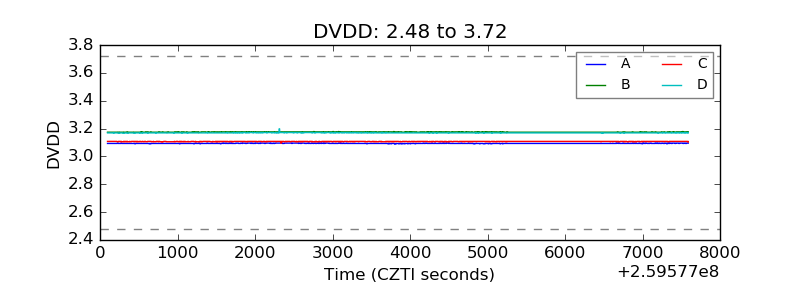 |
| Temperature 1 | 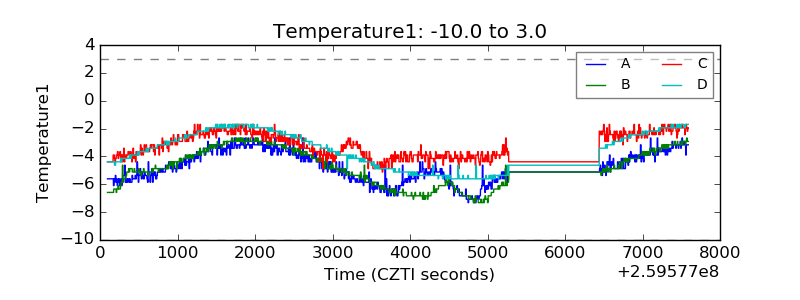 |
| Veto HV Monitor | 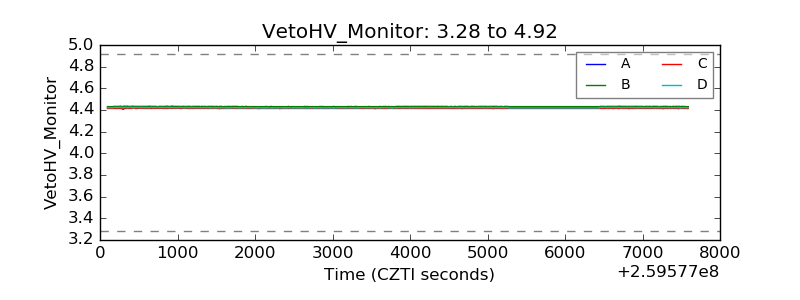 |
| Veto LLD | 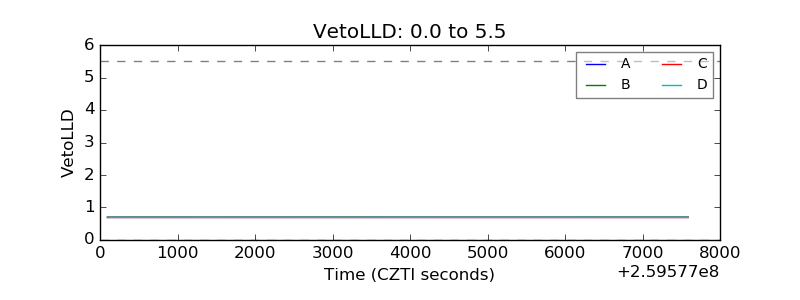 |
| Alpha Counter | 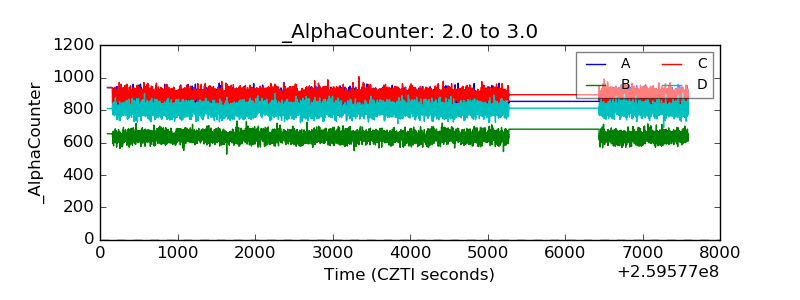 |
| _CPM_Rate | 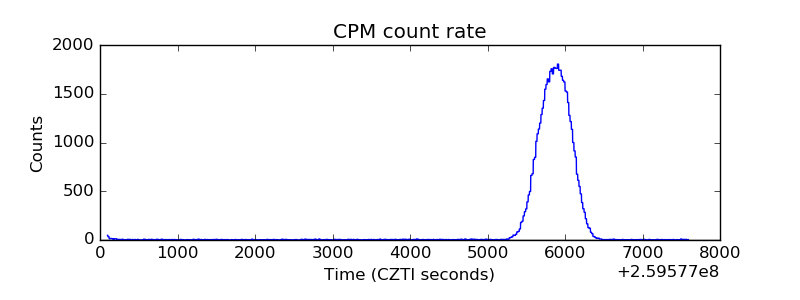 |
| CZT Counter | 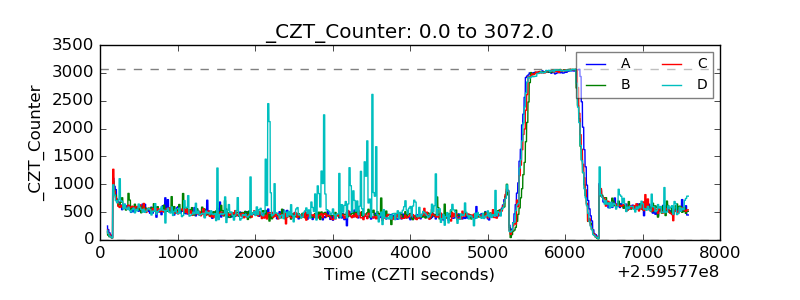 |
| +2.5 Volts monitor |  |
| +5 Volts monitor | 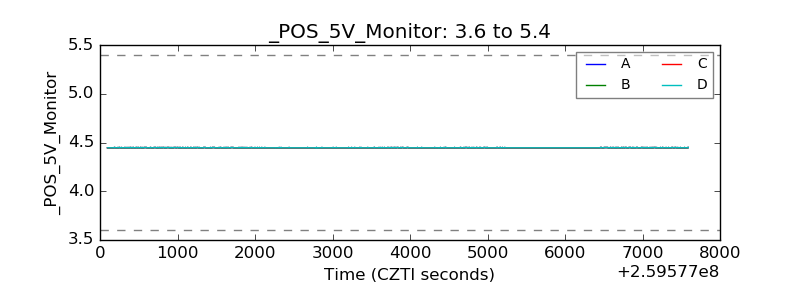 |
| _ROLL_ROT | 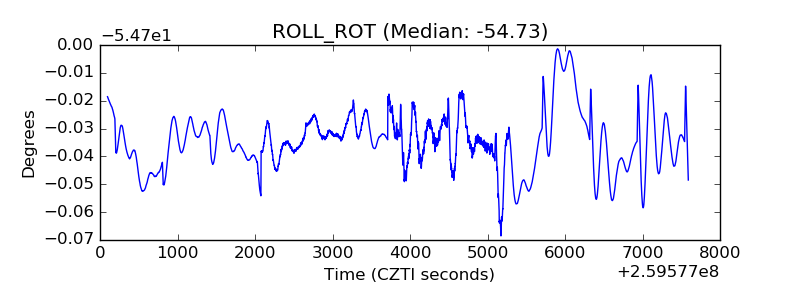 |
| _Roll_DEC | 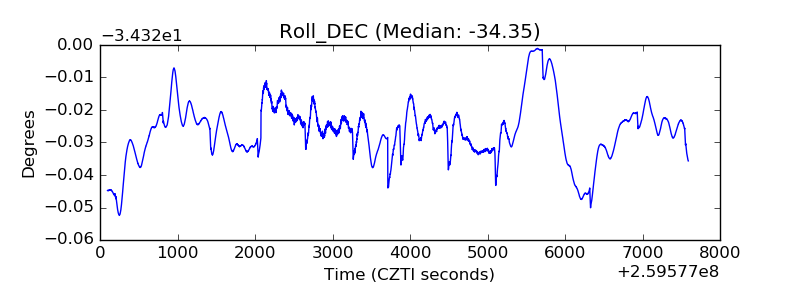 |
| _Roll_RA | 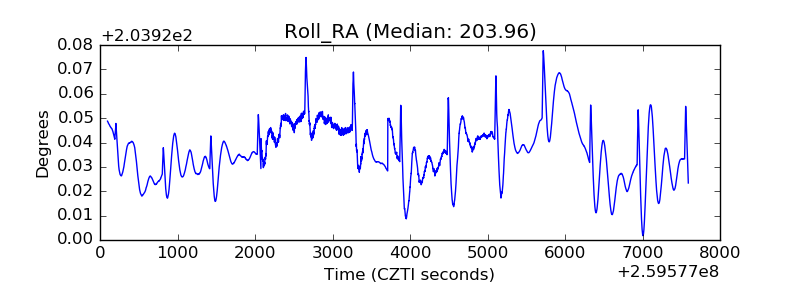 |
| Veto Counter | 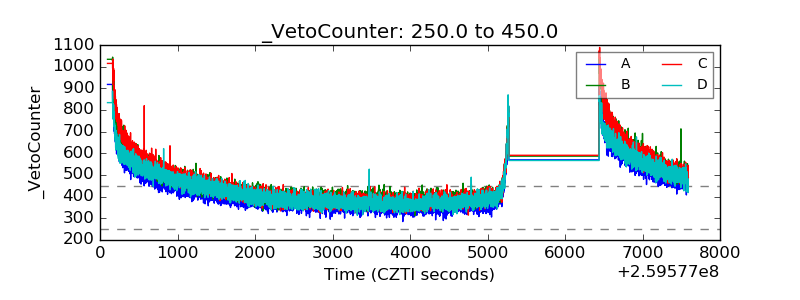 |