| Param | Original file | Final file |
|---|---|---|
| Filename | modeM0/AS1A04_103T01_9000001988_13446cztM0_level2.evt | modeM0/AS1A04_103T01_9000001988_13446cztM0_level2_quad_clean.evt |
| Size (bytes) | 465,891,840 | 79,695,360 |
| Size | 444.3 MB | 76.0 MB |
| Events in quadrant A | 3,376,847 | 496,245 |
| Events in quadrant B | 3,471,896 | 504,736 |
| Events in quadrant C | 3,316,921 | 489,568 |
| Events in quadrant D | 3,500,757 | 467,670 |
| Mode M0 | |||
|---|---|---|---|
| Quadrant | BADHDUFLAG | Total packets | Discarded packets |
| A | 0 | 14162 | 3 |
| B | 0 | 14444 | 2 |
| C | 0 | 13980 | 2 |
| D | 0 | 14714 | 2 |
| Mode SS | |||
|---|---|---|---|
| Quadrant | BADHDUFLAG | Total packets | Discarded packets |
| A | 0 | 132 | 0 |
| B | 0 | 132 | 0 |
| C | 0 | 132 | 0 |
| D | 0 | 132 | 0 |
| Mode M9 | |||
|---|---|---|---|
| Quadrant | BADHDUFLAG | Total packets | Discarded packets |
| A | 0 | 21 | 0 |
| B | 0 | 21 | 0 |
| C | 0 | 21 | 0 |
| D | 0 | 22 | 0 |
| Quadrant | Total seconds | Saturated seconds | Saturation percentage |
|---|---|---|---|
| A | 6525 | 88 | 1.348659% |
| B | 6525 | 102 | 1.563218% |
| C | 6525 | 62 | 0.950192% |
| D | 6525 | 90 | 1.379310% |
Noise dominated data is calculated using 1-second bins in cleaned event files. If a bin has >2000 counts, and if more than 50% of those come from <1% of pixels, then it is considered to be noise-dominated and hence unusable.
| Quadrant | # 1 sec bins | Bins with >0 counts | Bins with >2000 counts | High rate bins dominated by noise | Noise dominated (total time) | Noise dominated (detector-on time) | Marked lightcurve |
|---|---|---|---|---|---|---|---|
| A | 7816 | 6526 | 0 | 0 | 0.00% | 0.00% |  |
| B | 7816 | 6526 | 3 | 3 | 0.04% | 0.05% | 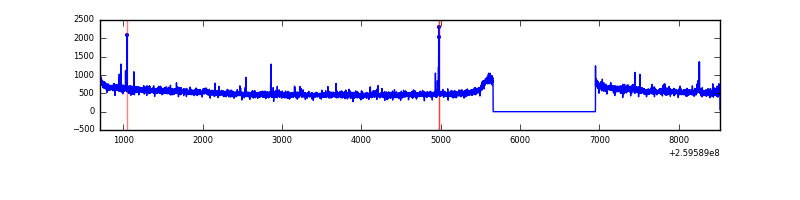 |
| C | 7816 | 6526 | 0 | 0 | 0.00% | 0.00% | 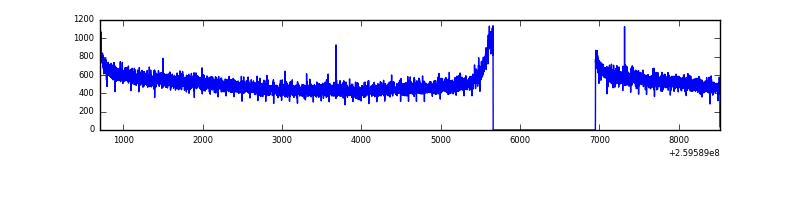 |
| D | 7816 | 6526 | 17 | 17 | 0.22% | 0.26% | 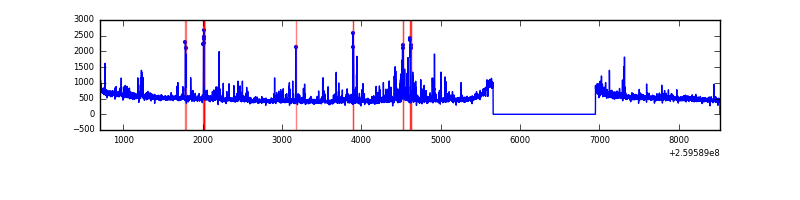 |
Top three noisy pixels from each quadrant. If the there are fewer than three noisy pixels in the level2.evt file, extra rows are filled as -1
| Pixel properties | Quadrant properties | ||||||
|---|---|---|---|---|---|---|---|
| Quadrant | DetID | PixID | Counts | Sigma | Mean | Median | Sigma |
| A | 0 | 226 | 7981 | 40.87 | 876 | 859 | 174.3 |
| A | 1 | 162 | 7882 | 40.3 | 876 | 859 | 174.3 |
| A | 12 | 194 | 6590 | 32.89 | 876 | 859 | 174.3 |
| B | 4 | 173 | 22875 | 135.56 | 873 | 854 | 162.4 |
| B | 3 | 209 | 19511 | 114.85 | 873 | 854 | 162.4 |
| B | 12 | 111 | 18229 | 106.96 | 873 | 854 | 162.4 |
| C | 3 | 233 | 37916 | 194.47 | 840 | 848 | 190.6 |
| C | 13 | 61 | 6129 | 27.71 | 840 | 848 | 190.6 |
| C | 14 | 220 | 2102 | 6.58 | 840 | 848 | 190.6 |
| D | 13 | 249 | 323721 | 1654.43 | 834 | 813 | 195.2 |
| D | 2 | 234 | 21678 | 106.9 | 834 | 813 | 195.2 |
| D | 2 | 136 | 13619 | 65.61 | 834 | 813 | 195.2 |
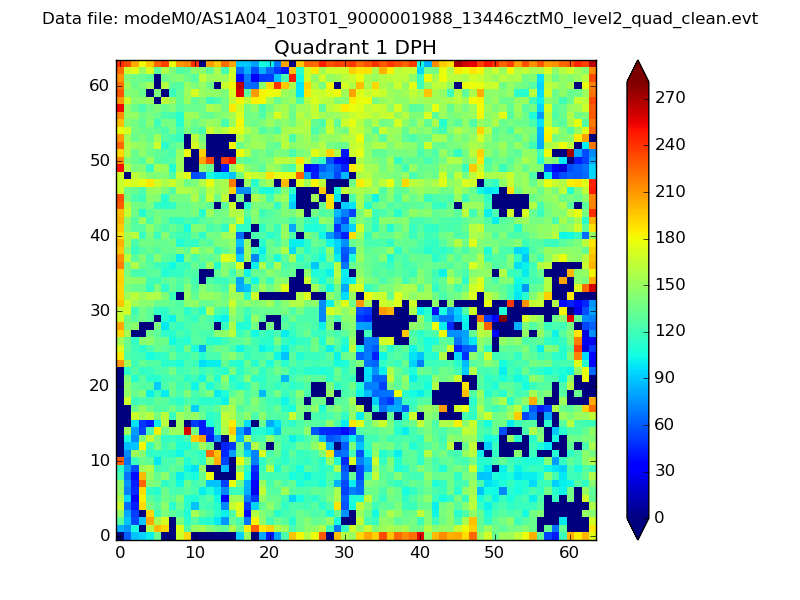
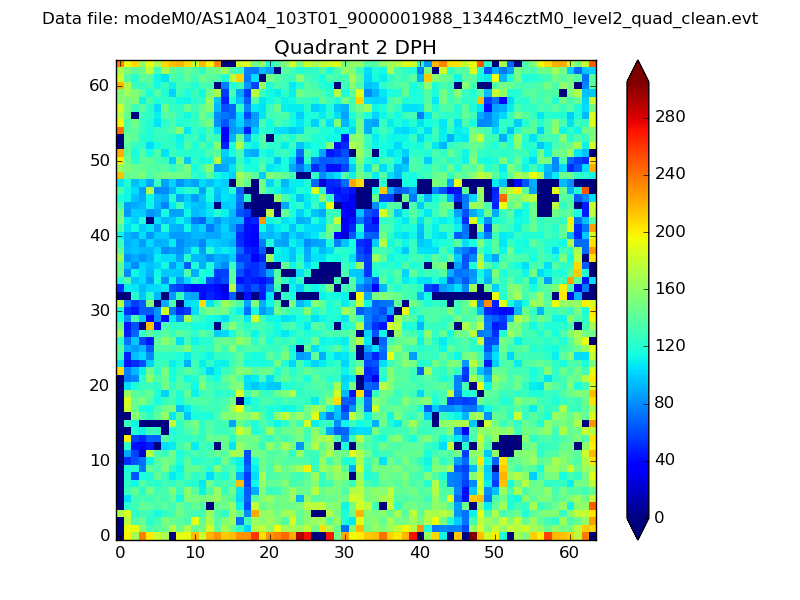
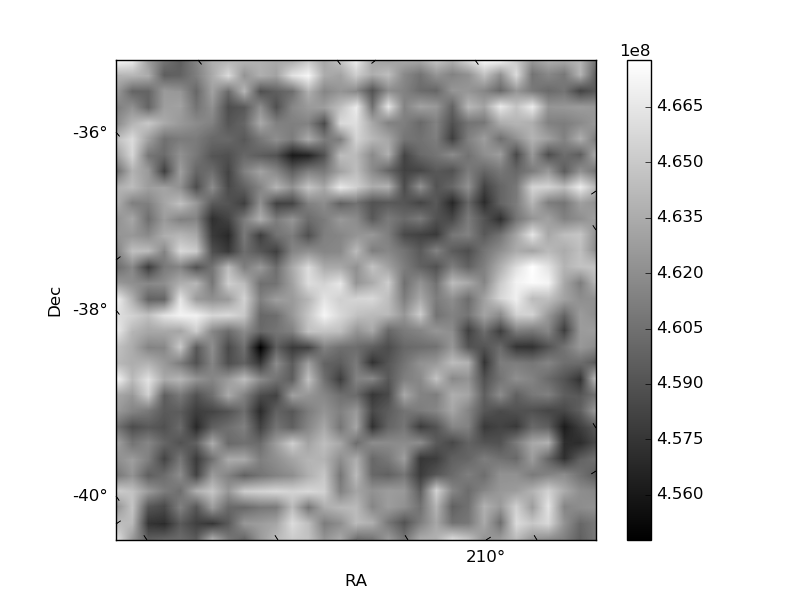
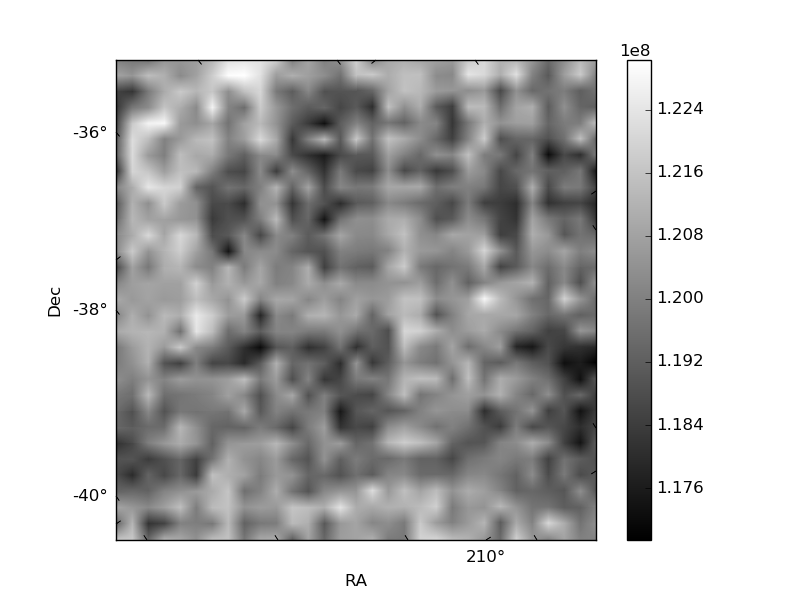
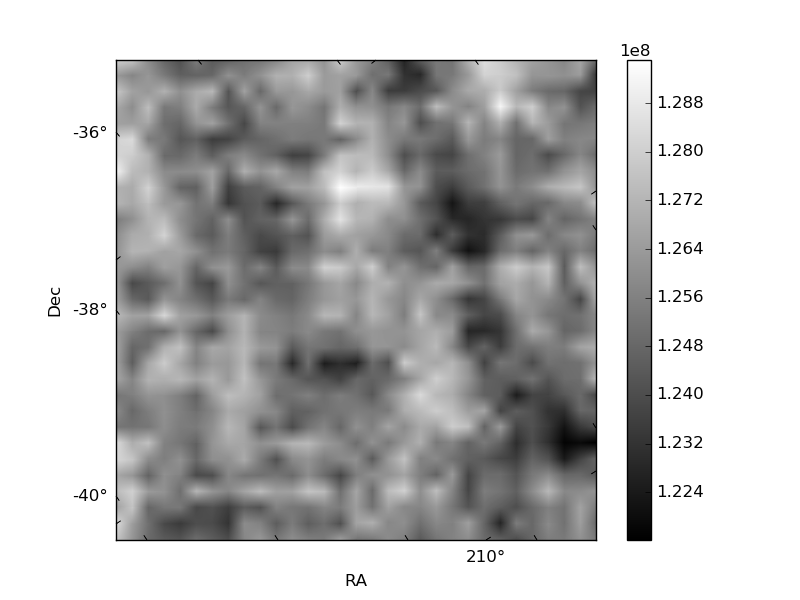
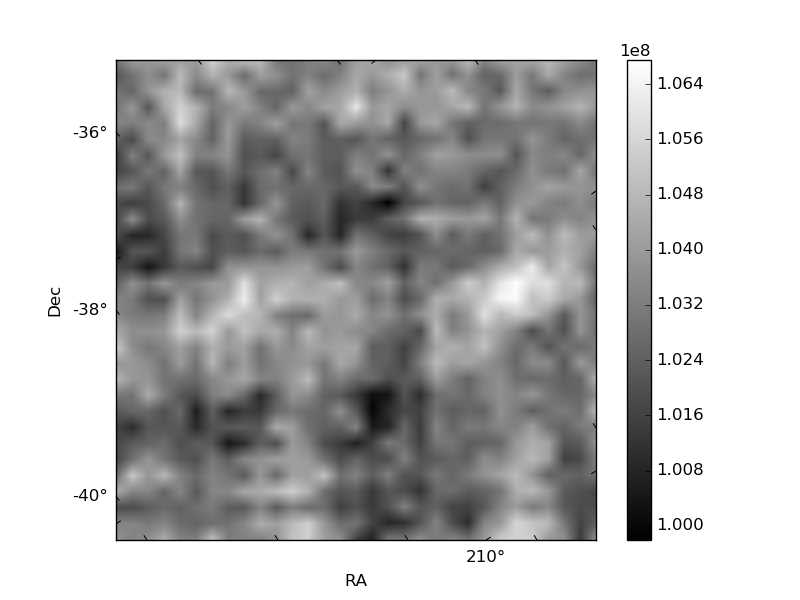
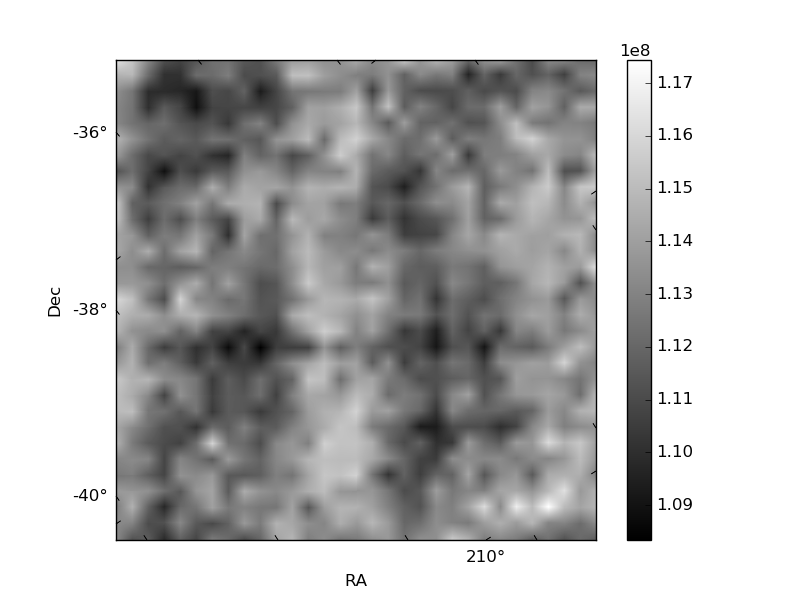
Histogram calculated using DETX and DETY for each event in the final _common_clean file
| Quadrant A | 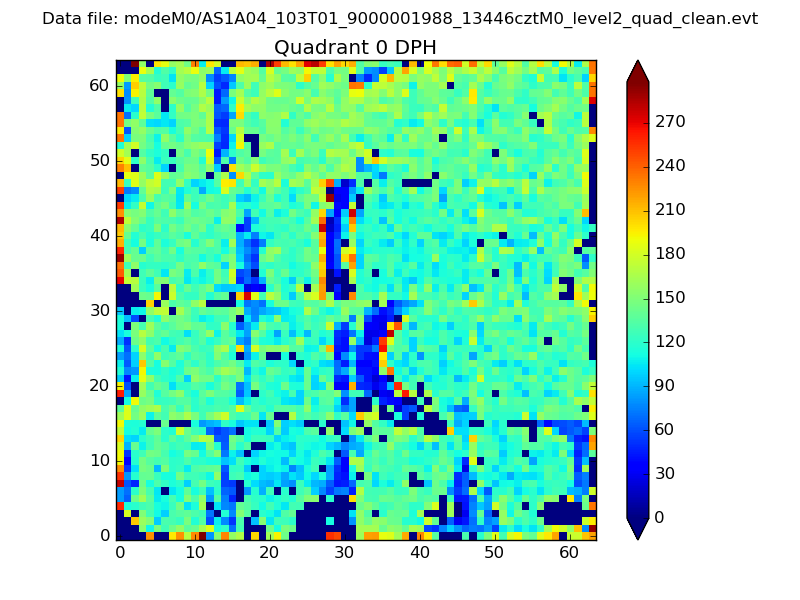 |
 |
Quadrant B |
|---|---|---|---|
| Quadrant D | 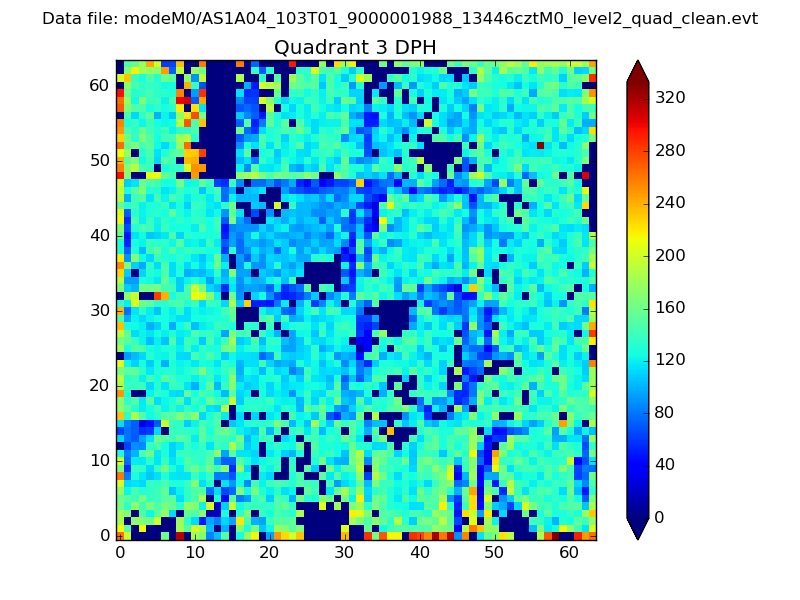 |
 |
Quadrant C |
| Plot type | Count rate plots | Images |
|---|---|---|
| Comparison with Poisson distribution Blue bars denote a histogram of data divided into 1 sec bins. Red curve is a Poisson curve with rate = median count rate of data. |
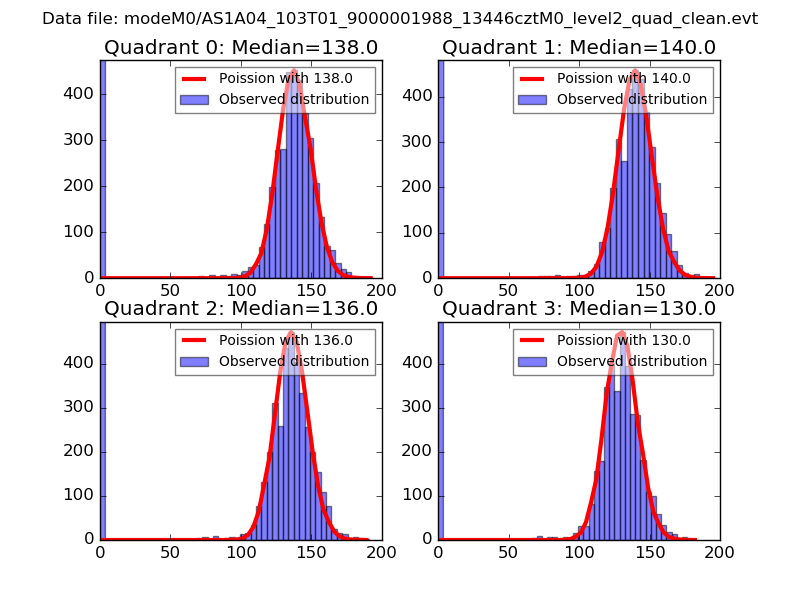 |
 |
| Quadrant-wise count rates Data is divided into 100 sec bins |
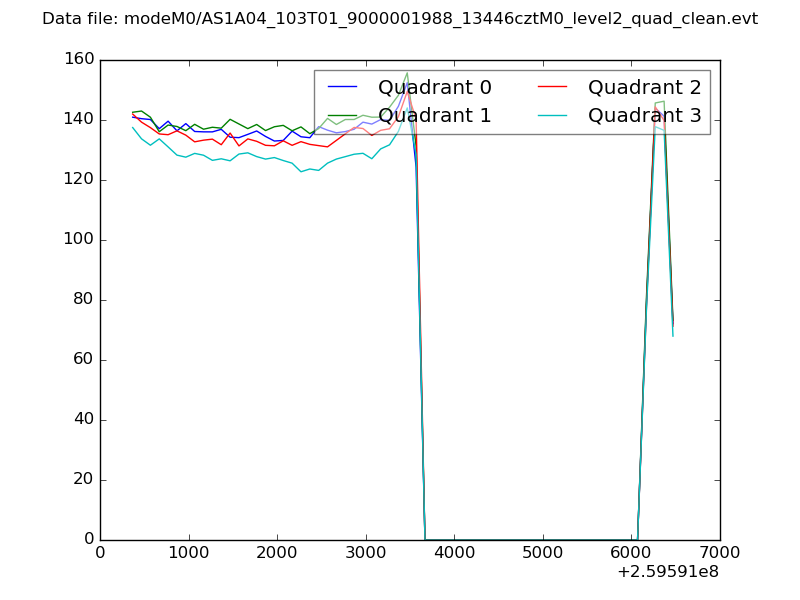 |
|
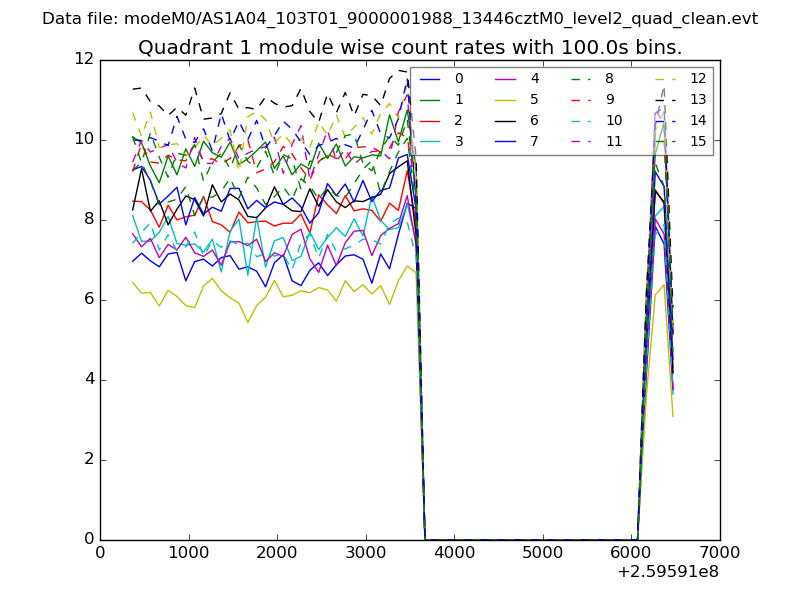
| Module-wise count rates for Quadrant A Data is divided into 100 sec bins |
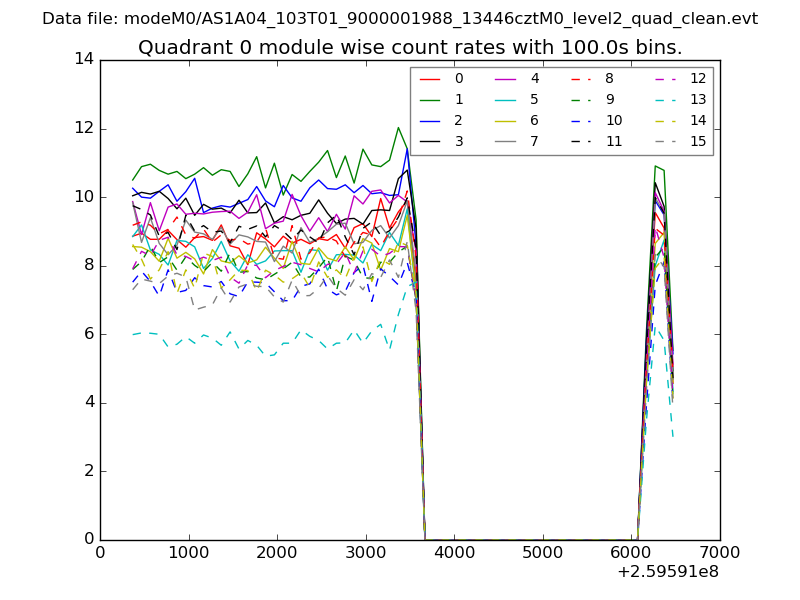 |
 |
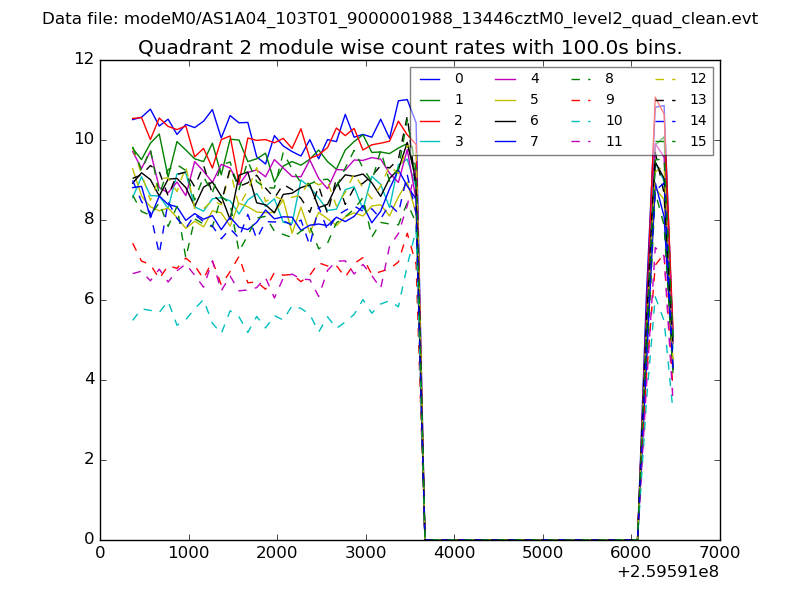
| Module-wise count rates for Quadrant B Data is divided into 100 sec bins |
 |
 |
| Module-wise count rates for Quadrant C Data is divided into 100 sec bins |
 |
 |
| Module-wise count rates for Quadrant D Data is divided into 100 sec bins |
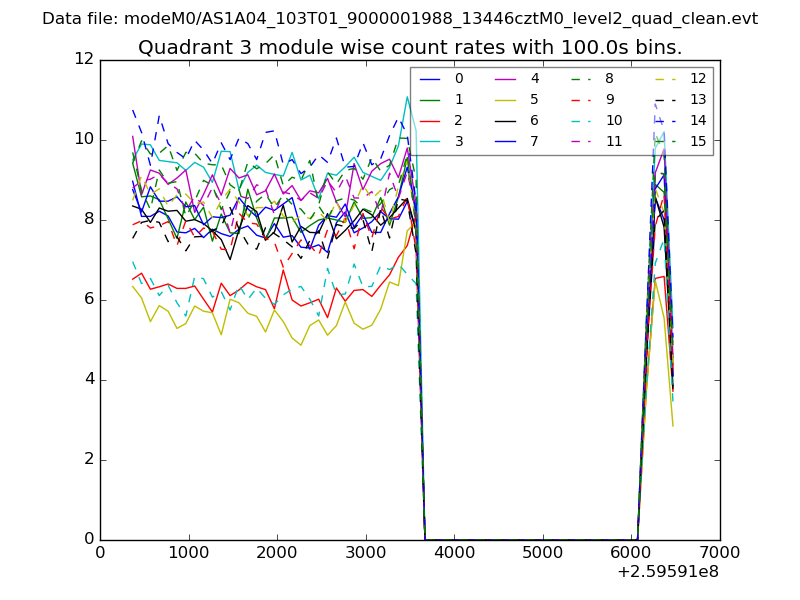 |
 |
| Parameter | Plot |
|---|---|
| CZT HV Monitor | 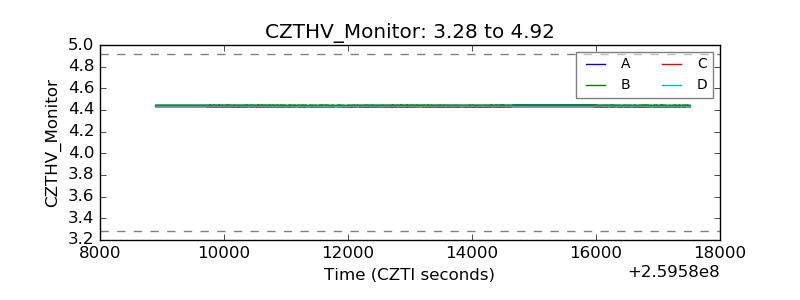 |
| D_VDD | 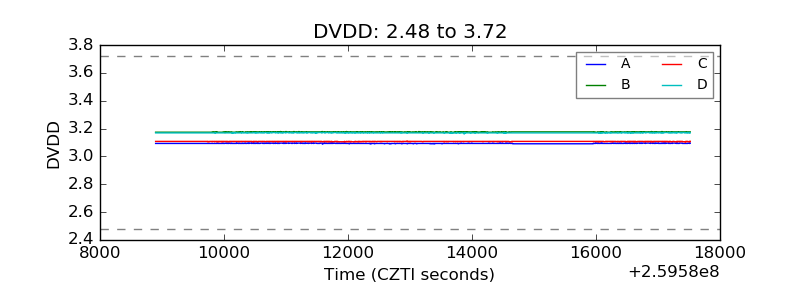 |
| Temperature 1 | 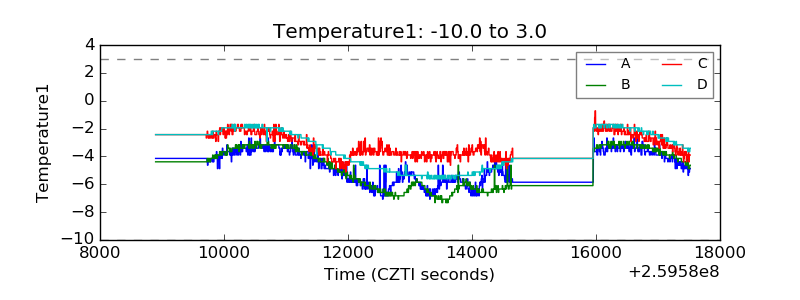 |
| Veto HV Monitor | 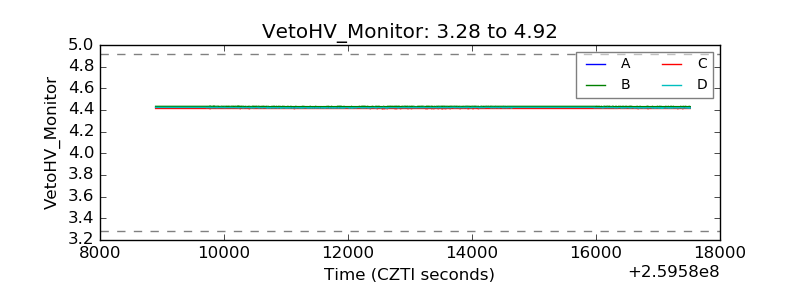 |
| Veto LLD | 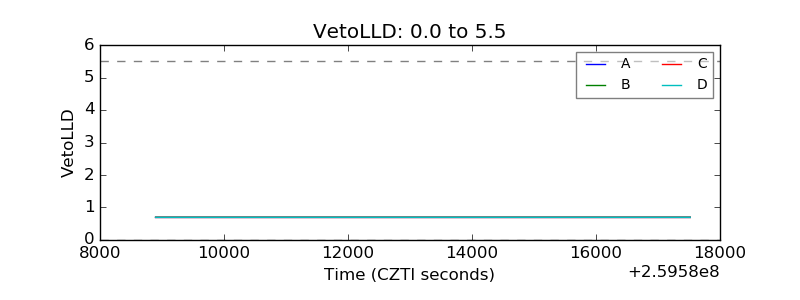 |
| Alpha Counter | 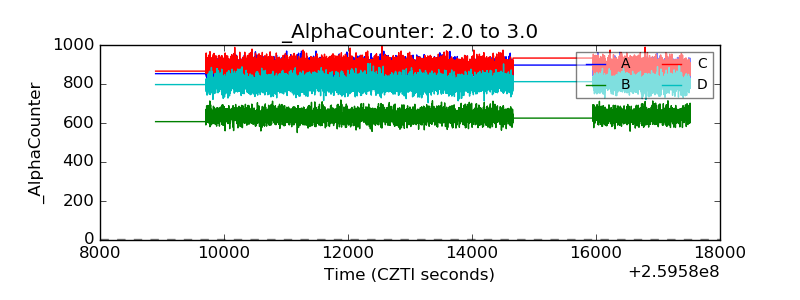 |
| _CPM_Rate | 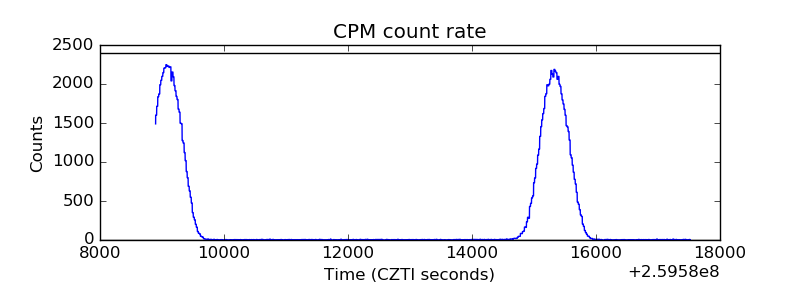 |
| CZT Counter | 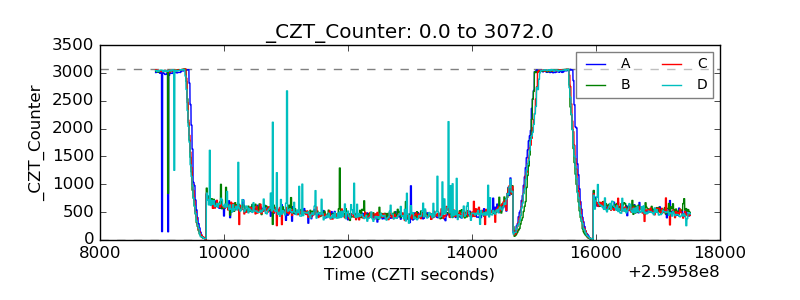 |
| +2.5 Volts monitor | 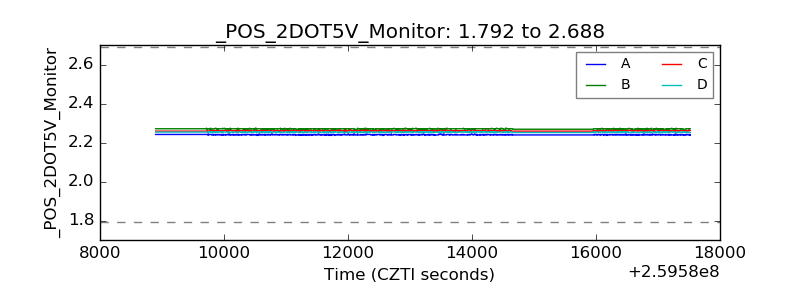 |
| +5 Volts monitor | 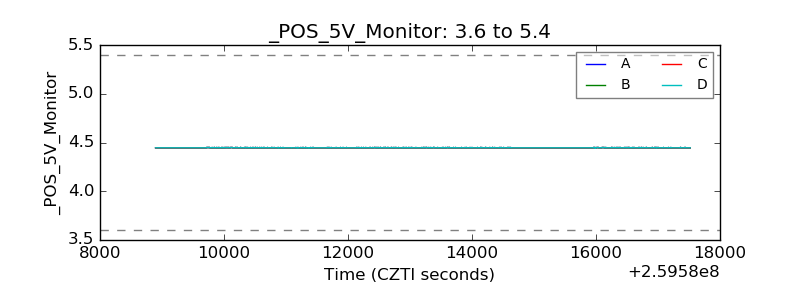 |
| _ROLL_ROT | 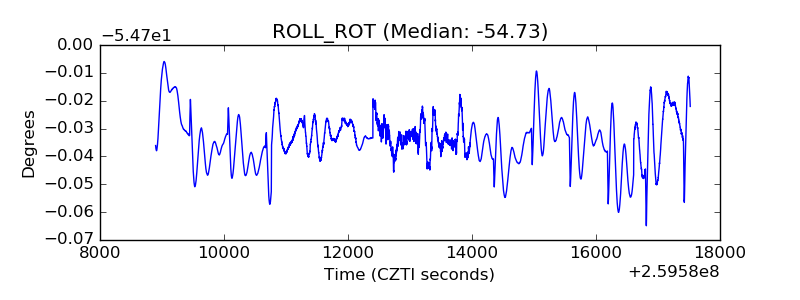 |
| _Roll_DEC | 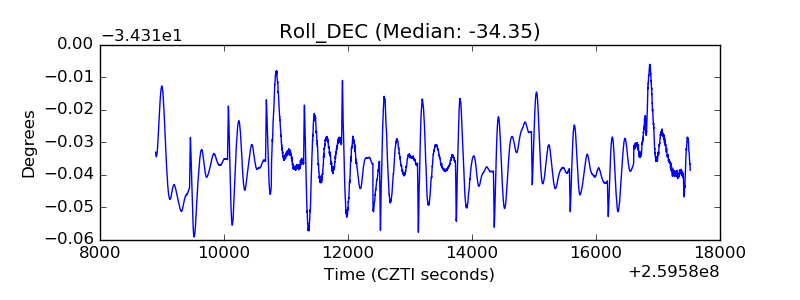 |
| _Roll_RA | 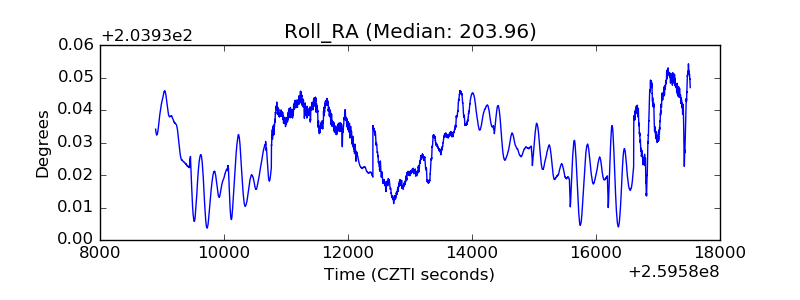 |
| Veto Counter | 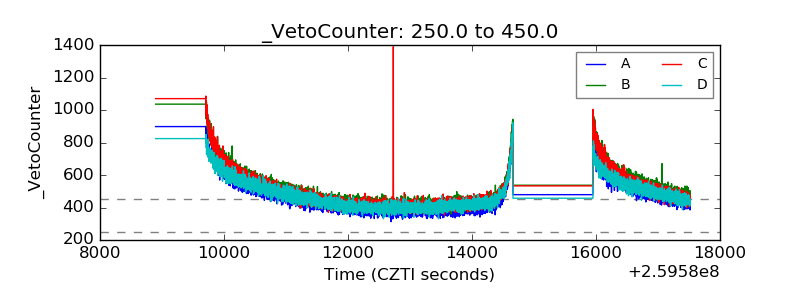 |