| Param | Original file | Final file |
|---|---|---|
| Filename | modeM0/AS1A04_103T01_9000001988_13447cztM0_level2.evt | modeM0/AS1A04_103T01_9000001988_13447cztM0_level2_quad_clean.evt |
| Size (bytes) | 439,012,800 | 91,471,680 |
| Size | 418.7 MB | 87.2 MB |
| Events in quadrant A | 3,208,581 | 590,728 |
| Events in quadrant B | 3,433,847 | 599,938 |
| Events in quadrant C | 3,145,857 | 578,563 |
| Events in quadrant D | 3,073,656 | 555,700 |
| Mode M0 | |||
|---|---|---|---|
| Quadrant | BADHDUFLAG | Total packets | Discarded packets |
| A | 0 | 13567 | 3 |
| B | 0 | 14205 | 2 |
| C | 0 | 13393 | 2 |
| D | 0 | 13474 | 2 |
| Mode SS | |||
|---|---|---|---|
| Quadrant | BADHDUFLAG | Total packets | Discarded packets |
| A | 0 | 128 | 0 |
| B | 0 | 128 | 0 |
| C | 0 | 128 | 0 |
| D | 0 | 128 | 0 |
| Mode M9 | |||
|---|---|---|---|
| Quadrant | BADHDUFLAG | Total packets | Discarded packets |
| A | 0 | 25 | 0 |
| B | 0 | 25 | 0 |
| C | 0 | 25 | 0 |
| D | 0 | 26 | 0 |
| Quadrant | Total seconds | Saturated seconds | Saturation percentage |
|---|---|---|---|
| A | 6385 | 51 | 0.798747% |
| B | 6385 | 76 | 1.190290% |
| C | 6385 | 25 | 0.391543% |
| D | 6385 | 26 | 0.407204% |
Noise dominated data is calculated using 1-second bins in cleaned event files. If a bin has >2000 counts, and if more than 50% of those come from <1% of pixels, then it is considered to be noise-dominated and hence unusable.
| Quadrant | # 1 sec bins | Bins with >0 counts | Bins with >2000 counts | High rate bins dominated by noise | Noise dominated (total time) | Noise dominated (detector-on time) | Marked lightcurve |
|---|---|---|---|---|---|---|---|
| A | 7721 | 6386 | 0 | 0 | 0.00% | 0.00% | 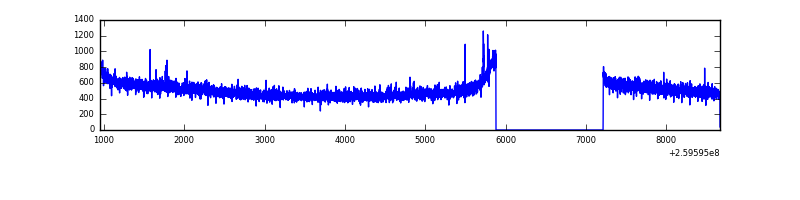 |
| B | 7721 | 6386 | 17 | 17 | 0.22% | 0.27% | 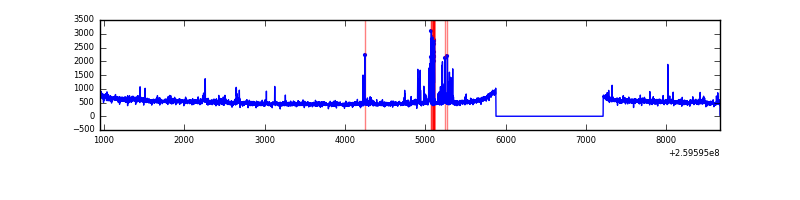 |
| C | 7721 | 6386 | 0 | 0 | 0.00% | 0.00% |  |
| D | 7721 | 6387 | 0 | 0 | 0.00% | 0.00% | 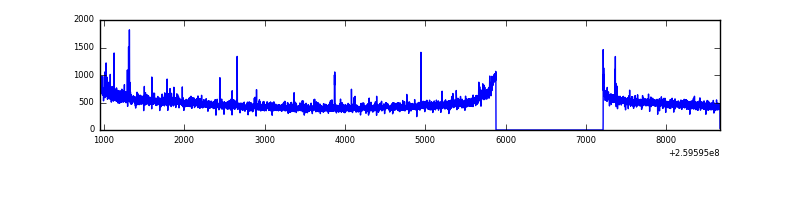 |
Top three noisy pixels from each quadrant. If the there are fewer than three noisy pixels in the level2.evt file, extra rows are filled as -1
| Pixel properties | Quadrant properties | ||||||
|---|---|---|---|---|---|---|---|
| Quadrant | DetID | PixID | Counts | Sigma | Mean | Median | Sigma |
| A | 13 | 248 | 10480 | 58.4 | 830 | 816 | 165.5 |
| A | 0 | 226 | 7397 | 39.77 | 830 | 816 | 165.5 |
| A | 12 | 194 | 6282 | 33.03 | 830 | 816 | 165.5 |
| B | 3 | 64 | 144480 | 929.41 | 829 | 811 | 154.6 |
| B | 4 | 173 | 33131 | 209.08 | 829 | 811 | 154.6 |
| B | 0 | 230 | 17592 | 108.56 | 829 | 811 | 154.6 |
| C | 3 | 233 | 36246 | 194.84 | 795 | 801 | 181.9 |
| C | 6 | 253 | 6036 | 28.78 | 795 | 801 | 181.9 |
| C | 13 | 61 | 5759 | 27.25 | 795 | 801 | 181.9 |
| D | 13 | 249 | 42085 | 223.62 | 789 | 769 | 184.8 |
| D | 2 | 234 | 23287 | 121.88 | 789 | 769 | 184.8 |
| D | 2 | 136 | 17262 | 89.27 | 789 | 769 | 184.8 |
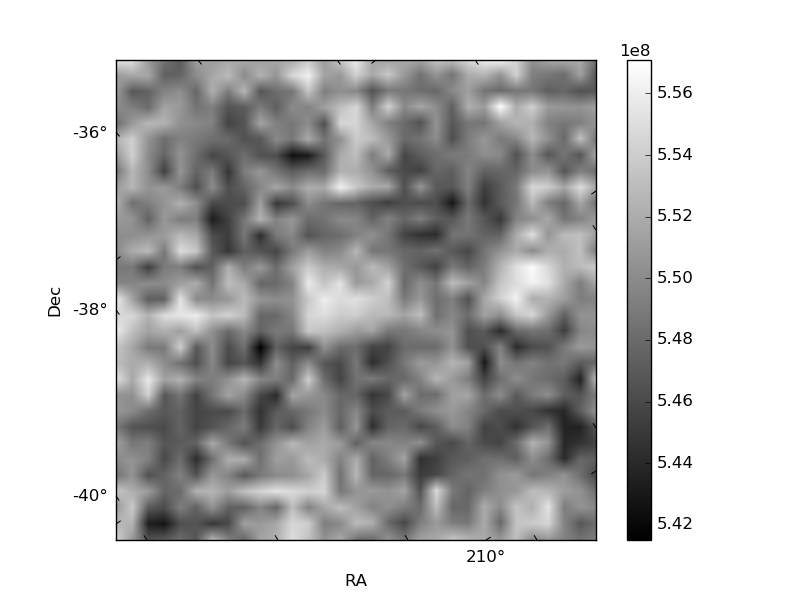
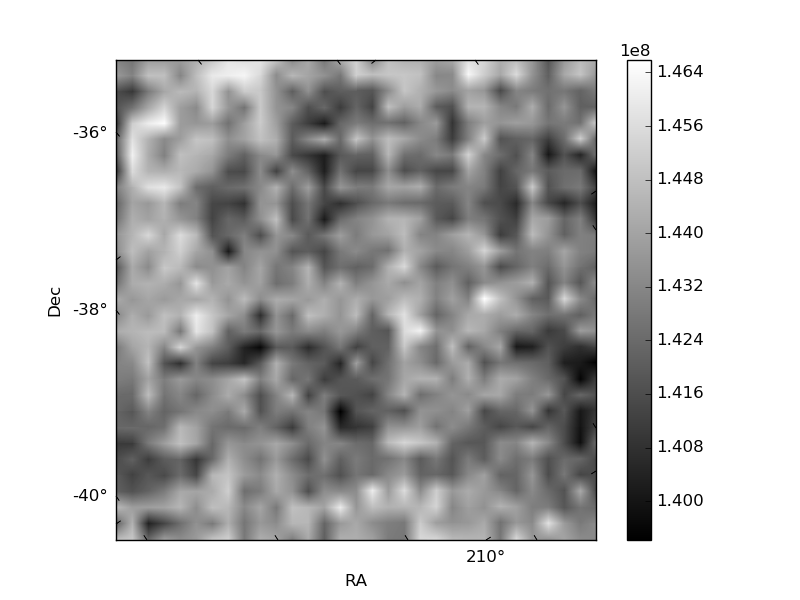
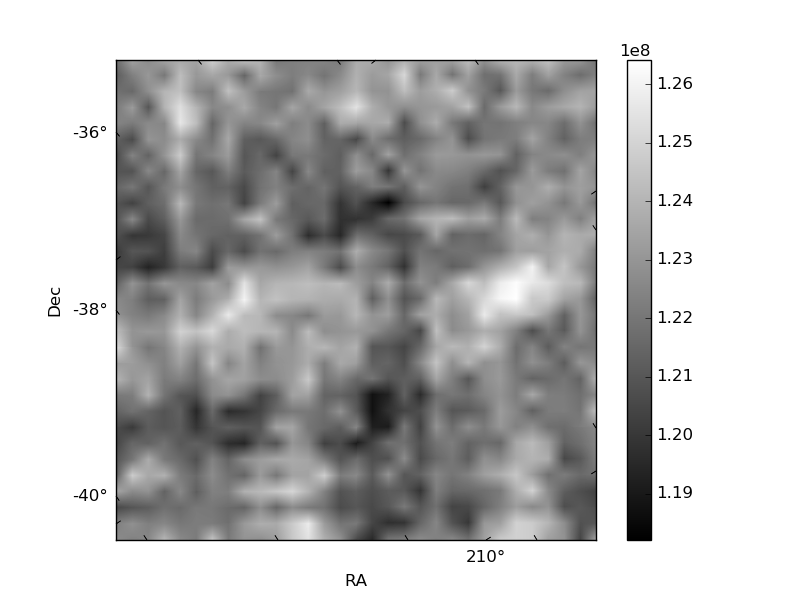
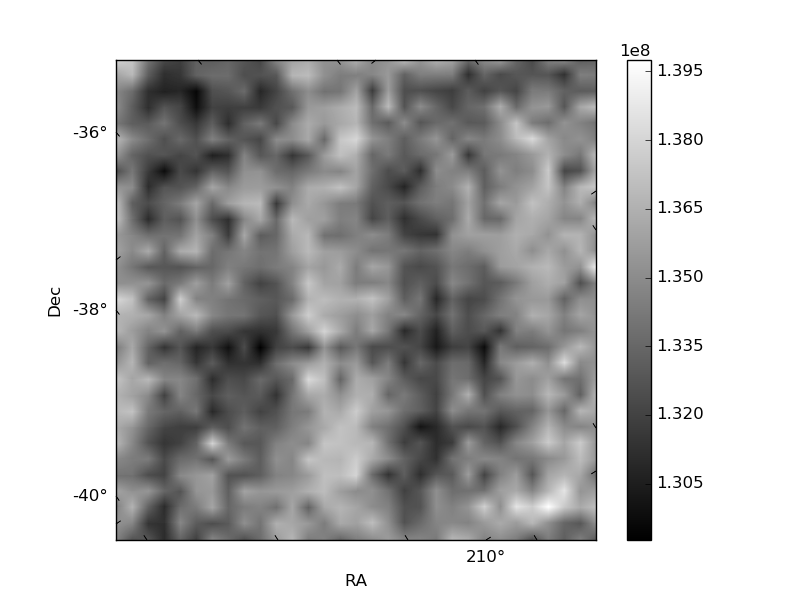
Histogram calculated using DETX and DETY for each event in the final _common_clean file
| Quadrant A |  |
 |
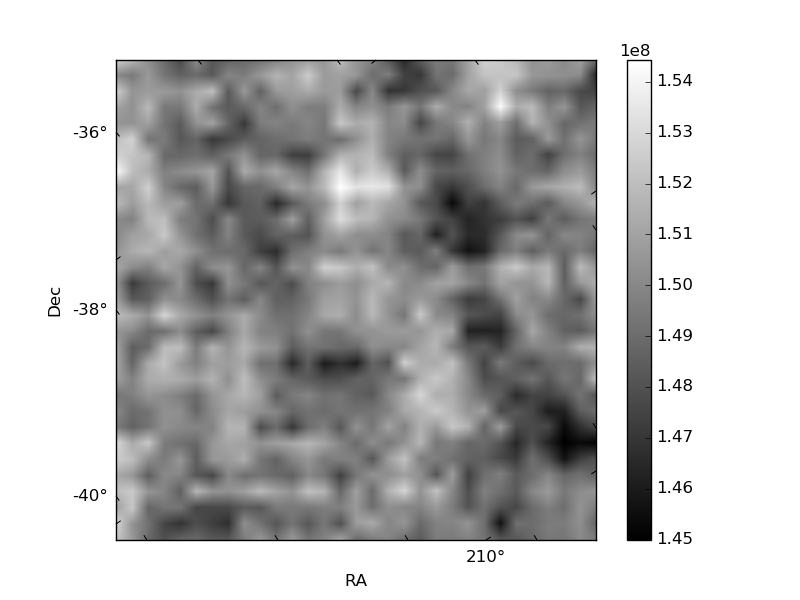
Quadrant B |
|---|---|---|---|
| Quadrant D | 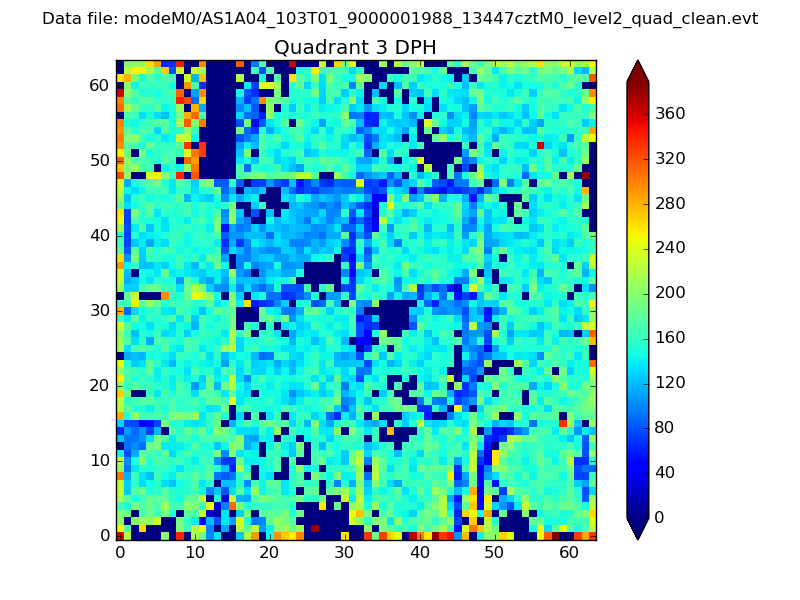 |
 |
Quadrant C |
| Plot type | Count rate plots | Images |
|---|---|---|
| Comparison with Poisson distribution Blue bars denote a histogram of data divided into 1 sec bins. Red curve is a Poisson curve with rate = median count rate of data. |
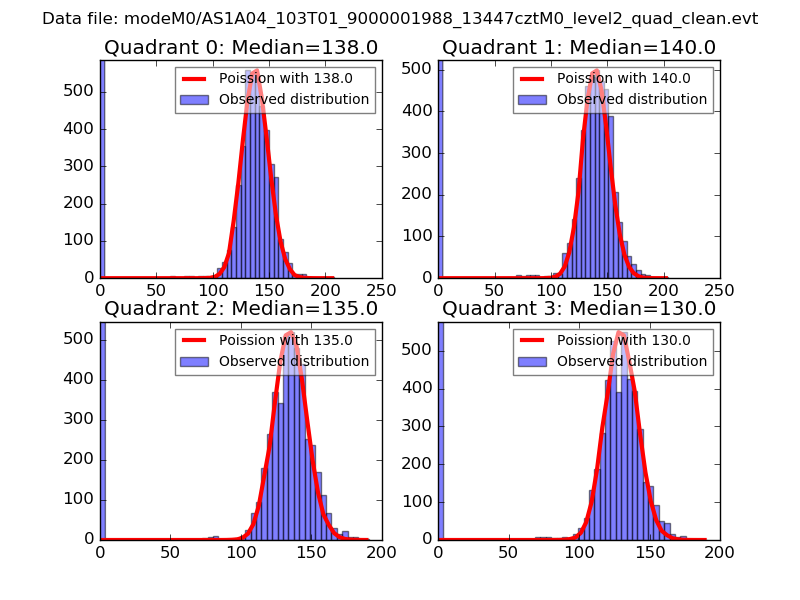 |
 |
| Quadrant-wise count rates Data is divided into 100 sec bins |
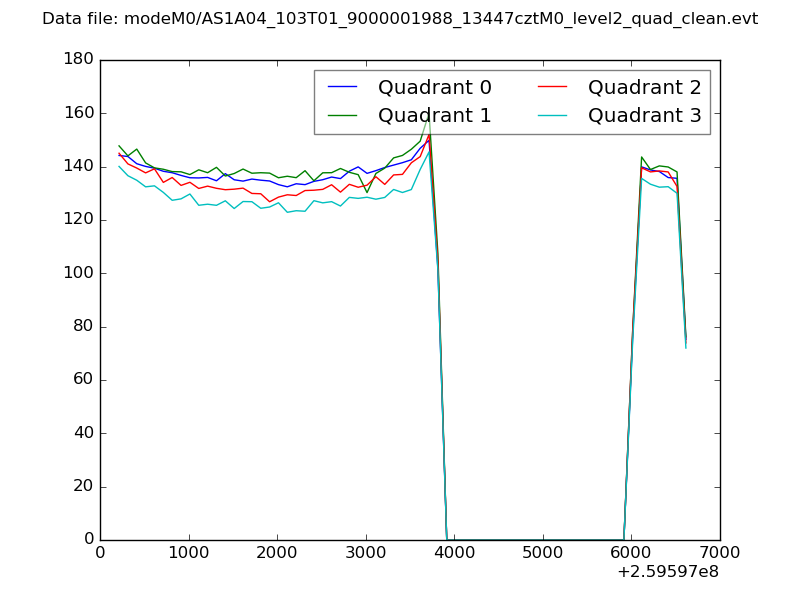 |
|
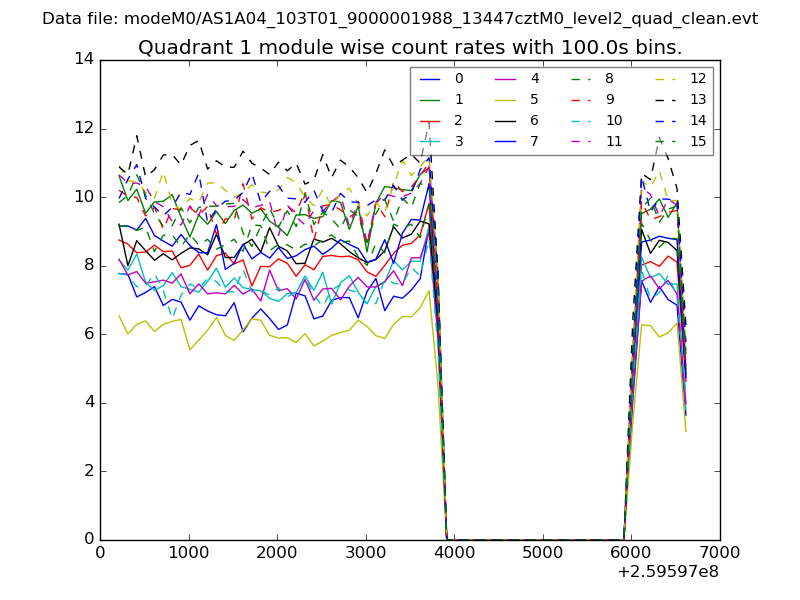
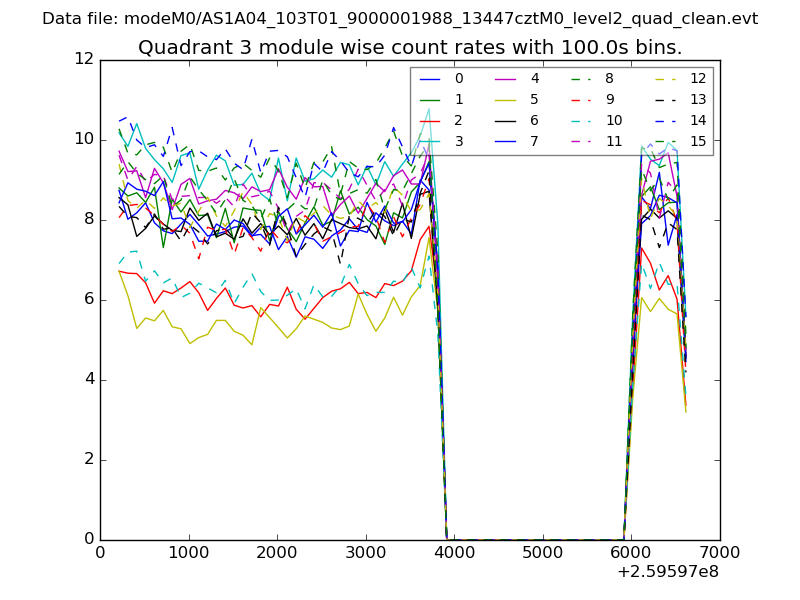
| Module-wise count rates for Quadrant A Data is divided into 100 sec bins |
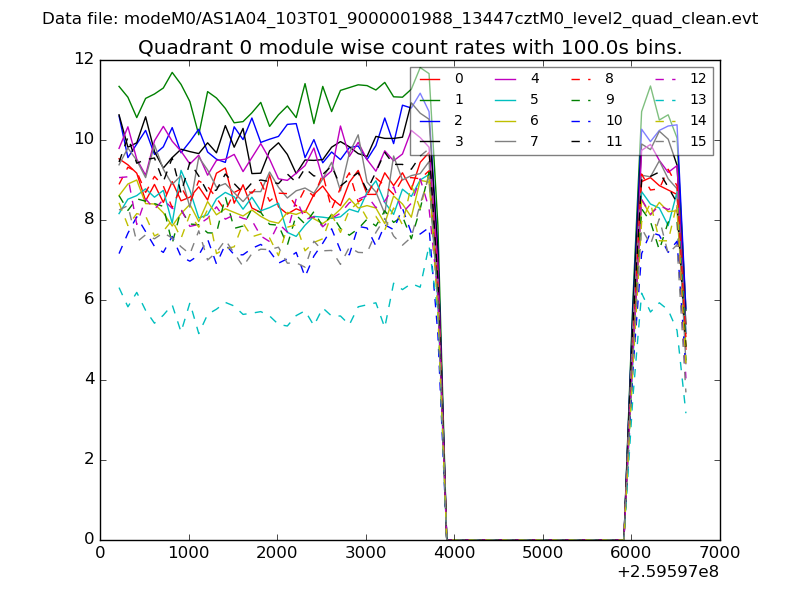 |
 |
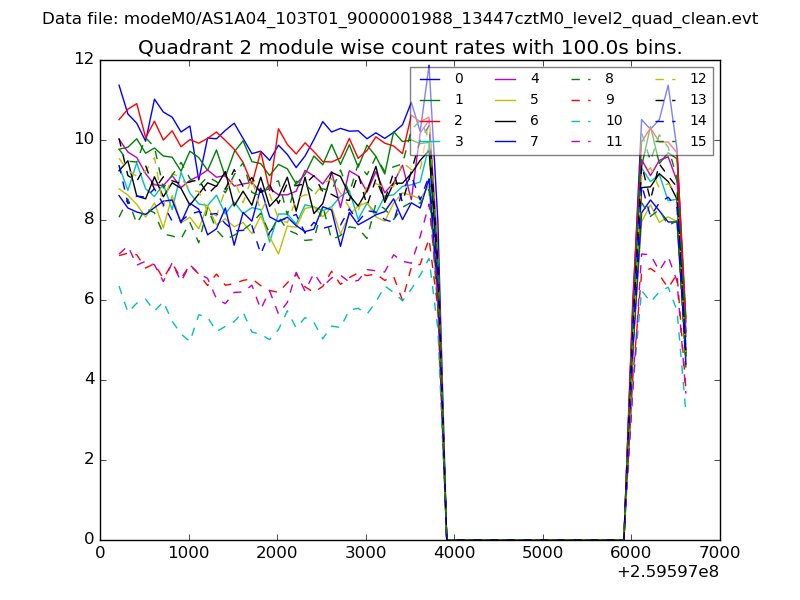
| Module-wise count rates for Quadrant B Data is divided into 100 sec bins |
 |
 |
| Module-wise count rates for Quadrant C Data is divided into 100 sec bins |
 |
 |
| Module-wise count rates for Quadrant D Data is divided into 100 sec bins |
 |
 |
| Parameter | Plot |
|---|---|
| CZT HV Monitor | 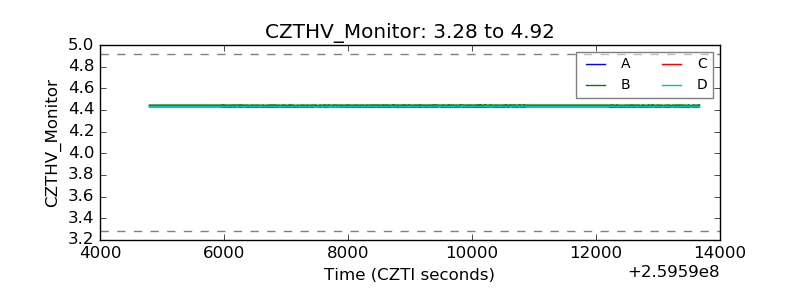 |
| D_VDD | 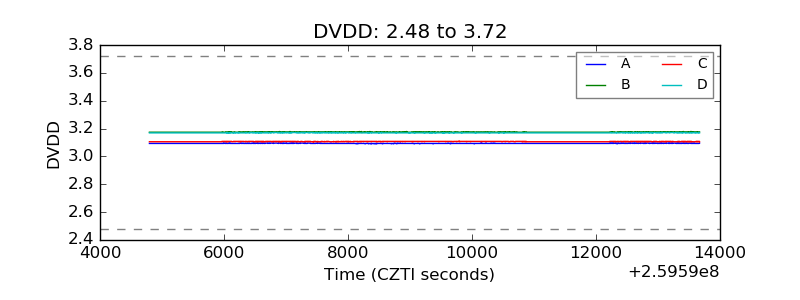 |
| Temperature 1 | 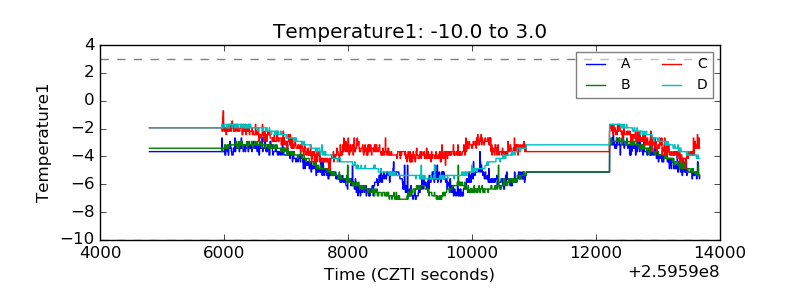 |
| Veto HV Monitor | 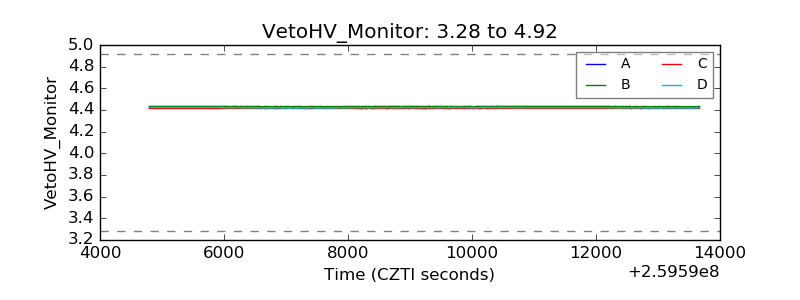 |
| Veto LLD | 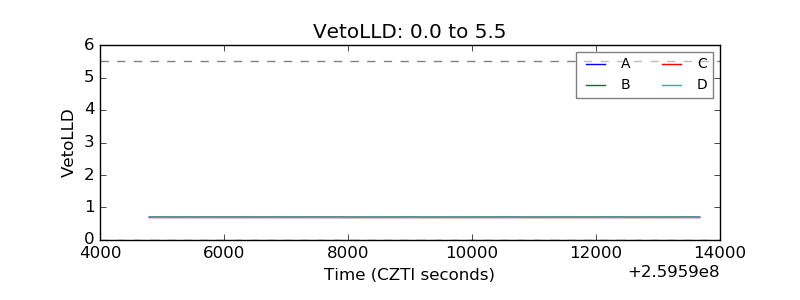 |
| Alpha Counter | 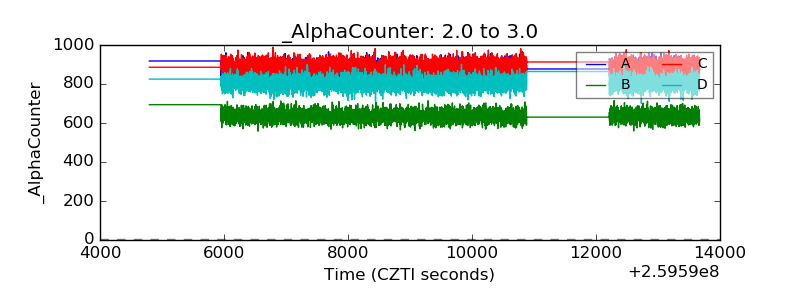 |
| _CPM_Rate | 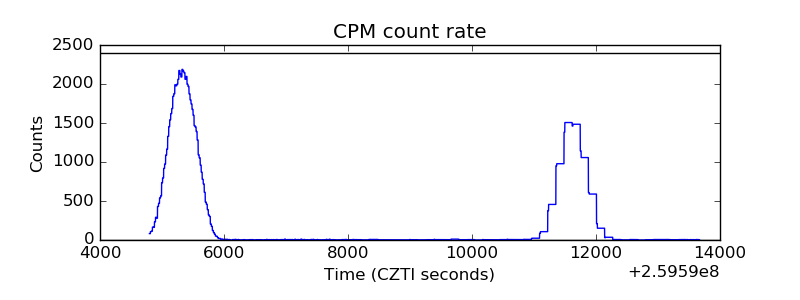 |
| CZT Counter | 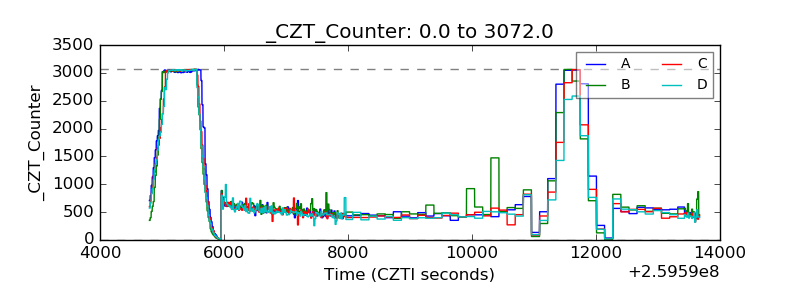 |
| +2.5 Volts monitor |  |
| +5 Volts monitor |  |
| _ROLL_ROT | 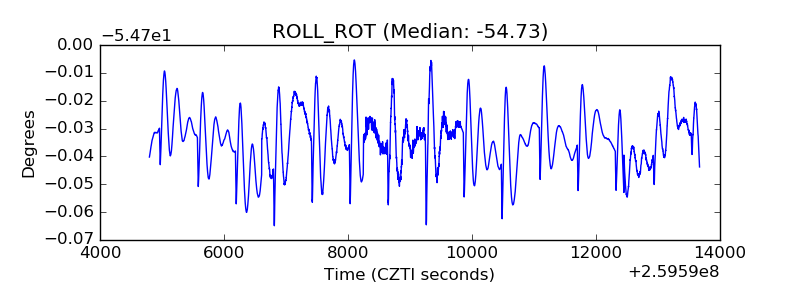 |
| _Roll_DEC | 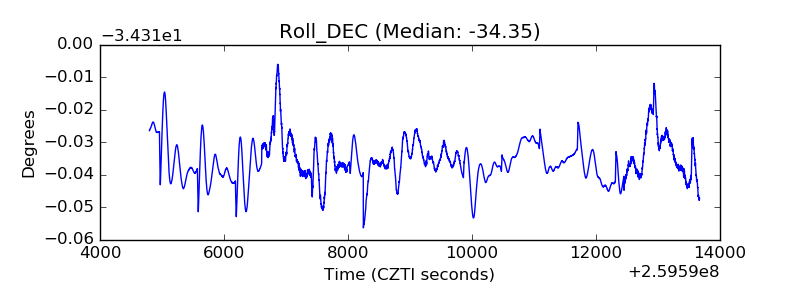 |
| _Roll_RA | 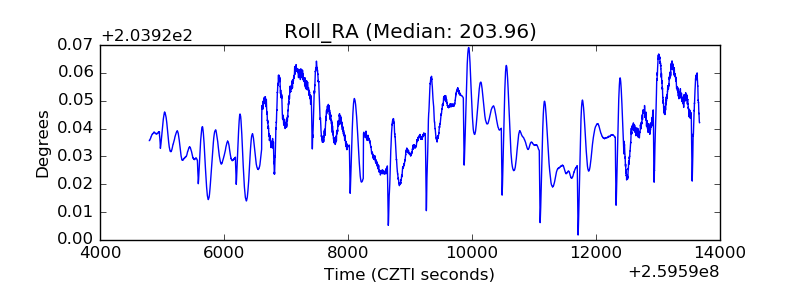 |
| Veto Counter | 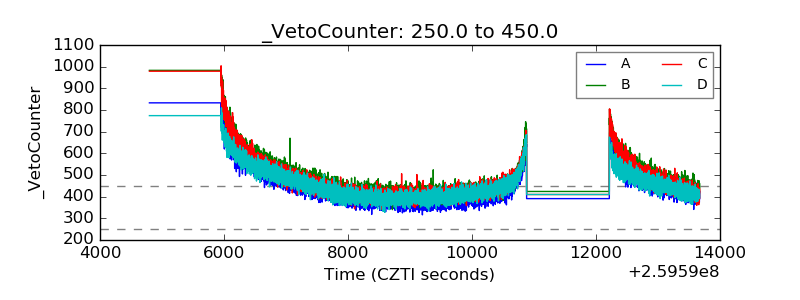 |