| Param | Original file | Final file |
|---|---|---|
| Filename | modeM0/AS1A04_103T01_9000001988_13449cztM0_level2.evt | modeM0/AS1A04_103T01_9000001988_13449cztM0_level2_quad_clean.evt |
| Size (bytes) | 453,991,680 | 95,595,840 |
| Size | 433.0 MB | 91.2 MB |
| Events in quadrant A | 3,278,604 | 610,687 |
| Events in quadrant B | 3,381,616 | 627,355 |
| Events in quadrant C | 3,248,915 | 605,617 |
| Events in quadrant D | 3,373,567 | 573,246 |
| Mode M0 | |||
|---|---|---|---|
| Quadrant | BADHDUFLAG | Total packets | Discarded packets |
| A | 0 | 14307 | 3 |
| B | 0 | 14552 | 2 |
| C | 0 | 14250 | 2 |
| D | 0 | 14937 | 2 |
| Mode SS | |||
|---|---|---|---|
| Quadrant | BADHDUFLAG | Total packets | Discarded packets |
| A | 0 | 140 | 0 |
| B | 0 | 140 | 0 |
| C | 0 | 140 | 0 |
| D | 0 | 140 | 0 |
| Mode M9 | |||
|---|---|---|---|
| Quadrant | BADHDUFLAG | Total packets | Discarded packets |
| A | 0 | 20 | 0 |
| B | 0 | 20 | 0 |
| C | 0 | 20 | 0 |
| D | 0 | 20 | 0 |
| Quadrant | Total seconds | Saturated seconds | Saturation percentage |
|---|---|---|---|
| A | 6859 | 90 | 1.312145% |
| B | 6859 | 110 | 1.603732% |
| C | 6859 | 51 | 0.743549% |
| D | 6859 | 107 | 1.559994% |
Noise dominated data is calculated using 1-second bins in cleaned event files. If a bin has >2000 counts, and if more than 50% of those come from <1% of pixels, then it is considered to be noise-dominated and hence unusable.
| Quadrant | # 1 sec bins | Bins with >0 counts | Bins with >2000 counts | High rate bins dominated by noise | Noise dominated (total time) | Noise dominated (detector-on time) | Marked lightcurve |
|---|---|---|---|---|---|---|---|
| A | 8890 | 6860 | 0 | 0 | 0.00% | 0.00% | 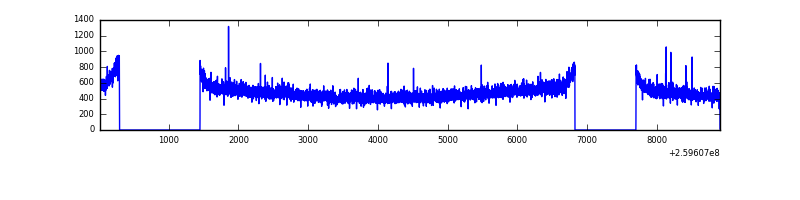 |
| B | 8890 | 6861 | 0 | 0 | 0.00% | 0.00% | 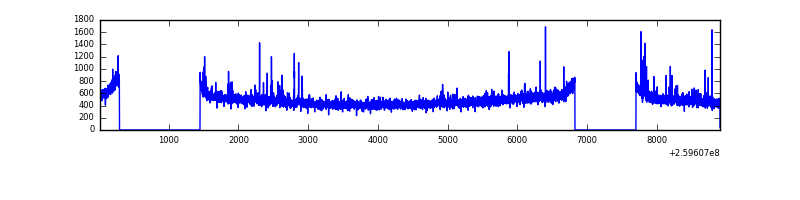 |
| C | 8890 | 6861 | 0 | 0 | 0.00% | 0.00% | 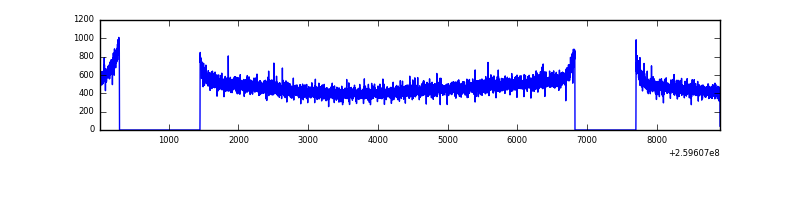 |
| D | 8890 | 6860 | 81 | 81 | 0.91% | 1.18% | 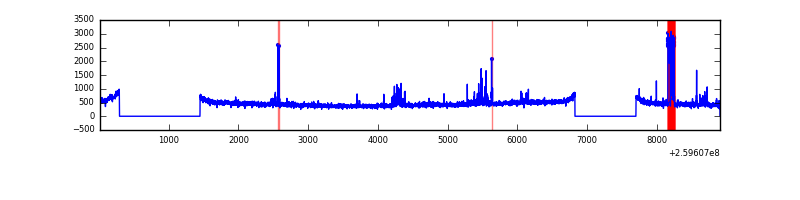 |
Top three noisy pixels from each quadrant. If the there are fewer than three noisy pixels in the level2.evt file, extra rows are filled as -1
| Pixel properties | Quadrant properties | ||||||
|---|---|---|---|---|---|---|---|
| Quadrant | DetID | PixID | Counts | Sigma | Mean | Median | Sigma |
| A | 2 | 250 | 37732 | 213.33 | 840 | 820 | 173.0 |
| A | 1 | 162 | 8995 | 47.25 | 840 | 820 | 173.0 |
| A | 0 | 226 | 7514 | 38.69 | 840 | 820 | 173.0 |
| B | 4 | 142 | 32326 | 195.82 | 843 | 823 | 160.9 |
| B | 4 | 173 | 24241 | 145.57 | 843 | 823 | 160.9 |
| B | 12 | 111 | 18739 | 111.37 | 843 | 823 | 160.9 |
| C | 3 | 233 | 60273 | 315.84 | 811 | 814 | 188.3 |
| C | 8 | 128 | 12398 | 61.53 | 811 | 814 | 188.3 |
| C | 8 | 112 | 6254 | 28.9 | 811 | 814 | 188.3 |
| D | 13 | 249 | 218876 | 1137.84 | 799 | 776 | 191.7 |
| D | 2 | 136 | 66797 | 344.43 | 799 | 776 | 191.7 |
| D | 12 | 110 | 40510 | 207.29 | 799 | 776 | 191.7 |
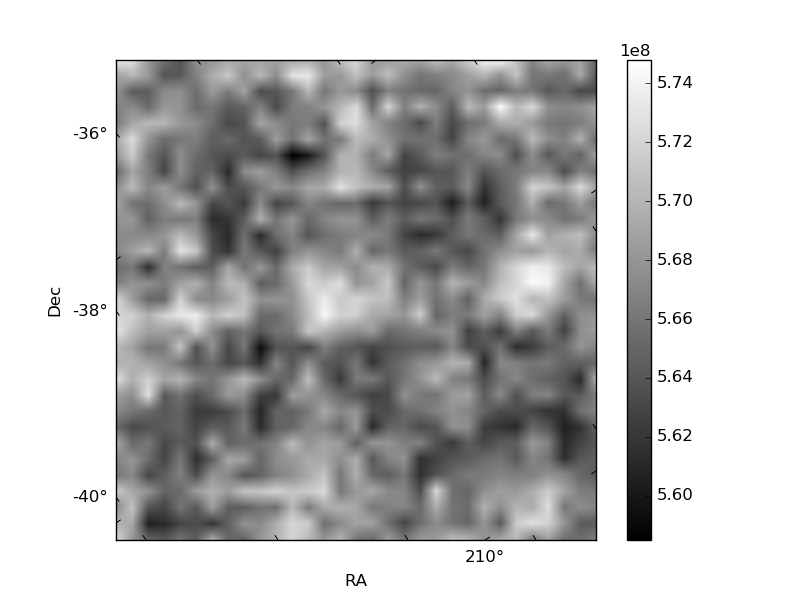
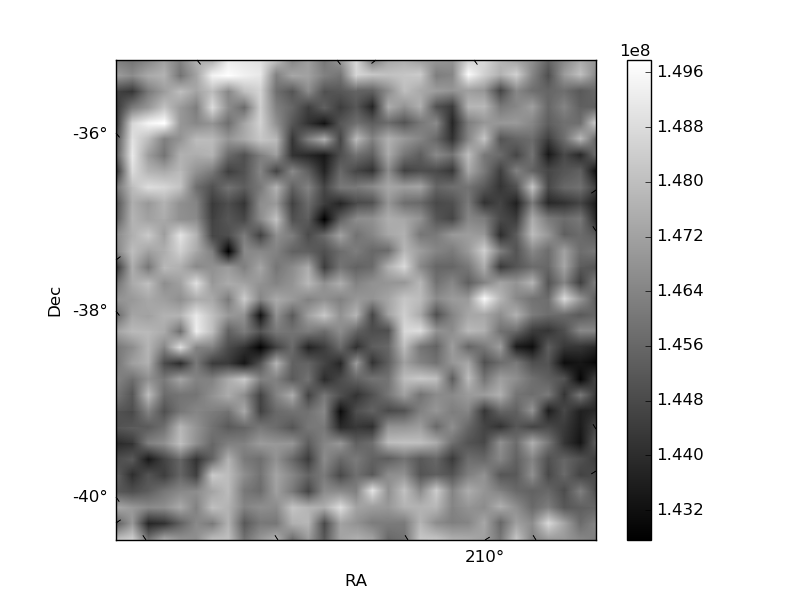
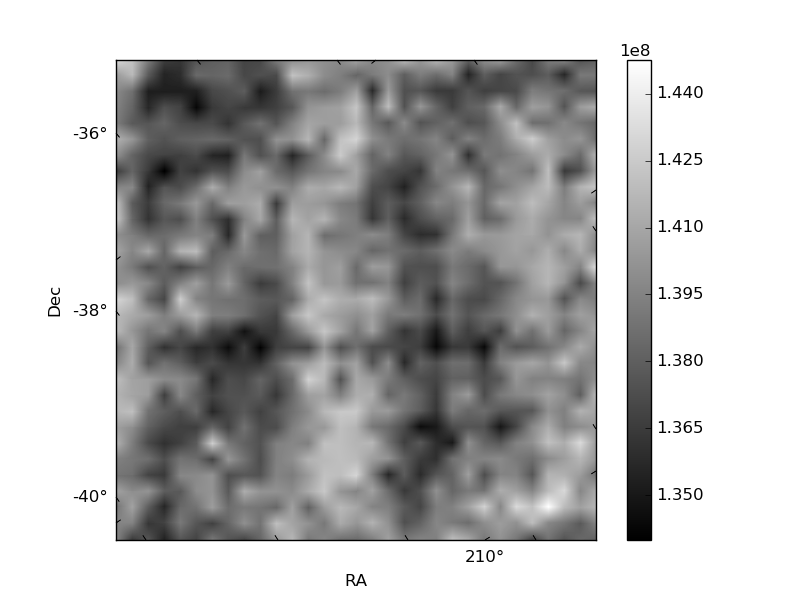
Histogram calculated using DETX and DETY for each event in the final _common_clean file
| Quadrant A | 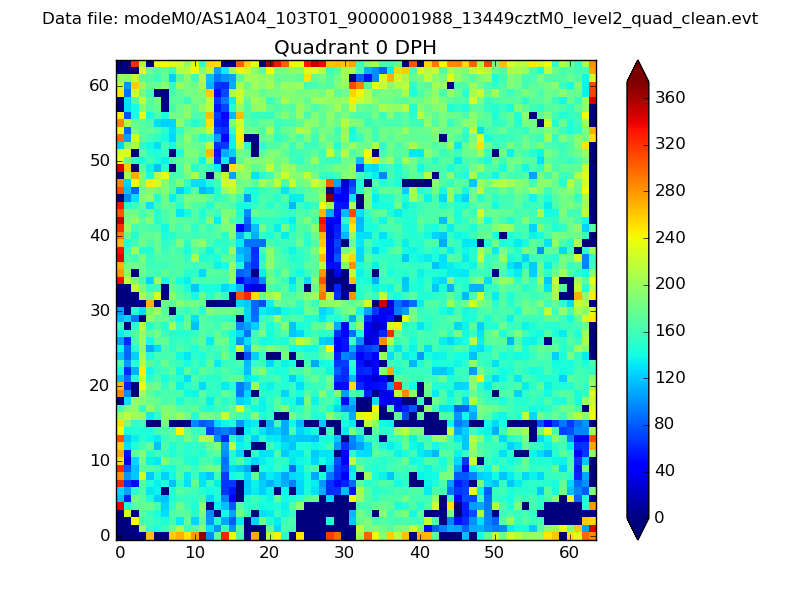 |
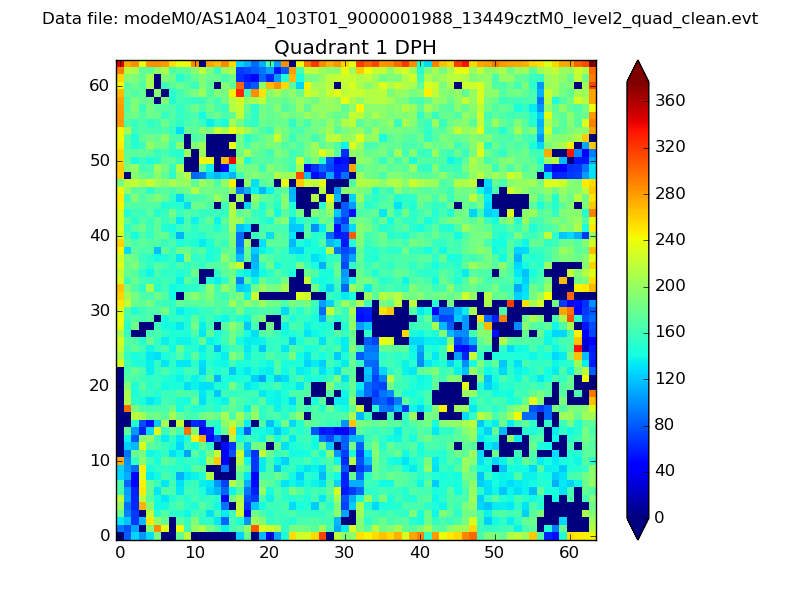 |
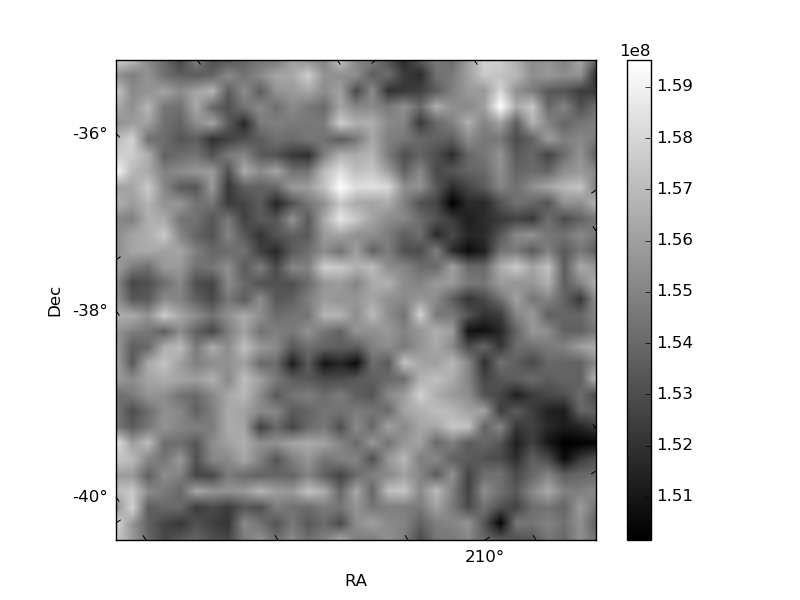
Quadrant B |
|---|---|---|---|
| Quadrant D | 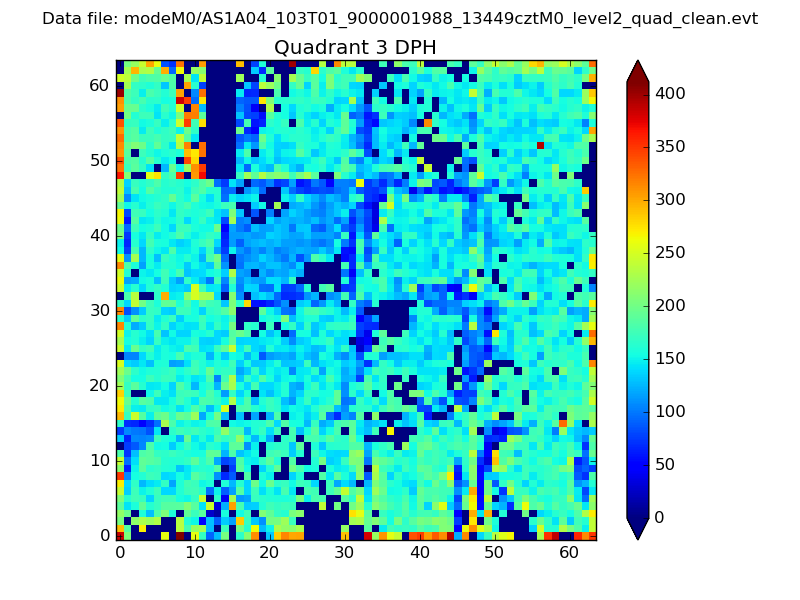 |
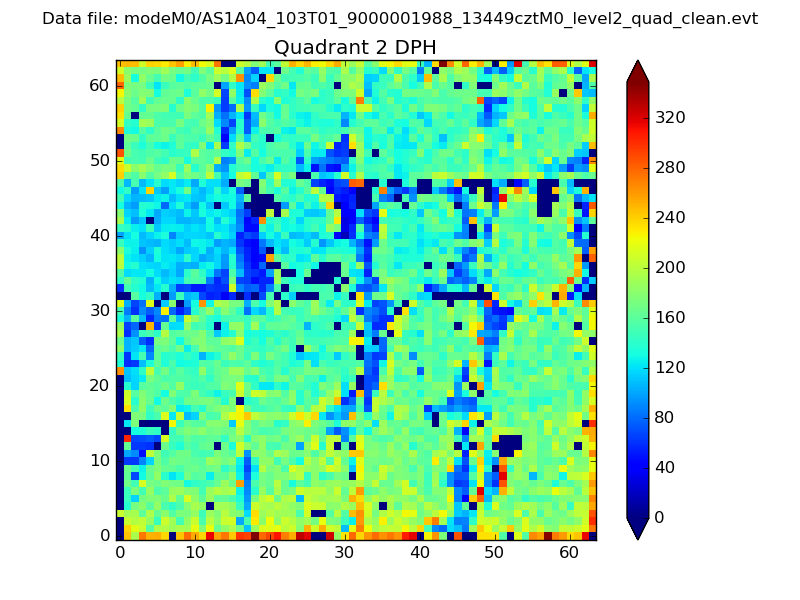 |
Quadrant C |
| Plot type | Count rate plots | Images |
|---|---|---|
| Comparison with Poisson distribution Blue bars denote a histogram of data divided into 1 sec bins. Red curve is a Poisson curve with rate = median count rate of data. |
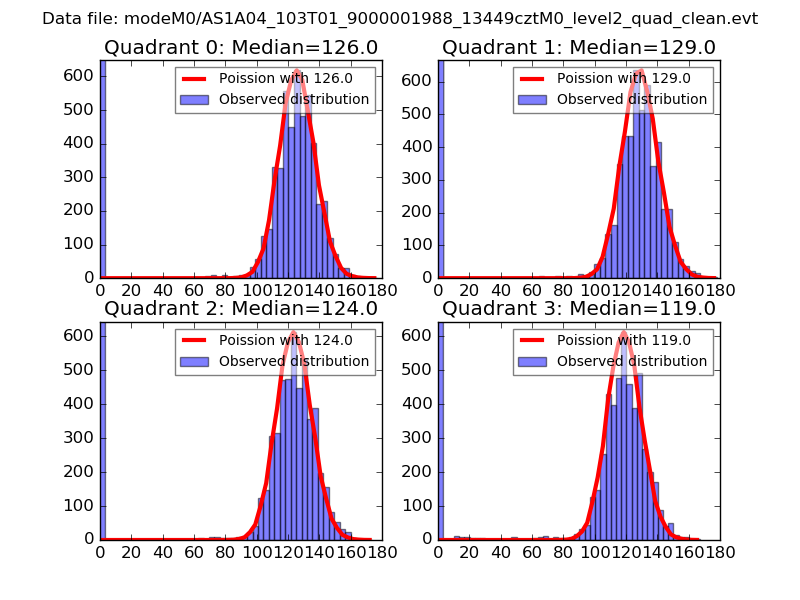 |
 |
| Quadrant-wise count rates Data is divided into 100 sec bins |
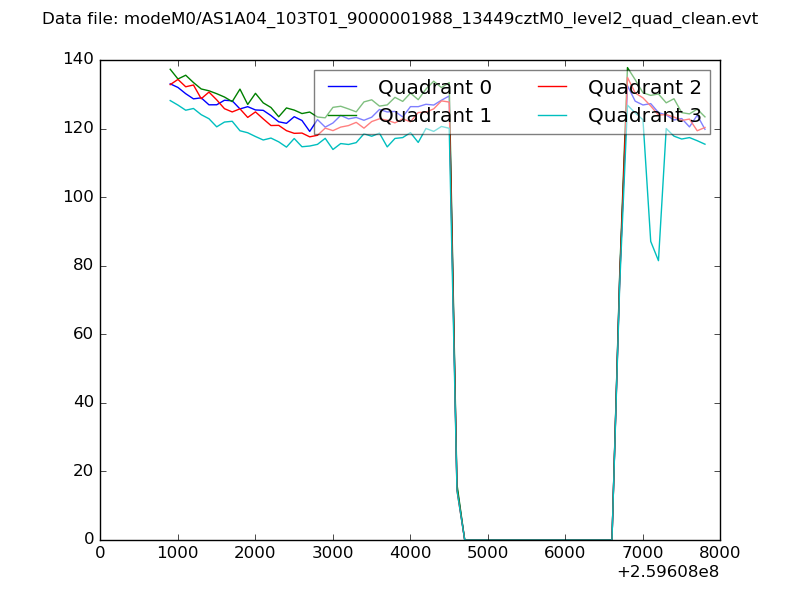 |
|
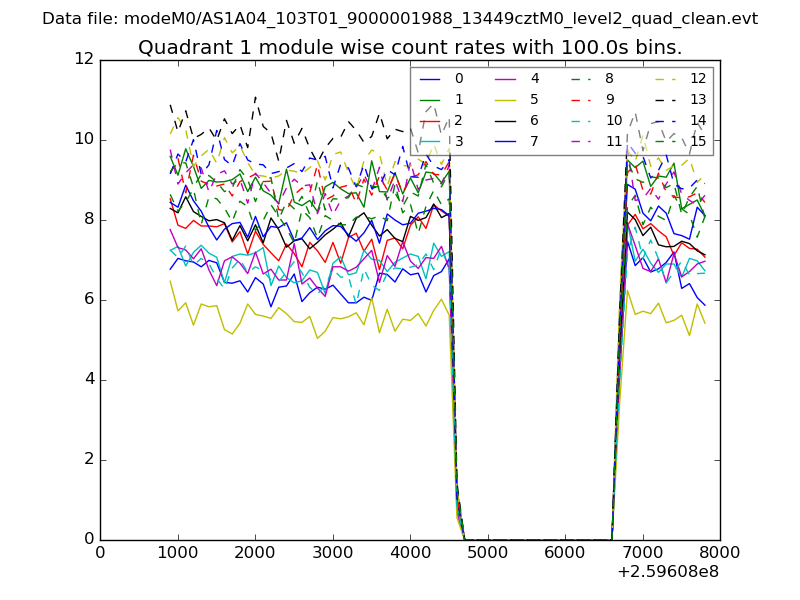
| Module-wise count rates for Quadrant A Data is divided into 100 sec bins |
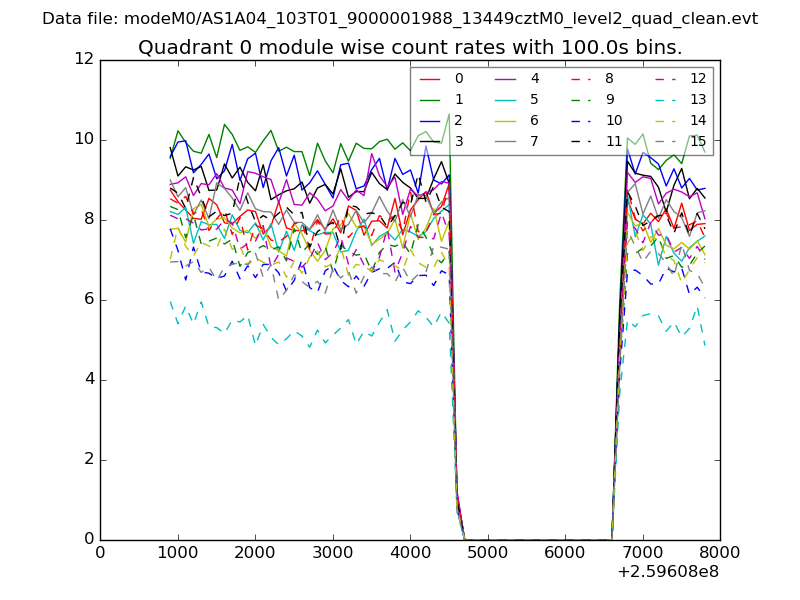 |
 |
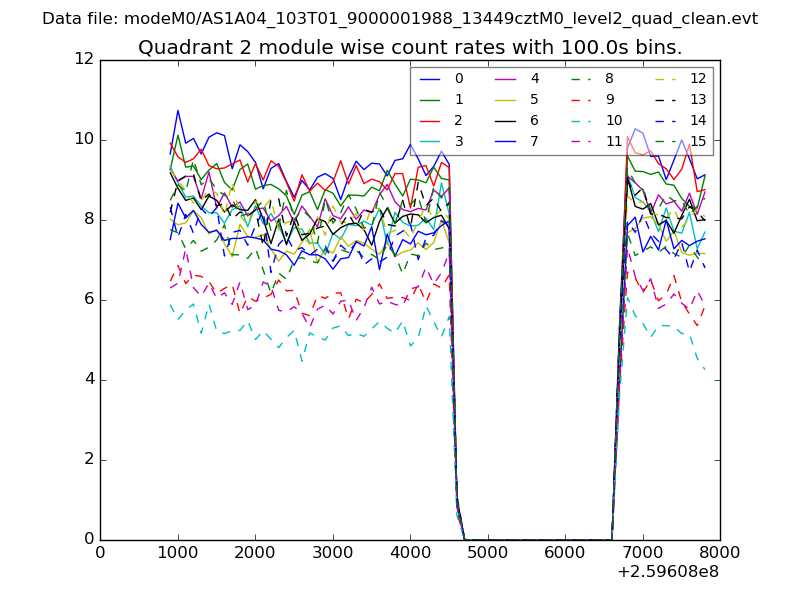
| Module-wise count rates for Quadrant B Data is divided into 100 sec bins |
 |
 |
| Module-wise count rates for Quadrant C Data is divided into 100 sec bins |
 |
 |
| Module-wise count rates for Quadrant D Data is divided into 100 sec bins |
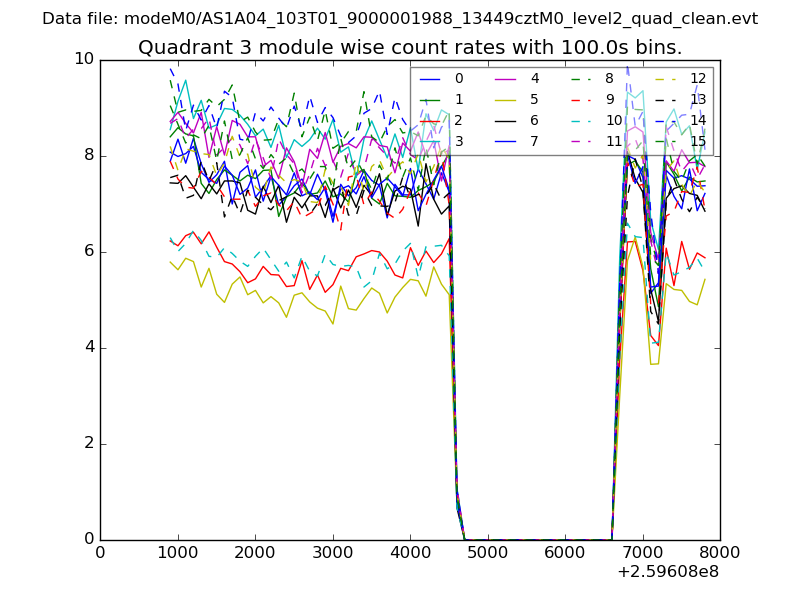 |
 |
| Parameter | Plot |
|---|---|
| CZT HV Monitor | 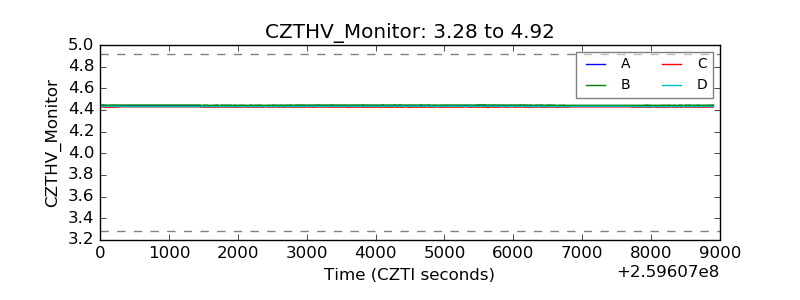 |
| D_VDD | 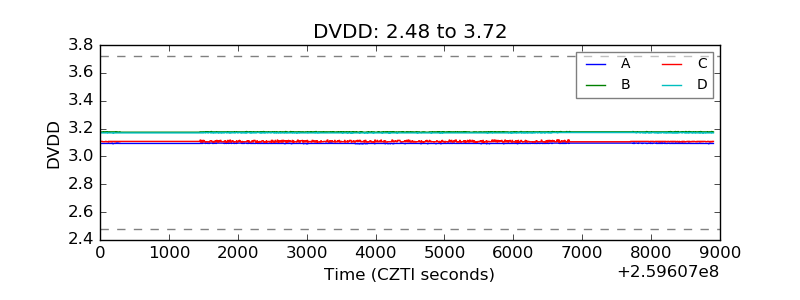 |
| Temperature 1 | 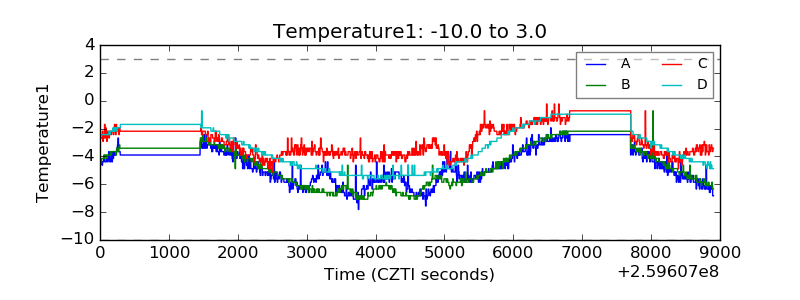 |
| Veto HV Monitor | 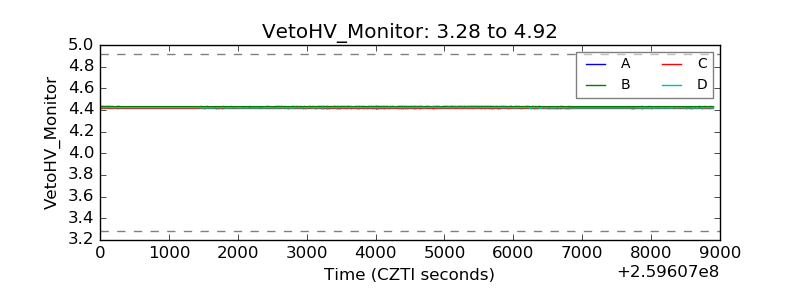 |
| Veto LLD |  |
| Alpha Counter | 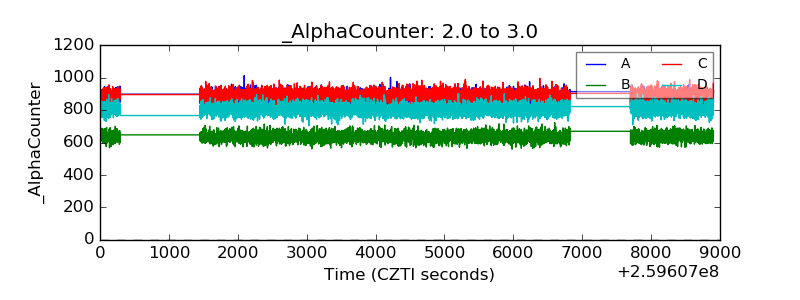 |
| _CPM_Rate | 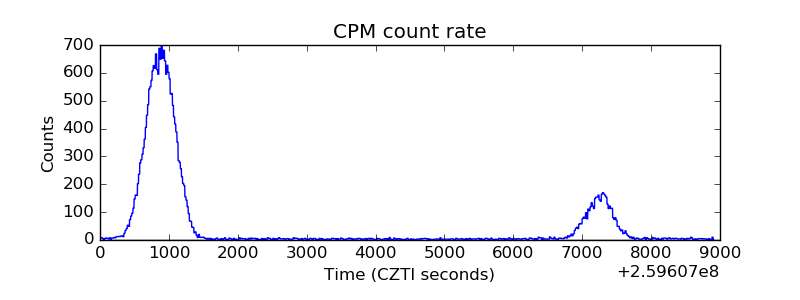 |
| CZT Counter | 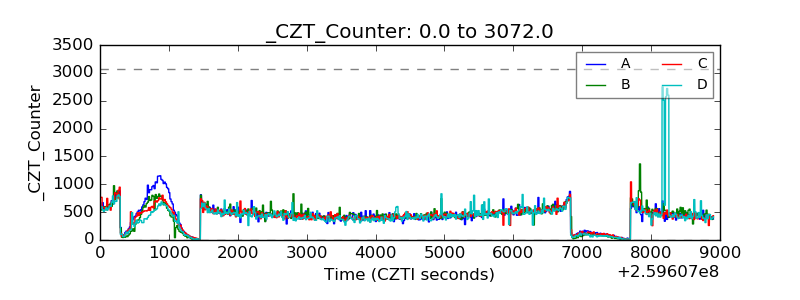 |
| +2.5 Volts monitor |  |
| +5 Volts monitor |  |
| _ROLL_ROT | 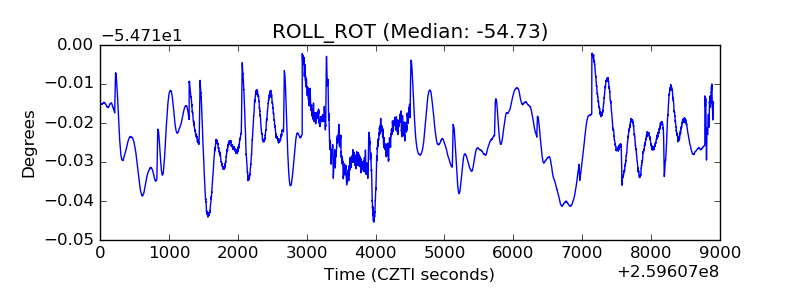 |
| _Roll_DEC | 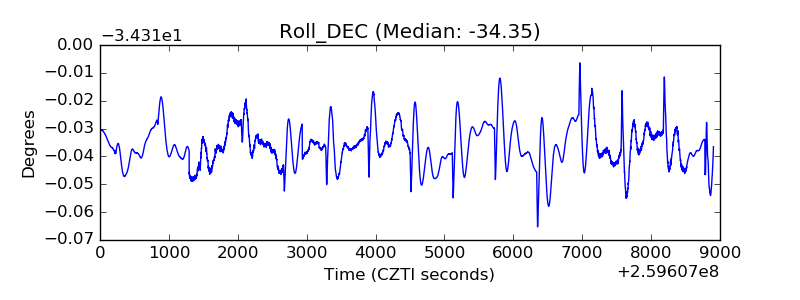 |
| _Roll_RA | 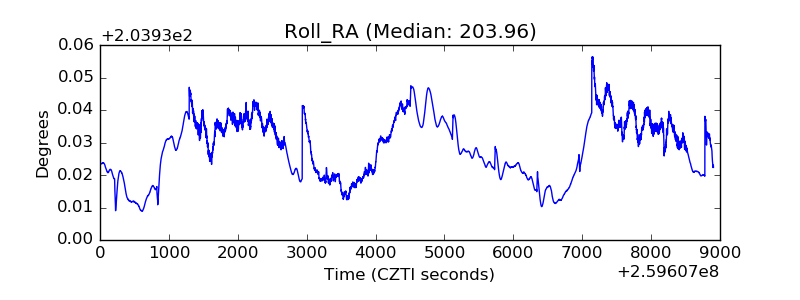 |
| Veto Counter | 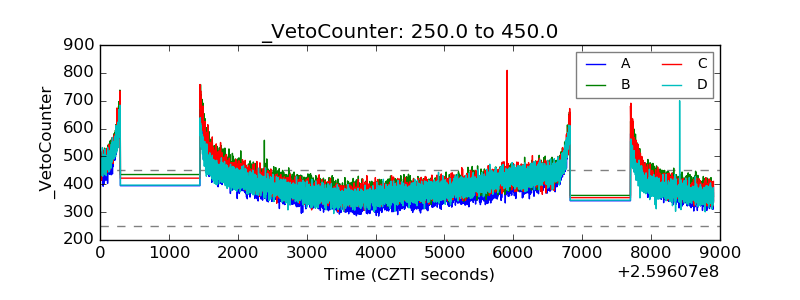 |