| Param | Original file | Final file |
|---|---|---|
| Filename | modeM0/AS1A04_103T01_9000001988_13451cztM0_level2.evt | modeM0/AS1A04_103T01_9000001988_13451cztM0_level2_quad_clean.evt |
| Size (bytes) | 559,045,440 | 108,423,360 |
| Size | 533.1 MB | 103.4 MB |
| Events in quadrant A | 3,987,724 | 677,798 |
| Events in quadrant B | 4,204,479 | 694,191 |
| Events in quadrant C | 3,996,523 | 675,537 |
| Events in quadrant D | 4,160,887 | 641,570 |
| Mode M0 | |||
|---|---|---|---|
| Quadrant | BADHDUFLAG | Total packets | Discarded packets |
| A | 0 | 17711 | 2 |
| B | 0 | 18232 | 1 |
| C | 0 | 17743 | 1 |
| D | 0 | 18446 | 1 |
| Mode SS | |||
|---|---|---|---|
| Quadrant | BADHDUFLAG | Total packets | Discarded packets |
| A | 0 | 174 | 0 |
| B | 0 | 174 | 0 |
| C | 0 | 174 | 0 |
| D | 0 | 174 | 0 |
| Mode M9 | |||
|---|---|---|---|
| Quadrant | BADHDUFLAG | Total packets | Discarded packets |
| A | 0 | 8 | 0 |
| B | 0 | 8 | 0 |
| C | 0 | 8 | 0 |
| D | 0 | 8 | 0 |
| Quadrant | Total seconds | Saturated seconds | Saturation percentage |
|---|---|---|---|
| A | 8564 | 32 | 0.373657% |
| B | 8564 | 102 | 1.191032% |
| C | 8564 | 29 | 0.338627% |
| D | 8564 | 38 | 0.443718% |
Noise dominated data is calculated using 1-second bins in cleaned event files. If a bin has >2000 counts, and if more than 50% of those come from <1% of pixels, then it is considered to be noise-dominated and hence unusable.
| Quadrant | # 1 sec bins | Bins with >0 counts | Bins with >2000 counts | High rate bins dominated by noise | Noise dominated (total time) | Noise dominated (detector-on time) | Marked lightcurve |
|---|---|---|---|---|---|---|---|
| A | 9330 | 8569 | 0 | 0 | 0.00% | 0.00% | 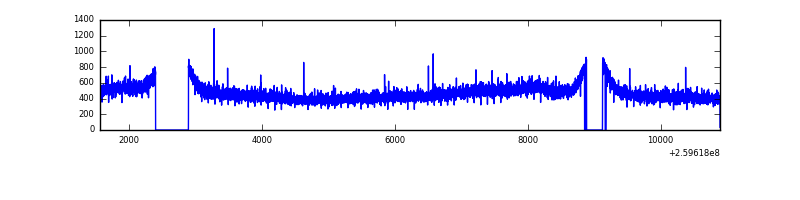 |
| B | 9330 | 8568 | 6 | 6 | 0.06% | 0.07% | 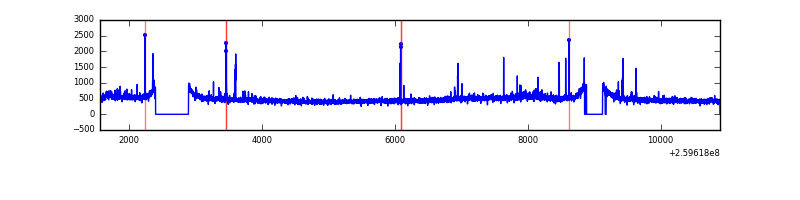 |
| C | 9330 | 8569 | 5 | 5 | 0.05% | 0.06% | 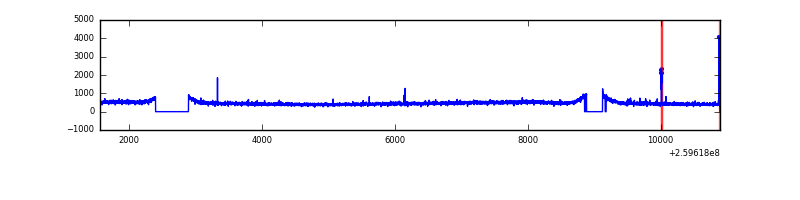 |
| D | 9330 | 8569 | 17 | 17 | 0.18% | 0.20% | 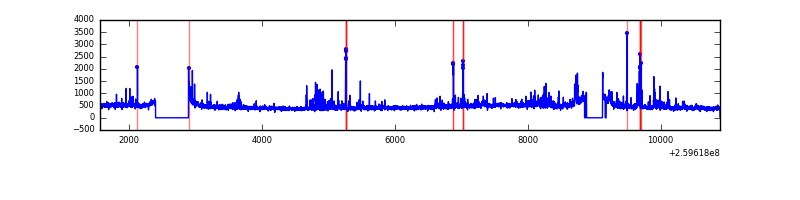 |
Top three noisy pixels from each quadrant. If the there are fewer than three noisy pixels in the level2.evt file, extra rows are filled as -1
| Pixel properties | Quadrant properties | ||||||
|---|---|---|---|---|---|---|---|
| Quadrant | DetID | PixID | Counts | Sigma | Mean | Median | Sigma |
| A | 1 | 162 | 18990 | 85.84 | 1028 | 1005 | 209.5 |
| A | 0 | 226 | 9165 | 38.94 | 1028 | 1005 | 209.5 |
| A | 12 | 194 | 7862 | 32.73 | 1028 | 1005 | 209.5 |
| B | 4 | 142 | 62180 | 304.5 | 1032 | 1004 | 200.9 |
| B | 4 | 173 | 35806 | 173.23 | 1032 | 1004 | 200.9 |
| B | 0 | 214 | 27296 | 130.87 | 1032 | 1004 | 200.9 |
| C | 3 | 233 | 47207 | 198.32 | 999 | 1006 | 233.0 |
| C | 10 | 9 | 29631 | 122.88 | 999 | 1006 | 233.0 |
| C | 14 | 234 | 9661 | 37.15 | 999 | 1006 | 233.0 |
| D | 13 | 249 | 163884 | 683.12 | 987 | 959 | 238.5 |
| D | 8 | 195 | 163780 | 682.68 | 987 | 959 | 238.5 |
| D | 2 | 234 | 36627 | 149.55 | 987 | 959 | 238.5 |
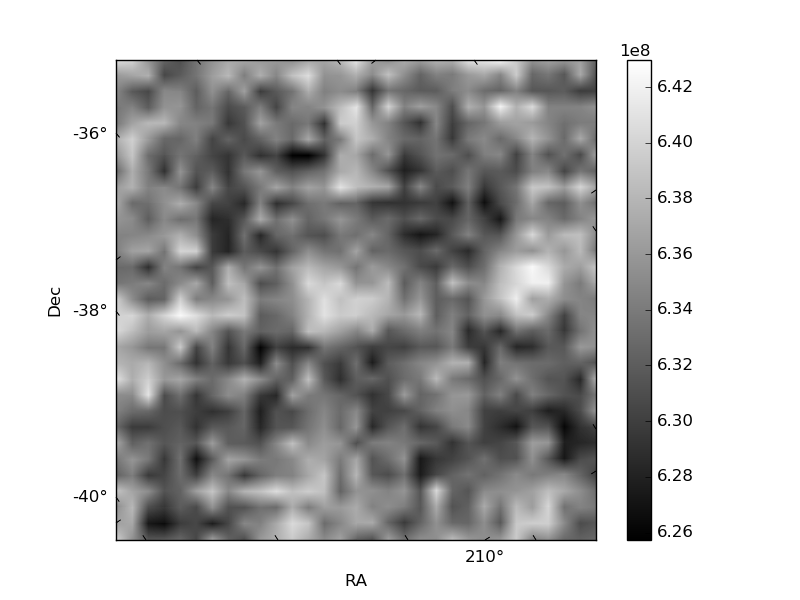
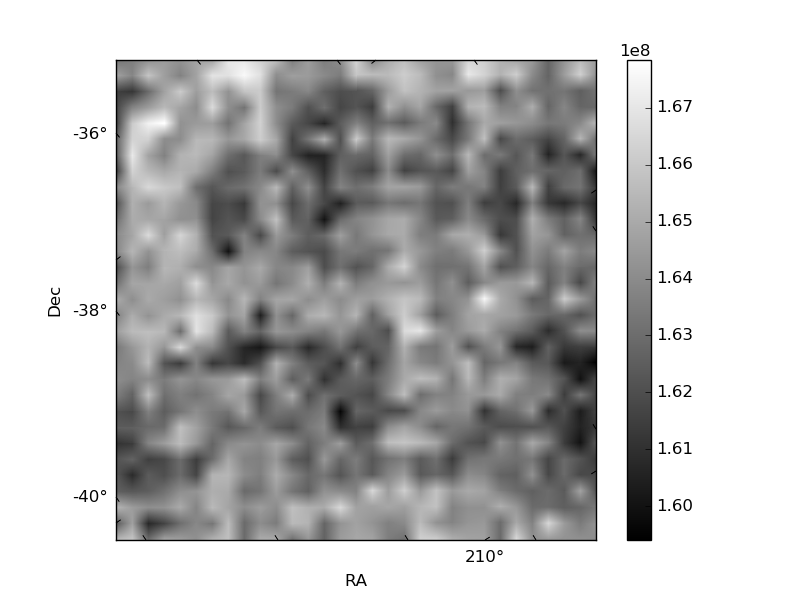
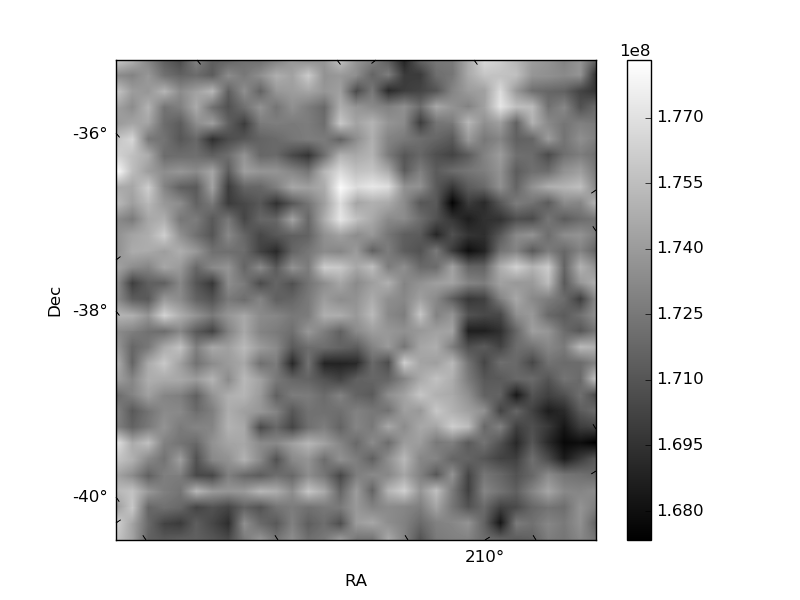
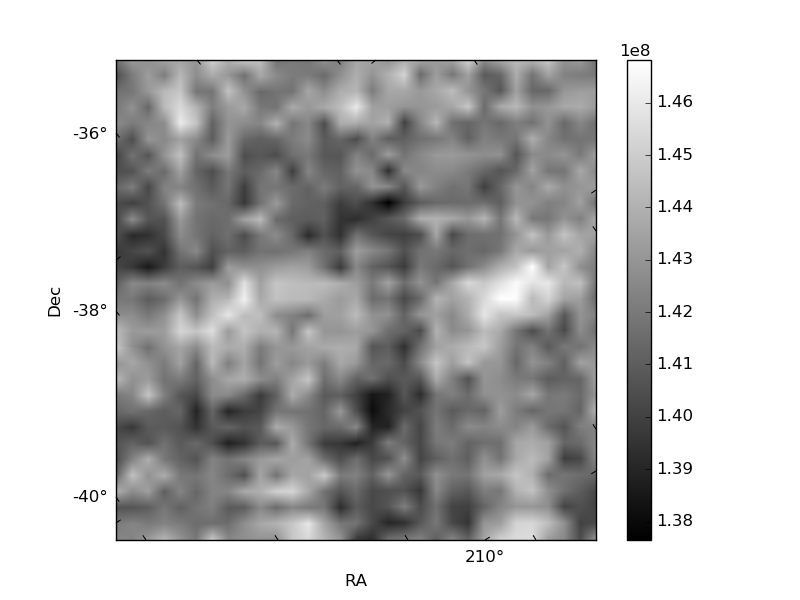
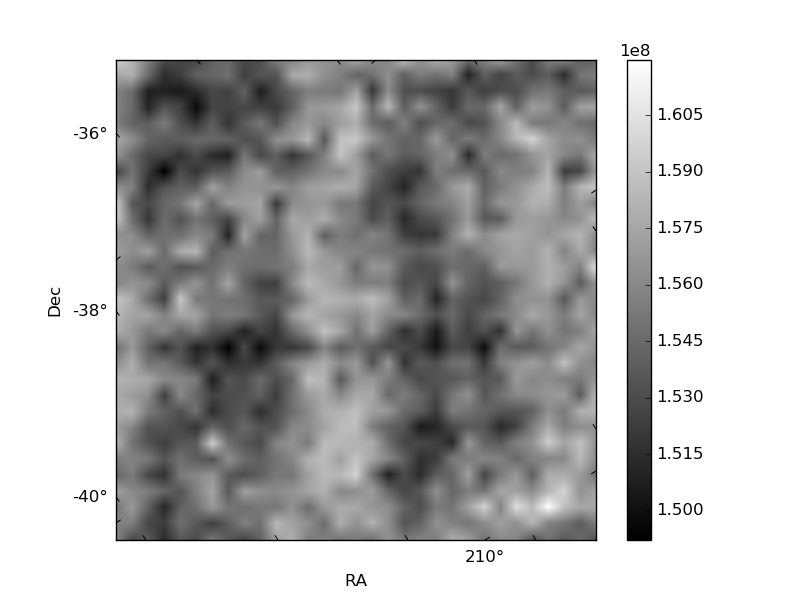
Histogram calculated using DETX and DETY for each event in the final _common_clean file
| Quadrant A | 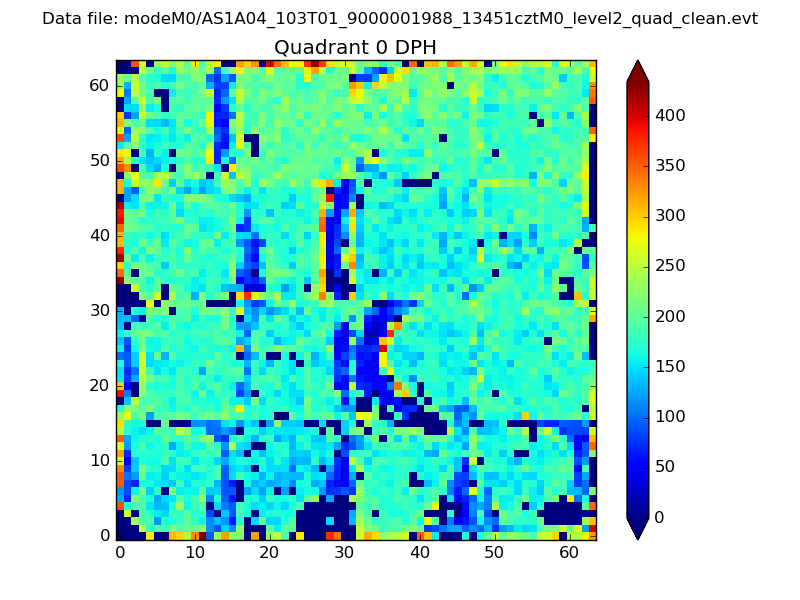 |
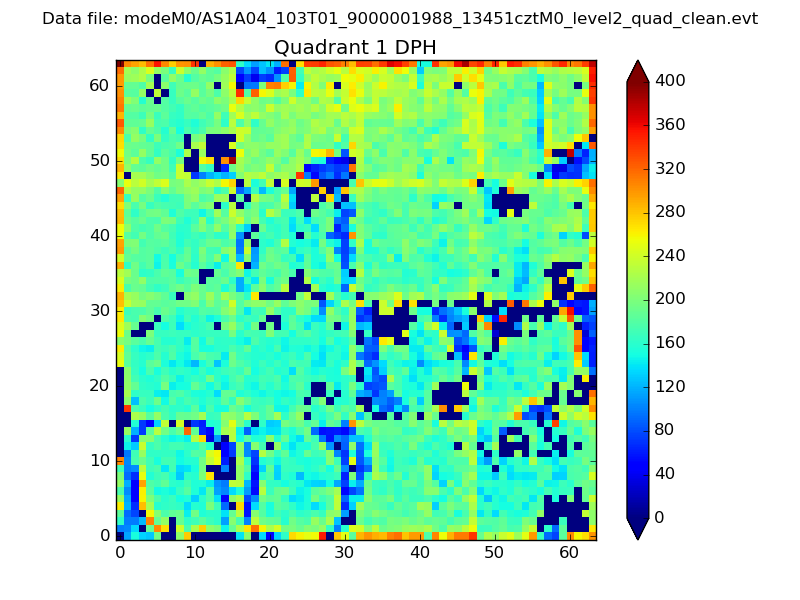 |
Quadrant B |
|---|---|---|---|
| Quadrant D | 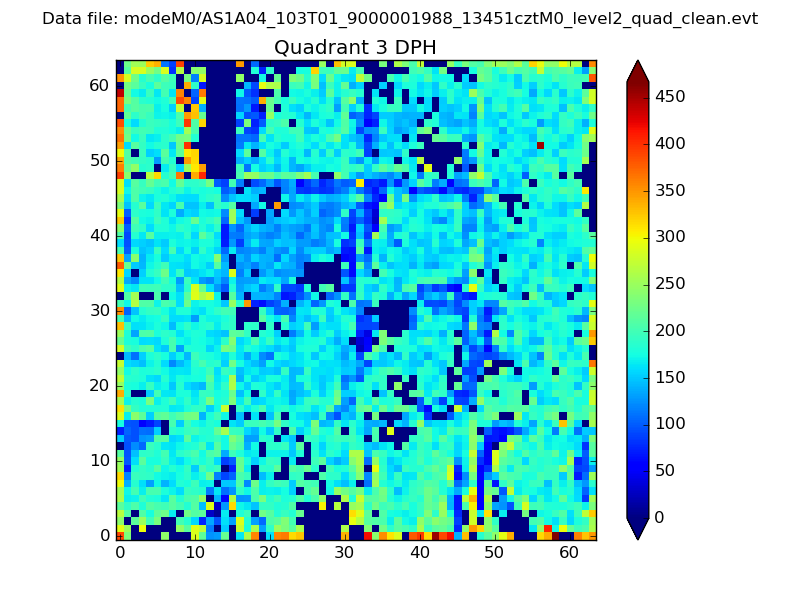 |
 |
Quadrant C |
| Plot type | Count rate plots | Images |
|---|---|---|
| Comparison with Poisson distribution Blue bars denote a histogram of data divided into 1 sec bins. Red curve is a Poisson curve with rate = median count rate of data. |
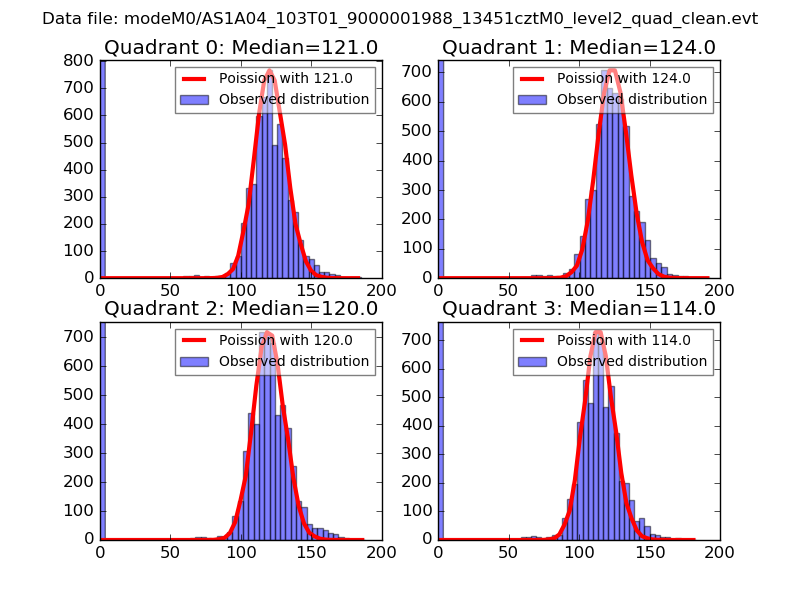 |
 |
| Quadrant-wise count rates Data is divided into 100 sec bins |
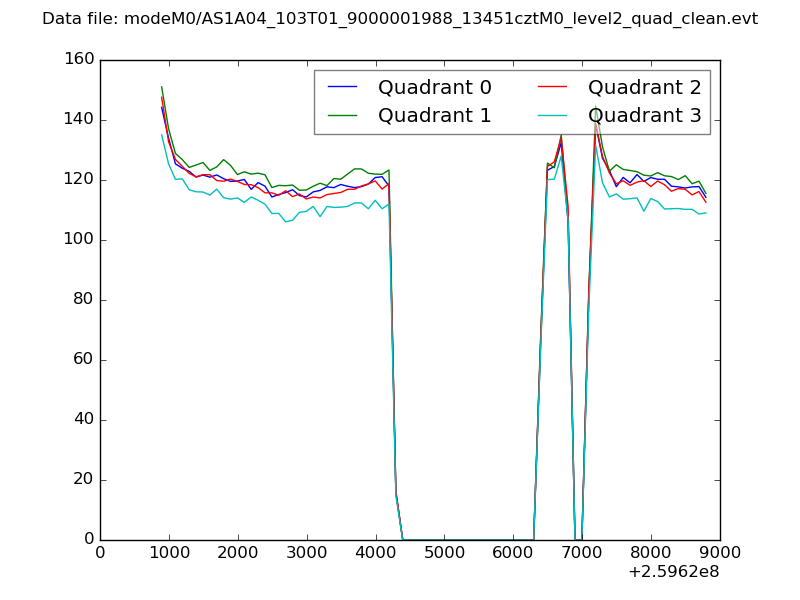 |
|
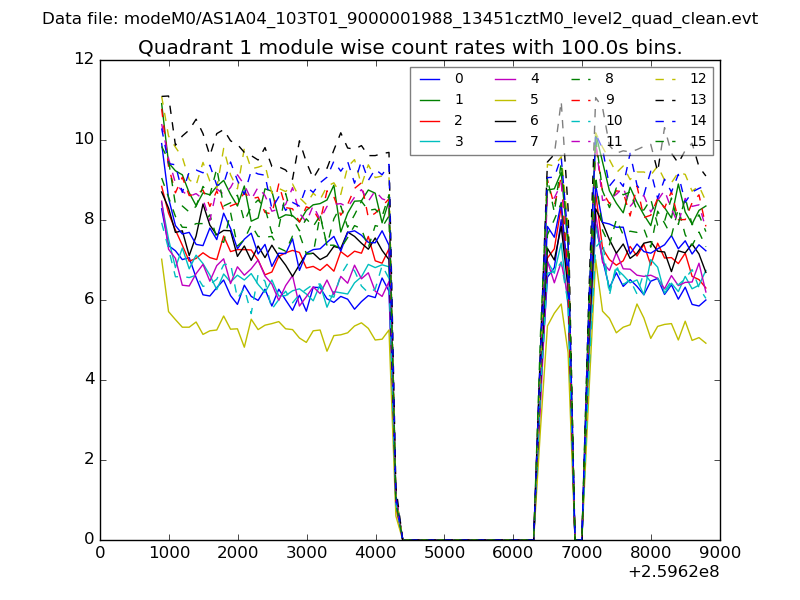
| Module-wise count rates for Quadrant A Data is divided into 100 sec bins |
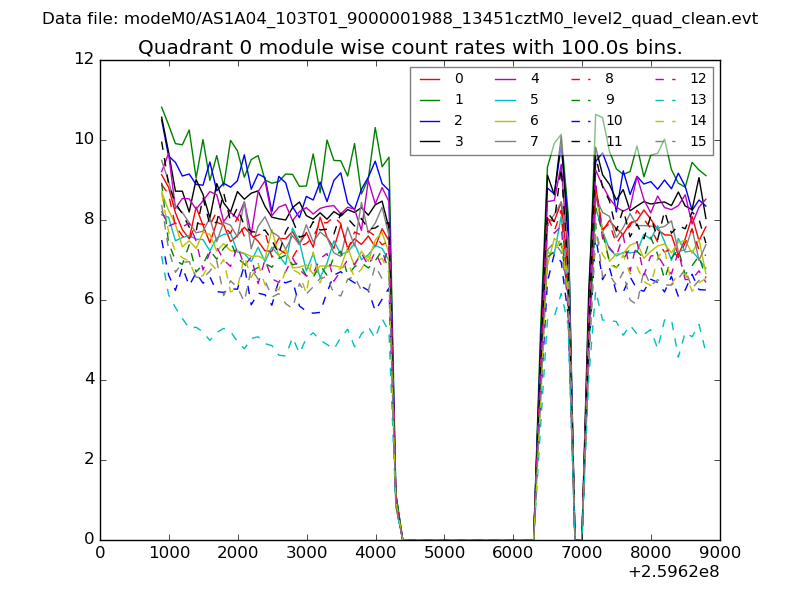 |
 |
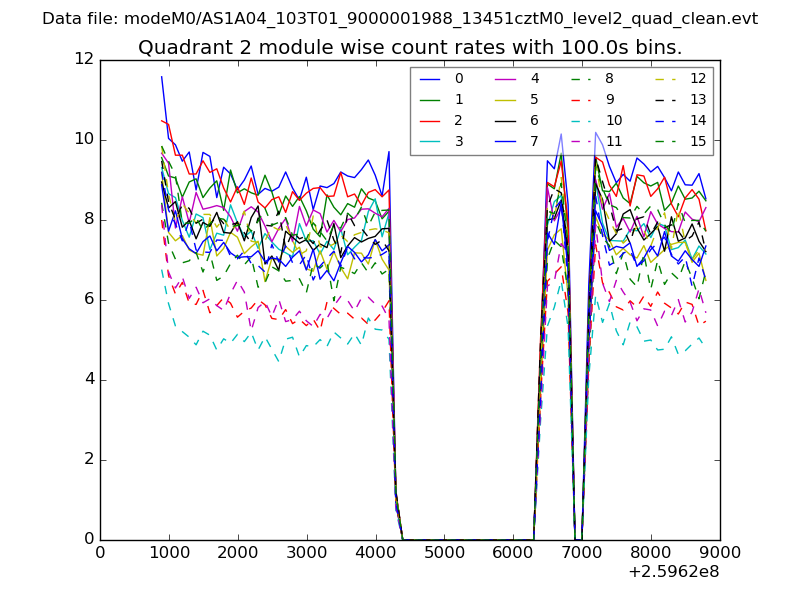
| Module-wise count rates for Quadrant B Data is divided into 100 sec bins |
 |
 |
| Module-wise count rates for Quadrant C Data is divided into 100 sec bins |
 |
 |
| Module-wise count rates for Quadrant D Data is divided into 100 sec bins |
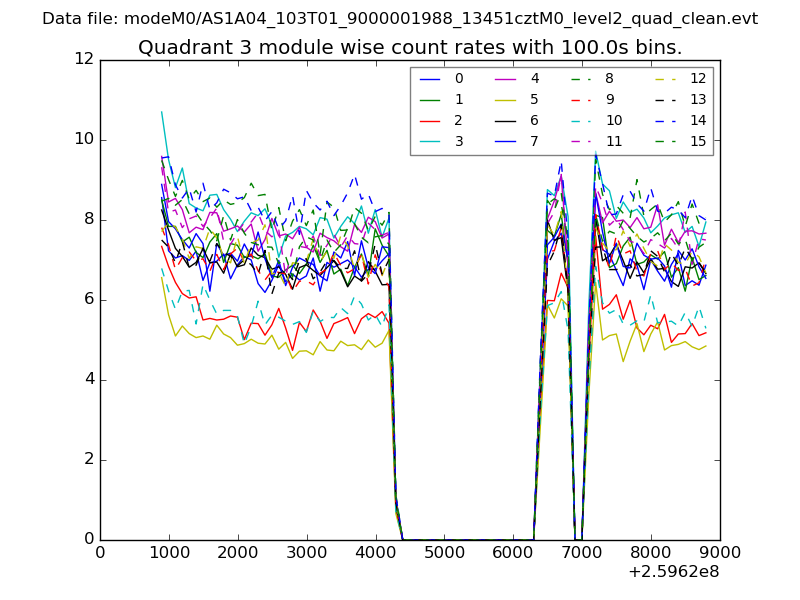 |
 |
| Parameter | Plot |
|---|---|
| CZT HV Monitor | 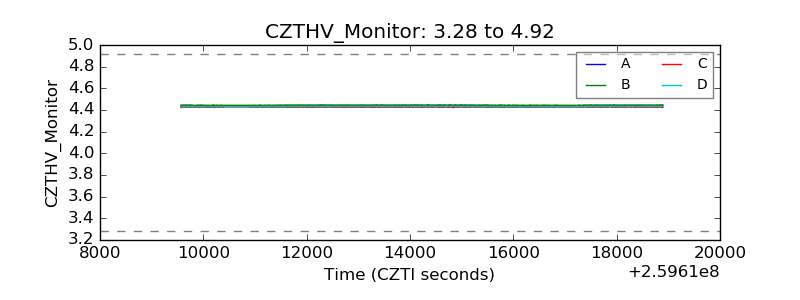 |
| D_VDD | 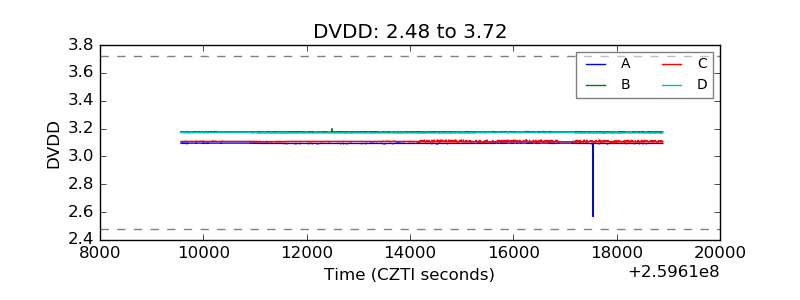 |
| Temperature 1 |  |
| Veto HV Monitor | 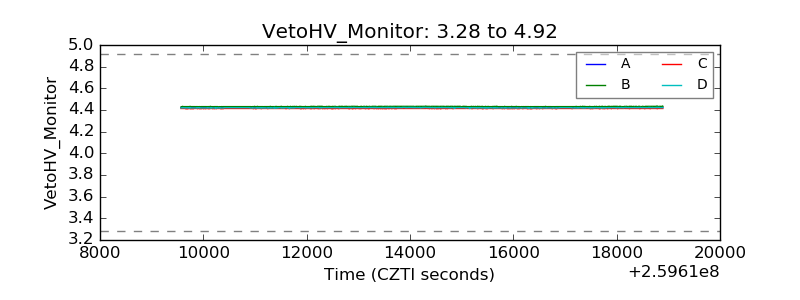 |
| Veto LLD | 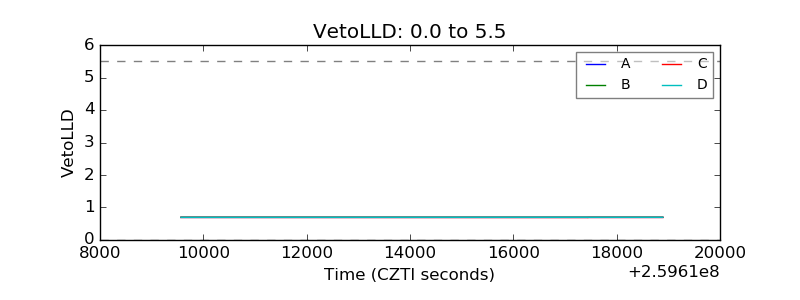 |
| Alpha Counter | 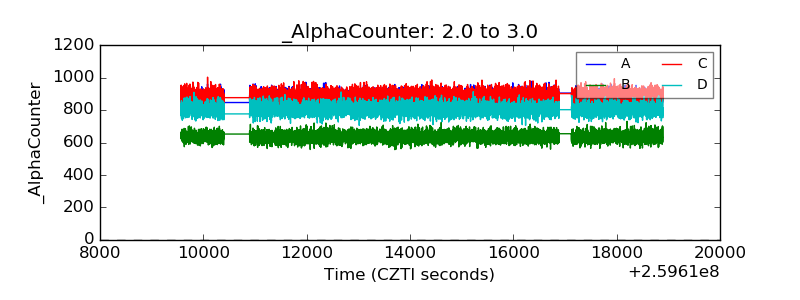 |
| _CPM_Rate | 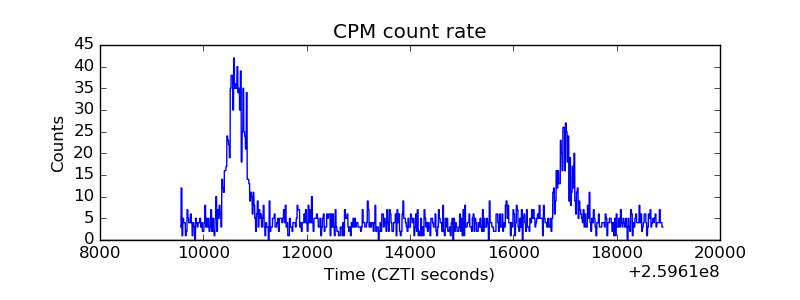 |
| CZT Counter |  |
| +2.5 Volts monitor | 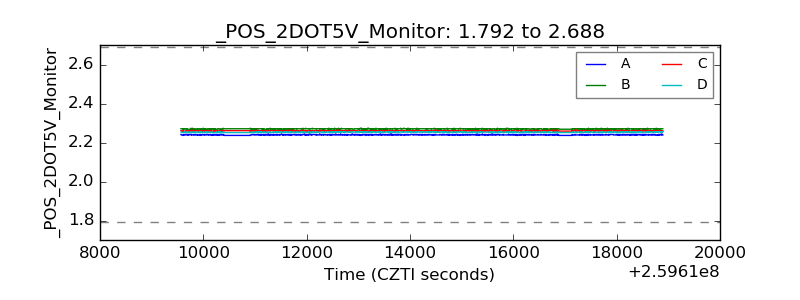 |
| +5 Volts monitor | 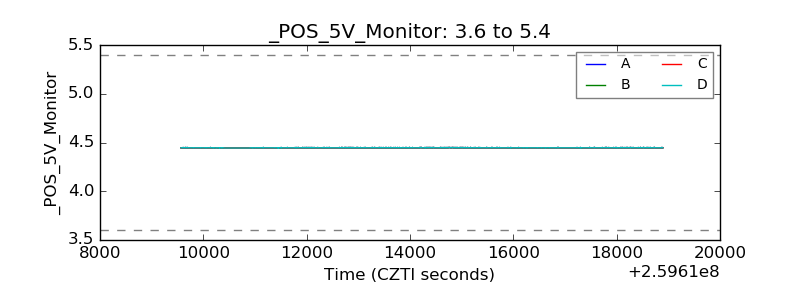 |
| _ROLL_ROT | 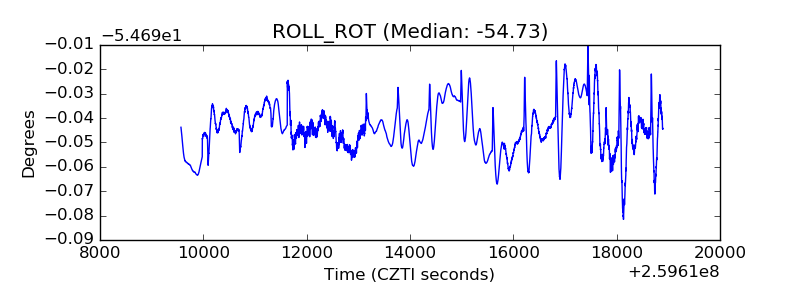 |
| _Roll_DEC | 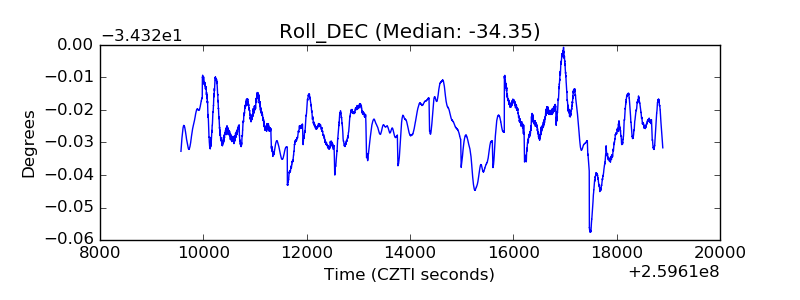 |
| _Roll_RA | 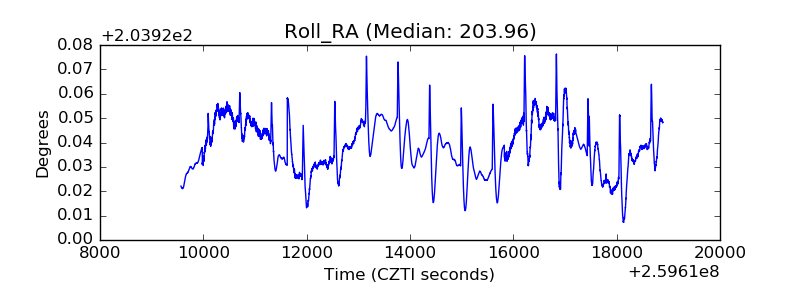 |
| Veto Counter | 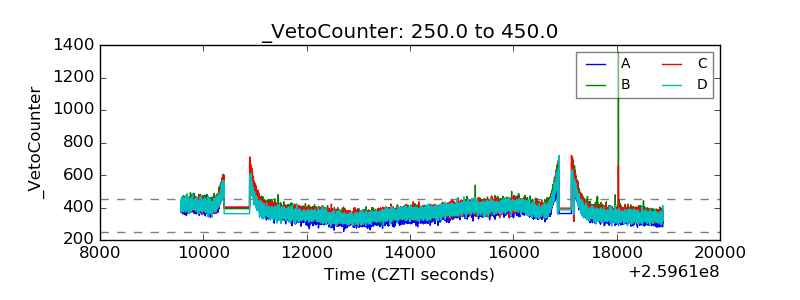 |