| Param | Original file | Final file |
|---|---|---|
| Filename | modeM0/AS1A04_103T01_9000001988_13454cztM0_level2.evt | modeM0/AS1A04_103T01_9000001988_13454cztM0_level2_quad_clean.evt |
| Size (bytes) | 857,594,880 | 174,300,480 |
| Size | 817.9 MB | 166.2 MB |
| Events in quadrant A | 6,020,311 | 1,101,118 |
| Events in quadrant B | 6,192,921 | 1,125,134 |
| Events in quadrant C | 6,687,483 | 1,093,800 |
| Events in quadrant D | 6,172,586 | 1,042,335 |
| Mode M0 | |||
|---|---|---|---|
| Quadrant | BADHDUFLAG | Total packets | Discarded packets |
| A | 0 | 26959 | 4 |
| B | 0 | 27219 | 3 |
| C | 0 | 28723 | 3 |
| D | 0 | 27993 | 3 |
| Mode SS | |||
|---|---|---|---|
| Quadrant | BADHDUFLAG | Total packets | Discarded packets |
| A | 0 | 270 | 0 |
| B | 0 | 270 | 0 |
| C | 0 | 270 | 0 |
| D | 0 | 270 | 0 |
| Mode M9 | |||
|---|---|---|---|
| Quadrant | BADHDUFLAG | Total packets | Discarded packets |
| A | 0 | 15 | 0 |
| B | 0 | 15 | 0 |
| C | 0 | 15 | 0 |
| D | 0 | 15 | 0 |
| Quadrant | Total seconds | Saturated seconds | Saturation percentage |
|---|---|---|---|
| A | 13265 | 53 | 0.399548% |
| B | 13265 | 99 | 0.746325% |
| C | 13265 | 238 | 1.794195% |
| D | 13265 | 102 | 0.768941% |
Noise dominated data is calculated using 1-second bins in cleaned event files. If a bin has >2000 counts, and if more than 50% of those come from <1% of pixels, then it is considered to be noise-dominated and hence unusable.
| Quadrant | # 1 sec bins | Bins with >0 counts | Bins with >2000 counts | High rate bins dominated by noise | Noise dominated (total time) | Noise dominated (detector-on time) | Marked lightcurve |
|---|---|---|---|---|---|---|---|
| A | 14806 | 13267 | 1 | 1 | 0.01% | 0.01% | 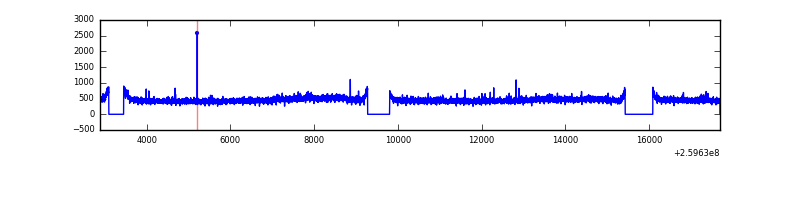 |
| B | 14806 | 13268 | 4 | 4 | 0.03% | 0.03% | 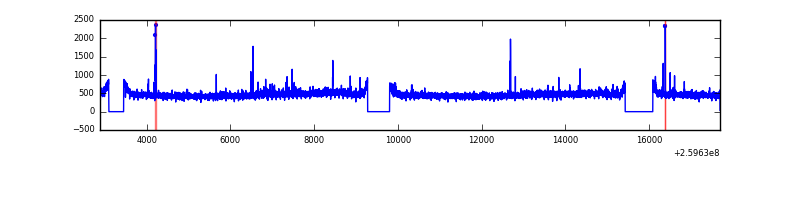 |
| C | 14806 | 13267 | 153 | 153 | 1.03% | 1.15% | 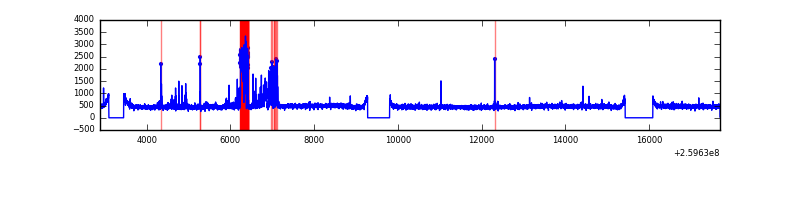 |
| D | 14806 | 13267 | 47 | 47 | 0.32% | 0.35% | 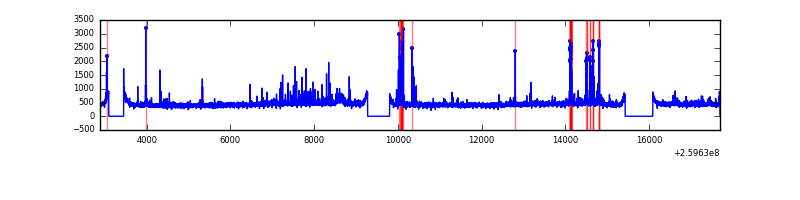 |
Top three noisy pixels from each quadrant. If the there are fewer than three noisy pixels in the level2.evt file, extra rows are filled as -1
| Pixel properties | Quadrant properties | ||||||
|---|---|---|---|---|---|---|---|
| Quadrant | DetID | PixID | Counts | Sigma | Mean | Median | Sigma |
| A | 1 | 162 | 25809 | 76.92 | 1553 | 1519 | 315.8 |
| A | 0 | 226 | 13653 | 38.43 | 1553 | 1519 | 315.8 |
| A | 12 | 194 | 11755 | 32.42 | 1553 | 1519 | 315.8 |
| B | 0 | 214 | 55123 | 181.27 | 1553 | 1513 | 295.8 |
| B | 12 | 111 | 35770 | 115.83 | 1553 | 1513 | 295.8 |
| B | 3 | 209 | 32643 | 105.26 | 1553 | 1513 | 295.8 |
| C | 10 | 9 | 654733 | 1869.82 | 1511 | 1518 | 349.3 |
| C | 3 | 233 | 121151 | 342.45 | 1511 | 1518 | 349.3 |
| C | 14 | 234 | 12685 | 31.97 | 1511 | 1518 | 349.3 |
| D | 13 | 249 | 323454 | 897.8 | 1499 | 1453 | 358.7 |
| D | 8 | 195 | 81921 | 224.36 | 1499 | 1453 | 358.7 |
| D | 2 | 234 | 49343 | 133.52 | 1499 | 1453 | 358.7 |
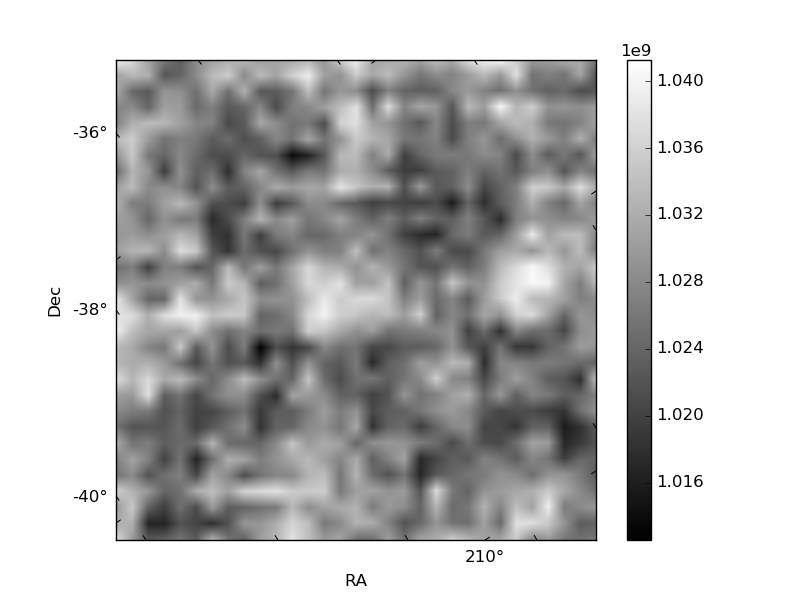
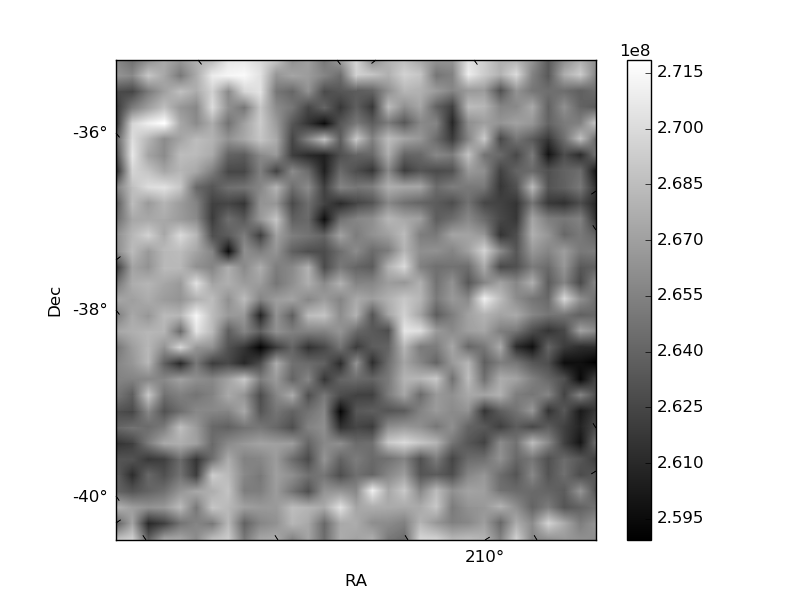
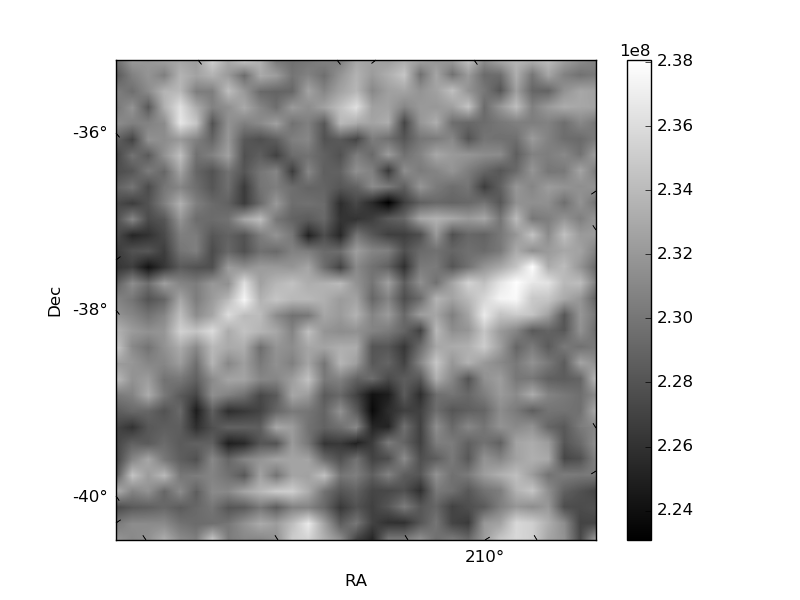
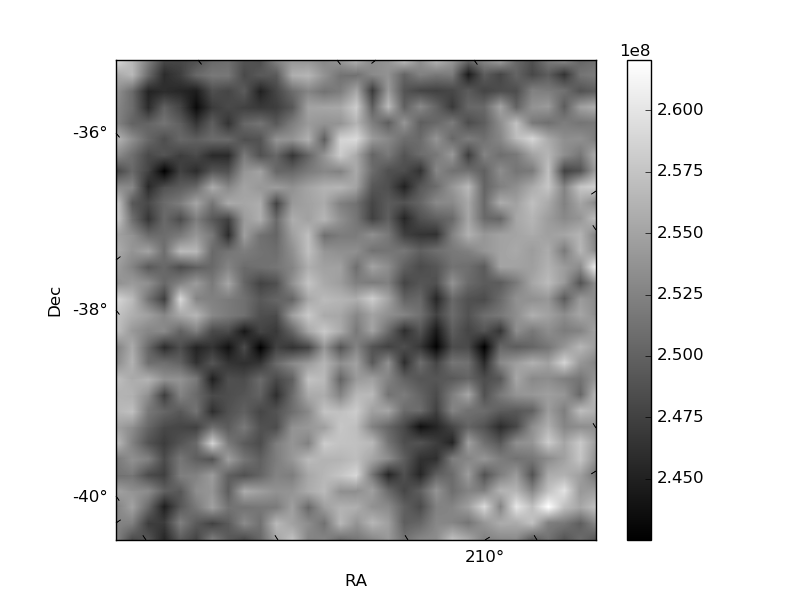
Histogram calculated using DETX and DETY for each event in the final _common_clean file
| Quadrant A | 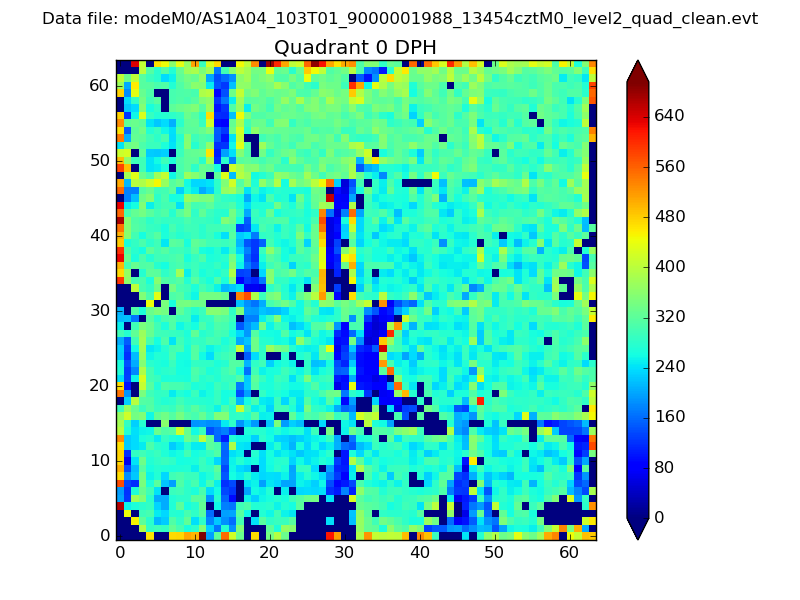 |
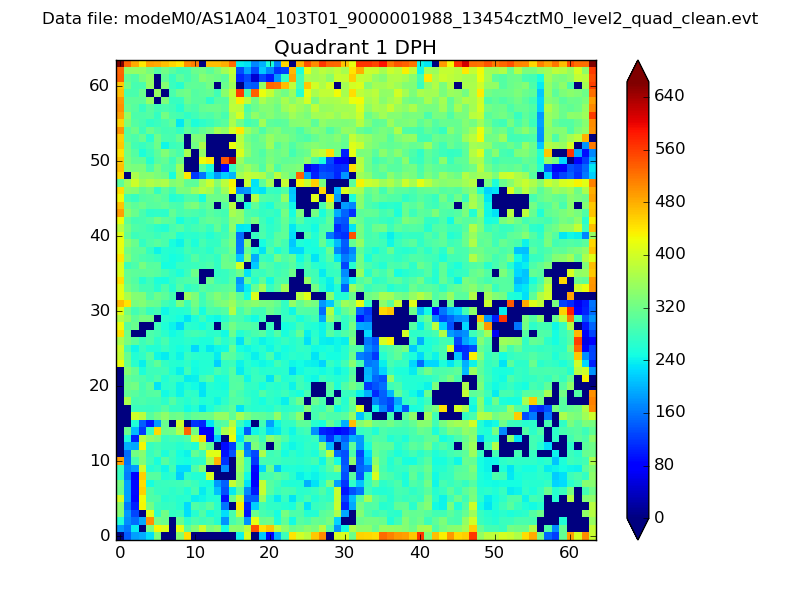 |
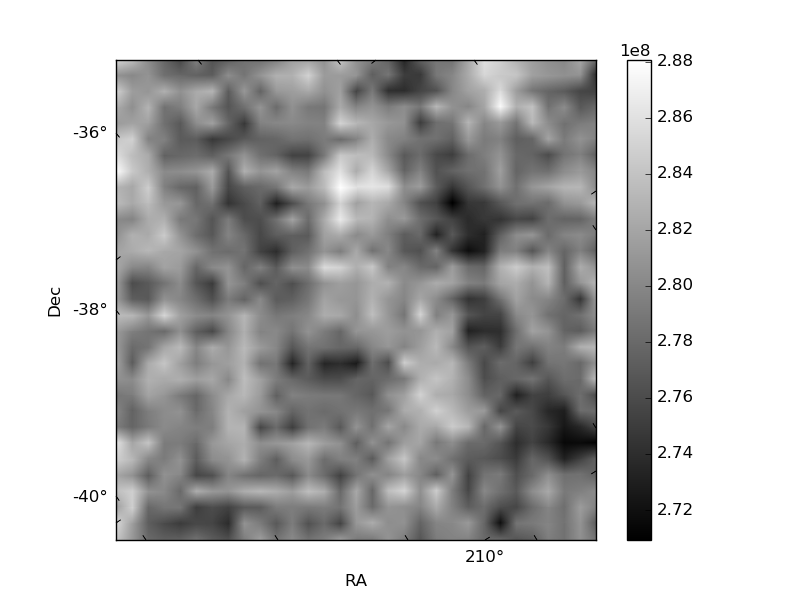
Quadrant B |
|---|---|---|---|
| Quadrant D | 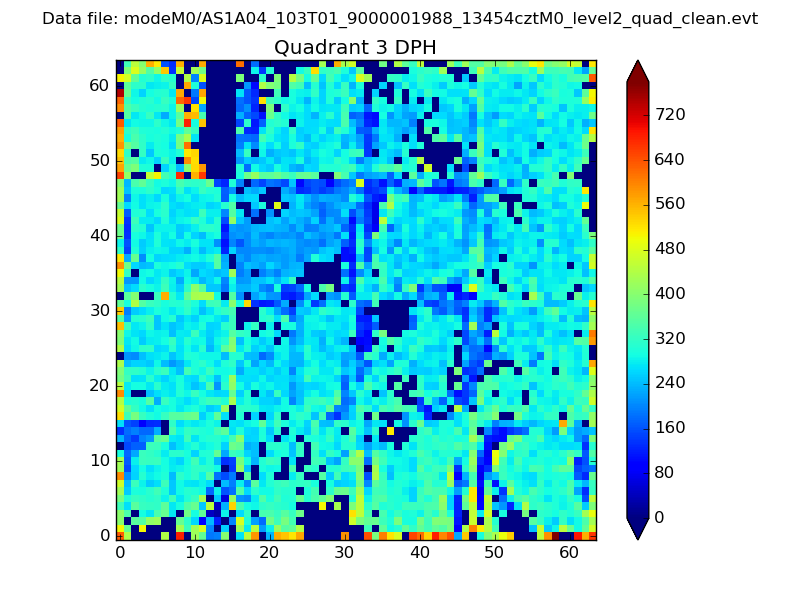 |
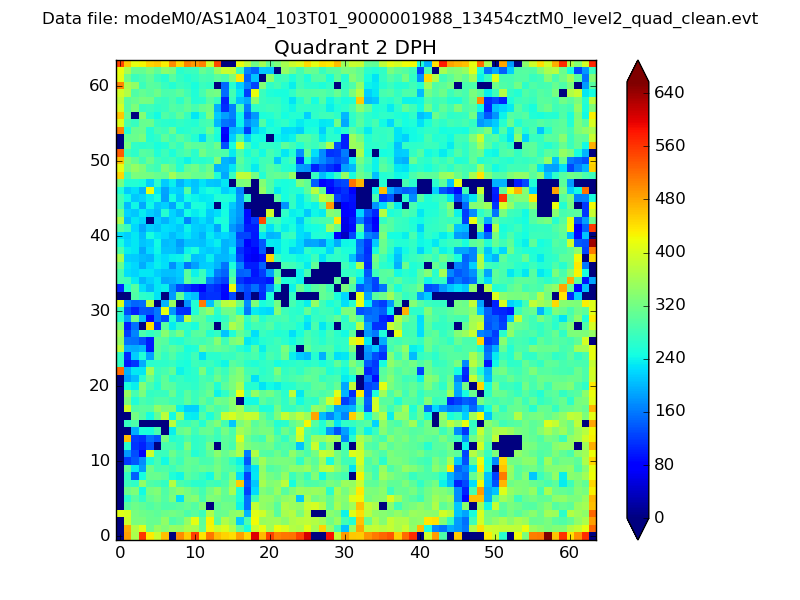 |
Quadrant C |
| Plot type | Count rate plots | Images |
|---|---|---|
| Comparison with Poisson distribution Blue bars denote a histogram of data divided into 1 sec bins. Red curve is a Poisson curve with rate = median count rate of data. |
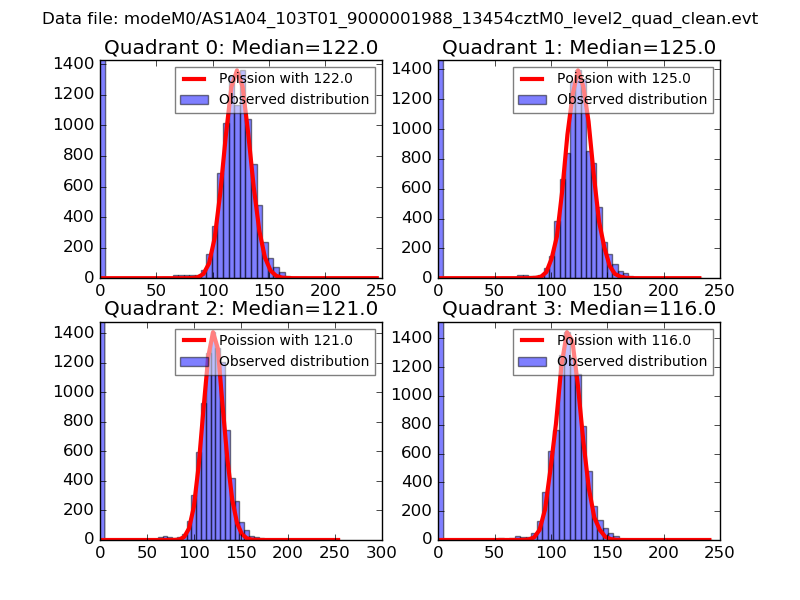 |
 |
| Quadrant-wise count rates Data is divided into 100 sec bins |
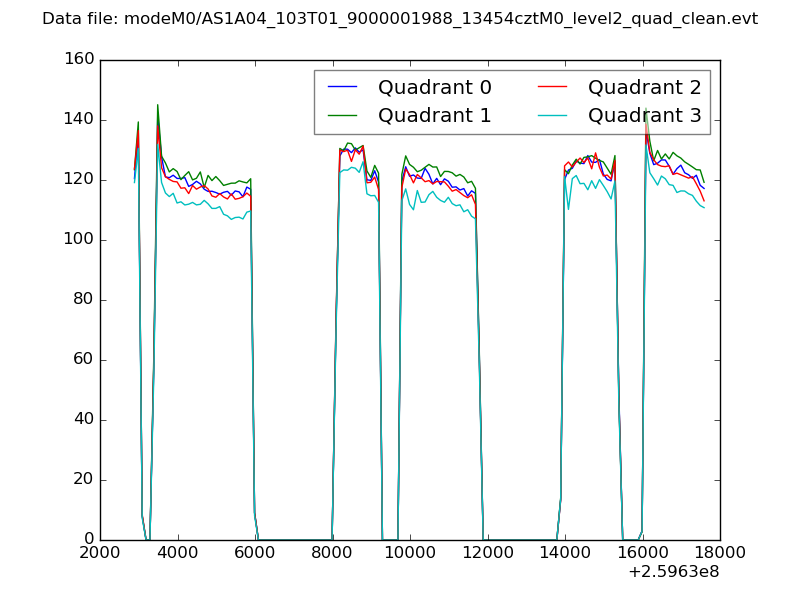 |
|
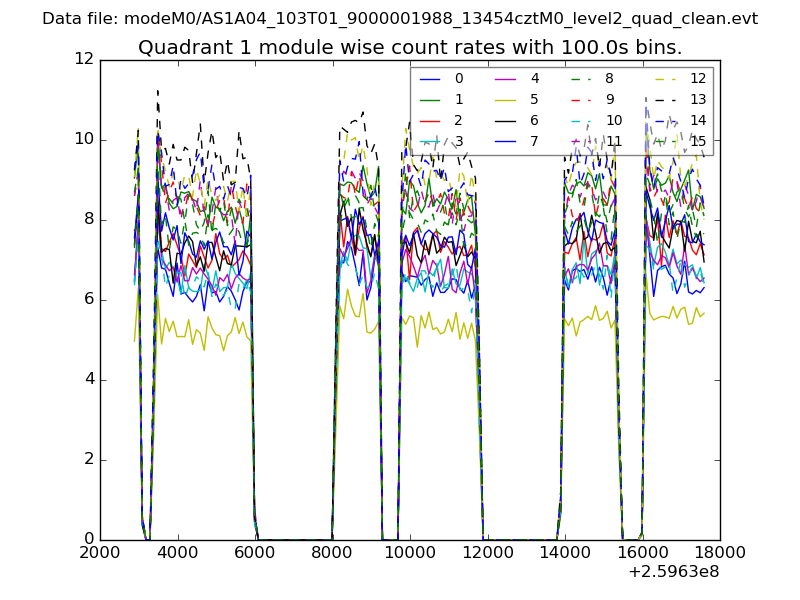
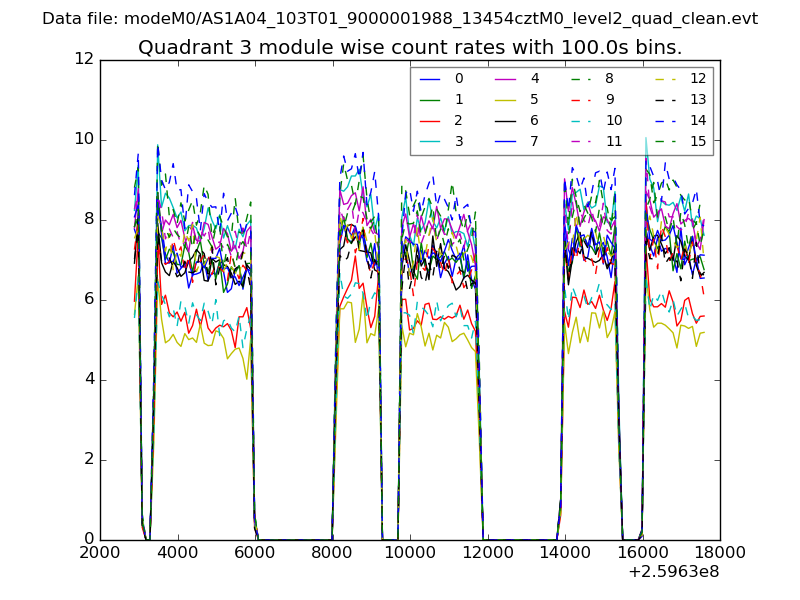
| Module-wise count rates for Quadrant A Data is divided into 100 sec bins |
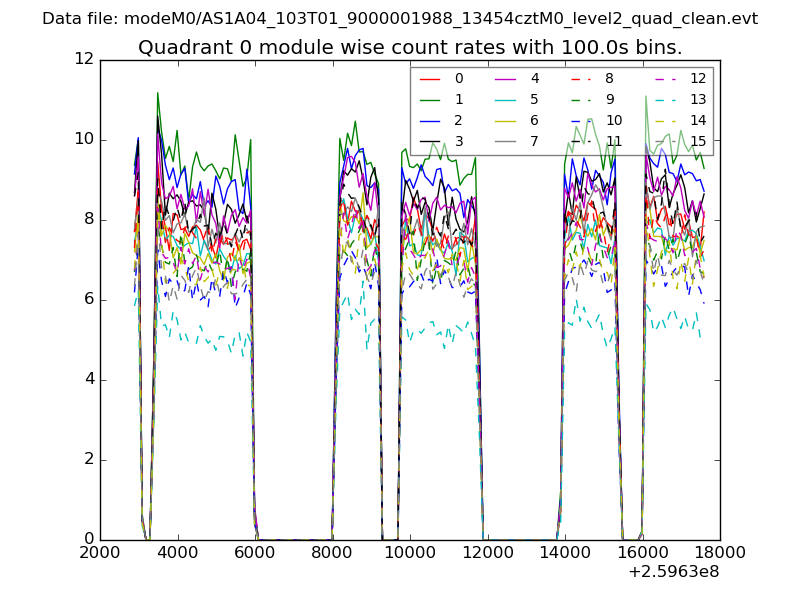 |
 |
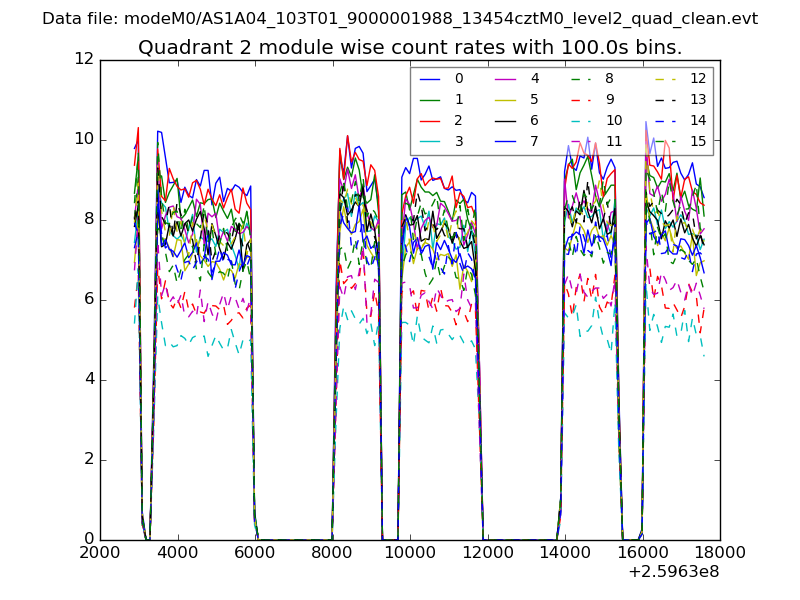
| Module-wise count rates for Quadrant B Data is divided into 100 sec bins |
 |
 |
| Module-wise count rates for Quadrant C Data is divided into 100 sec bins |
 |
 |
| Module-wise count rates for Quadrant D Data is divided into 100 sec bins |
 |
 |
| Parameter | Plot |
|---|---|
| CZT HV Monitor | 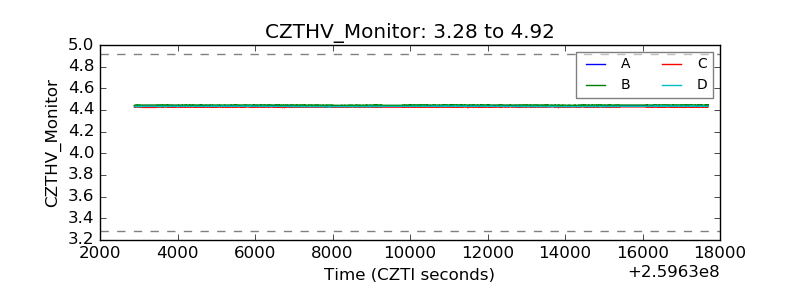 |
| D_VDD |  |
| Temperature 1 | 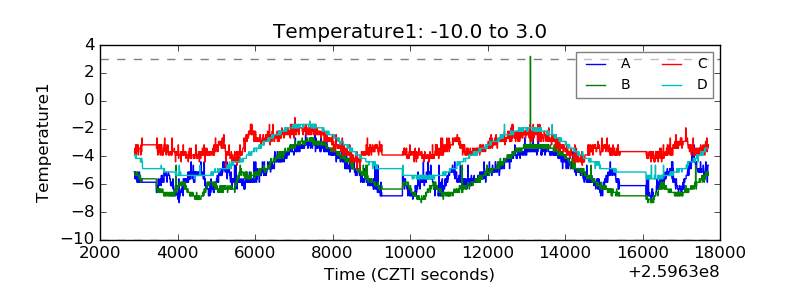 |
| Veto HV Monitor | 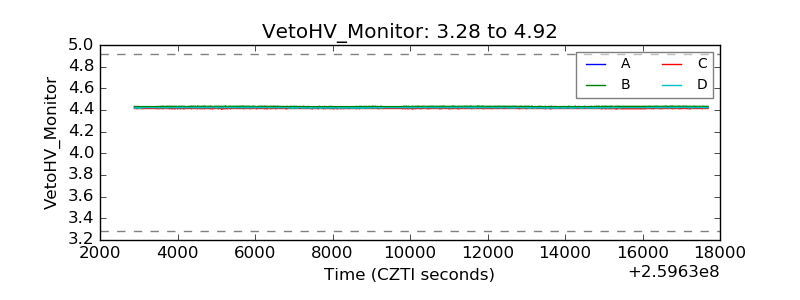 |
| Veto LLD |  |
| Alpha Counter | 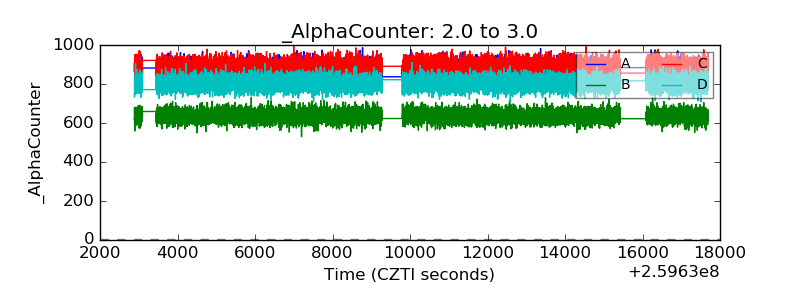 |
| _CPM_Rate | 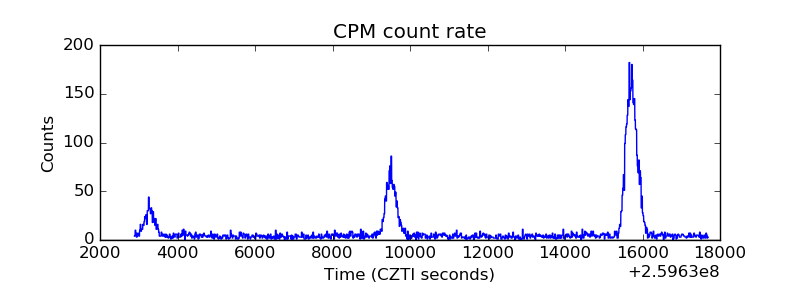 |
| CZT Counter | 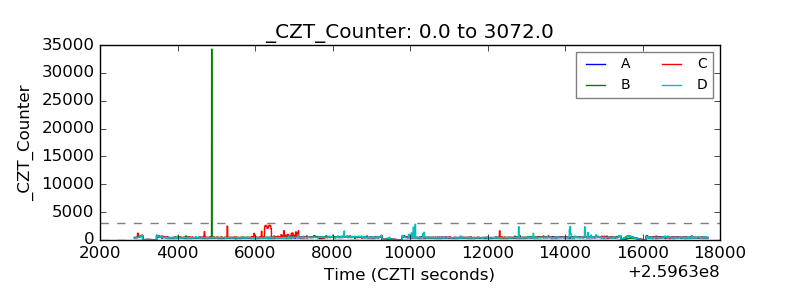 |
| +2.5 Volts monitor | 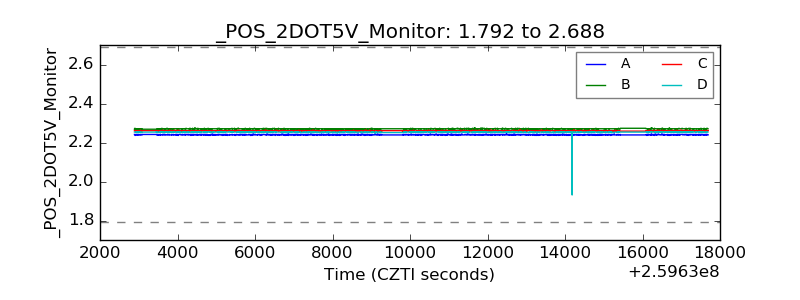 |
| +5 Volts monitor |  |
| _ROLL_ROT | 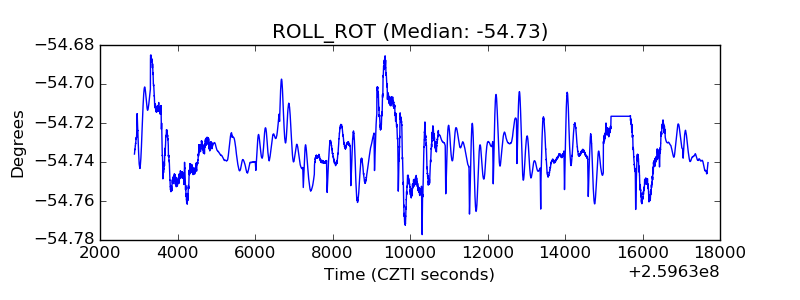 |
| _Roll_DEC | 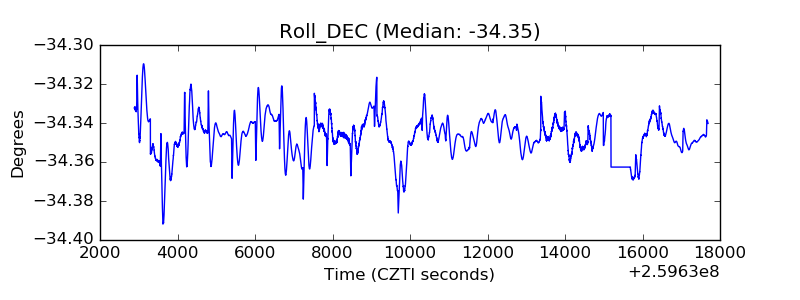 |
| _Roll_RA | 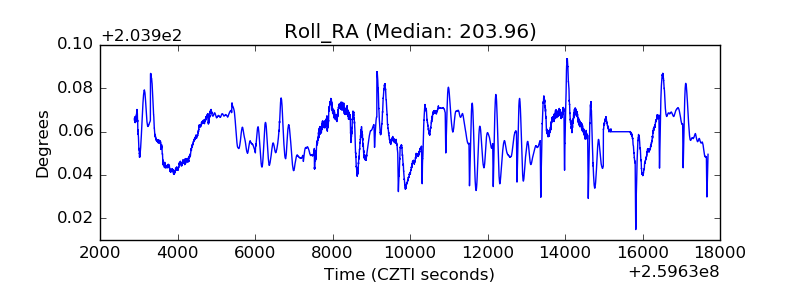 |
| Veto Counter | 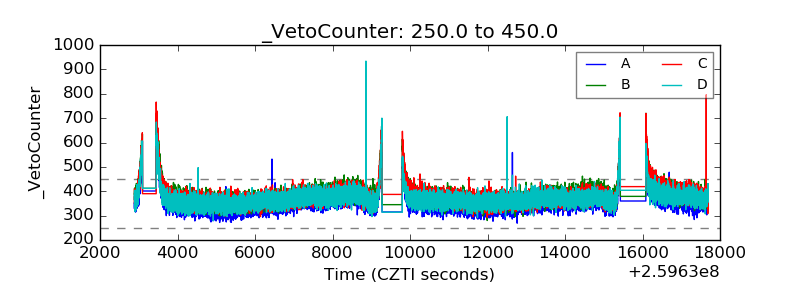 |