| Param | Original file | Final file |
|---|---|---|
| Filename | modeM0/AS1A04_103T01_9000001988_13456cztM0_level2.evt | modeM0/AS1A04_103T01_9000001988_13456cztM0_level2_quad_clean.evt |
| Size (bytes) | 450,633,600 | 82,630,080 |
| Size | 429.8 MB | 78.8 MB |
| Events in quadrant A | 3,115,604 | 513,532 |
| Events in quadrant B | 3,592,012 | 521,893 |
| Events in quadrant C | 3,156,807 | 513,330 |
| Events in quadrant D | 3,329,044 | 487,815 |
| Mode M0 | |||
|---|---|---|---|
| Quadrant | BADHDUFLAG | Total packets | Discarded packets |
| A | 0 | 13637 | 3 |
| B | 0 | 14863 | 2 |
| C | 0 | 13709 | 2 |
| D | 0 | 14474 | 2 |
| Mode SS | |||
|---|---|---|---|
| Quadrant | BADHDUFLAG | Total packets | Discarded packets |
| A | 0 | 138 | 0 |
| B | 0 | 138 | 0 |
| C | 0 | 138 | 0 |
| D | 0 | 138 | 0 |
| Mode M9 | |||
|---|---|---|---|
| Quadrant | BADHDUFLAG | Total packets | Discarded packets |
| A | 0 | 9 | 0 |
| B | 0 | 9 | 0 |
| C | 0 | 9 | 0 |
| D | 0 | 9 | 0 |
| Quadrant | Total seconds | Saturated seconds | Saturation percentage |
|---|---|---|---|
| A | 6670 | 55 | 0.824588% |
| B | 6670 | 226 | 3.388306% |
| C | 6670 | 49 | 0.734633% |
| D | 6671 | 81 | 1.214211% |
Noise dominated data is calculated using 1-second bins in cleaned event files. If a bin has >2000 counts, and if more than 50% of those come from <1% of pixels, then it is considered to be noise-dominated and hence unusable.
| Quadrant | # 1 sec bins | Bins with >0 counts | Bins with >2000 counts | High rate bins dominated by noise | Noise dominated (total time) | Noise dominated (detector-on time) | Marked lightcurve |
|---|---|---|---|---|---|---|---|
| A | 7646 | 6671 | 0 | 0 | 0.00% | 0.00% | 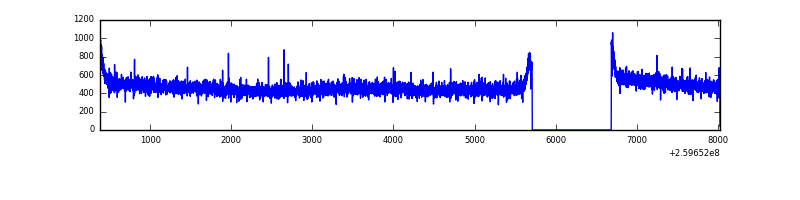 |
| B | 7646 | 6671 | 163 | 163 | 2.13% | 2.44% | 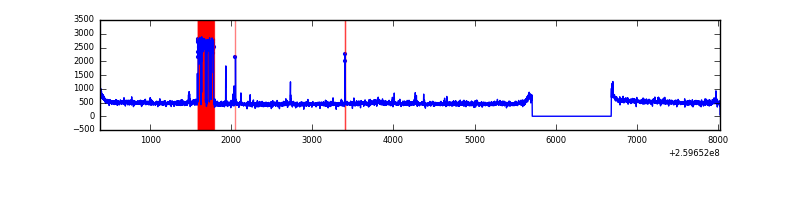 |
| C | 7646 | 6671 | 0 | 0 | 0.00% | 0.00% | 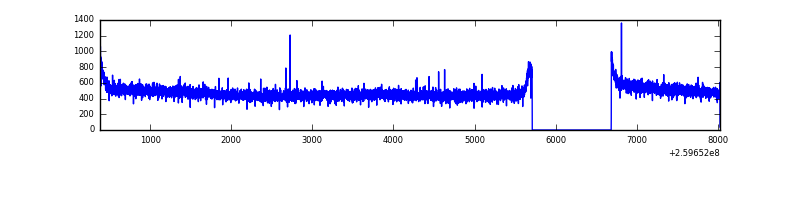 |
| D | 7647 | 6672 | 33 | 33 | 0.43% | 0.49% | 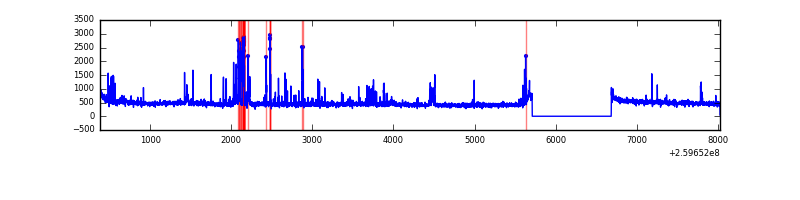 |
Top three noisy pixels from each quadrant. If the there are fewer than three noisy pixels in the level2.evt file, extra rows are filled as -1
| Pixel properties | Quadrant properties | ||||||
|---|---|---|---|---|---|---|---|
| Quadrant | DetID | PixID | Counts | Sigma | Mean | Median | Sigma |
| A | 0 | 226 | 7148 | 38.76 | 807 | 789 | 164.1 |
| A | 1 | 162 | 6623 | 35.56 | 807 | 789 | 164.1 |
| A | 12 | 194 | 6131 | 32.56 | 807 | 789 | 164.1 |
| B | 3 | 64 | 432518 | 2845.72 | 794 | 773 | 151.7 |
| B | 0 | 214 | 25763 | 164.71 | 794 | 773 | 151.7 |
| B | 3 | 209 | 22230 | 141.43 | 794 | 773 | 151.7 |
| C | 3 | 233 | 58304 | 312.08 | 794 | 798 | 184.3 |
| C | 13 | 61 | 5601 | 26.07 | 794 | 798 | 184.3 |
| C | 14 | 234 | 3272 | 13.43 | 794 | 798 | 184.3 |
| D | 13 | 104 | 159830 | 845.84 | 786 | 763 | 188.1 |
| D | 12 | 110 | 76068 | 400.43 | 786 | 763 | 188.1 |
| D | 8 | 195 | 60290 | 316.53 | 786 | 763 | 188.1 |
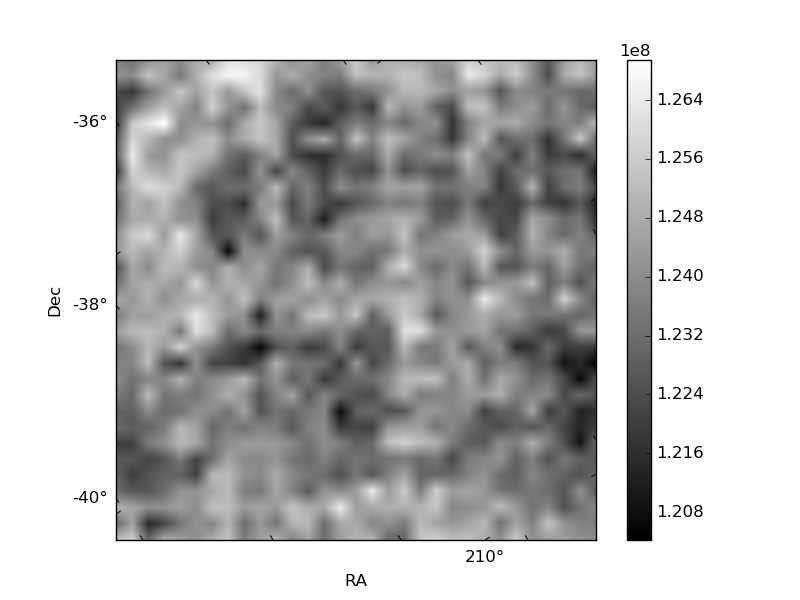
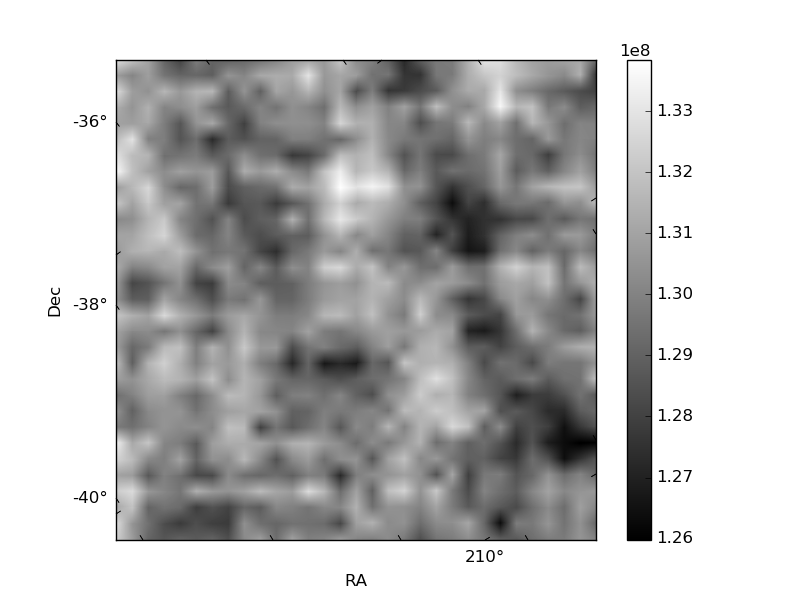
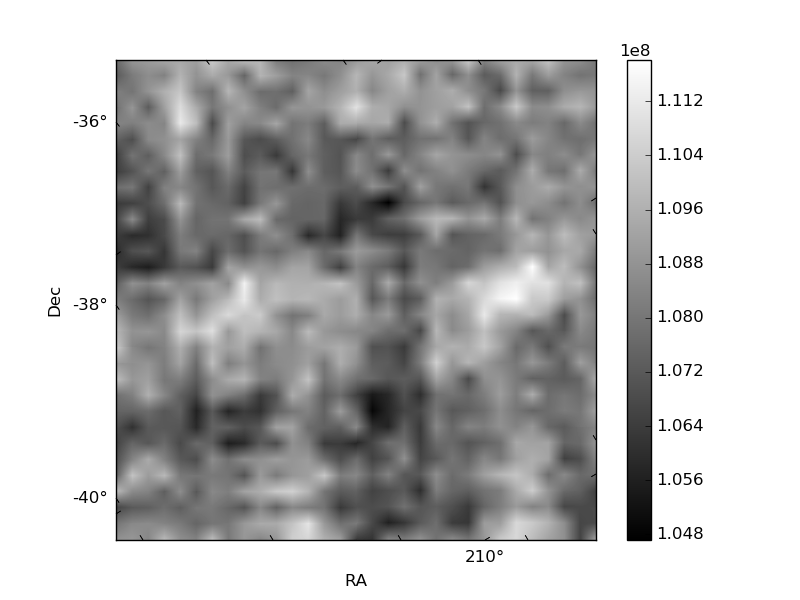
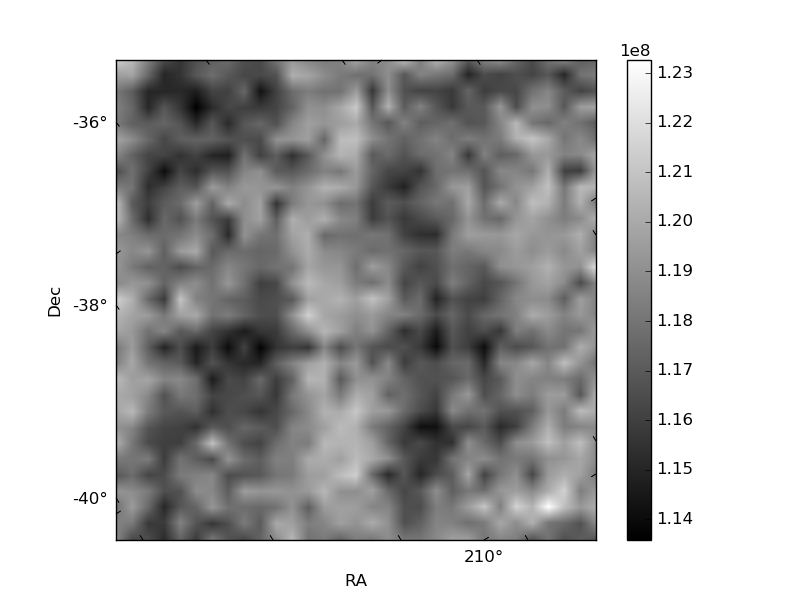
Histogram calculated using DETX and DETY for each event in the final _common_clean file
| Quadrant A | 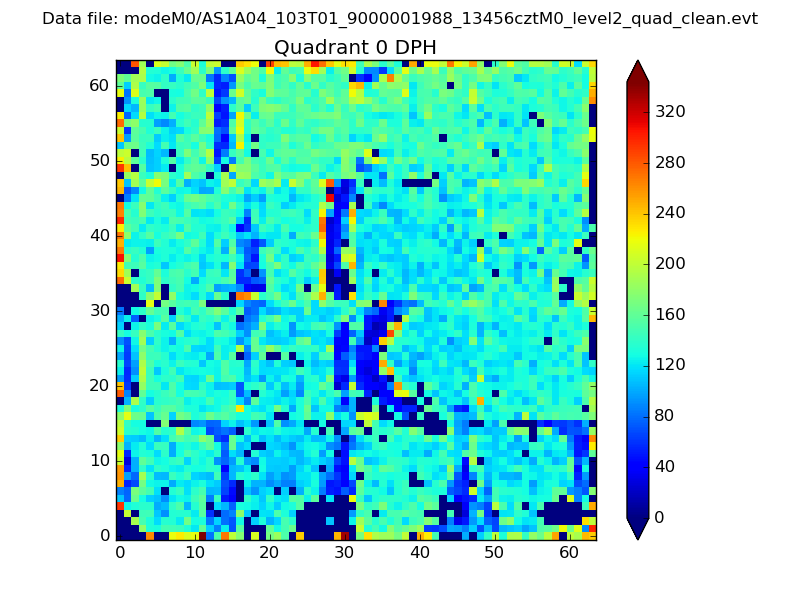 |
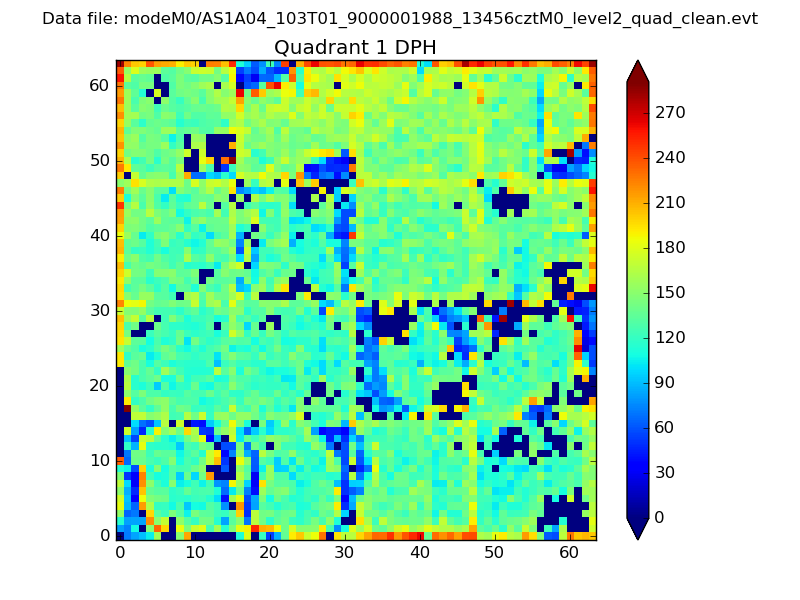 |
Quadrant B |
|---|---|---|---|
| Quadrant D | 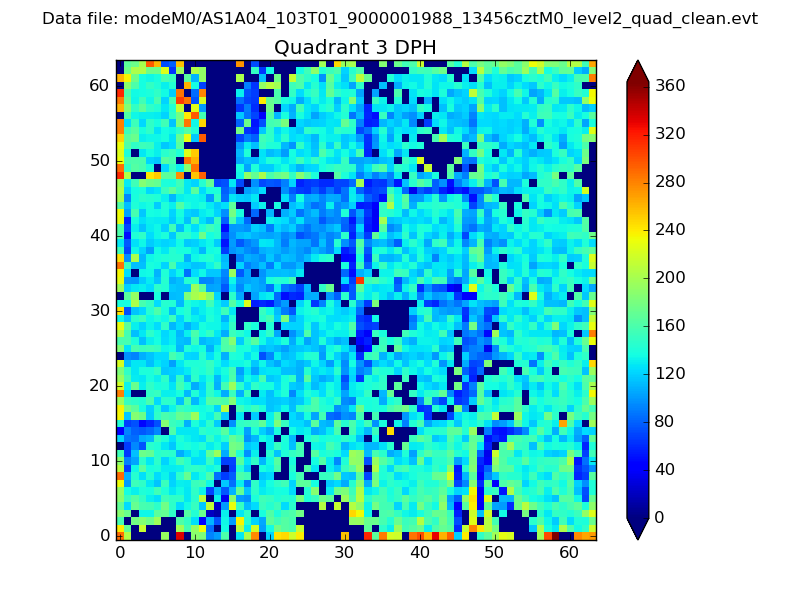 |
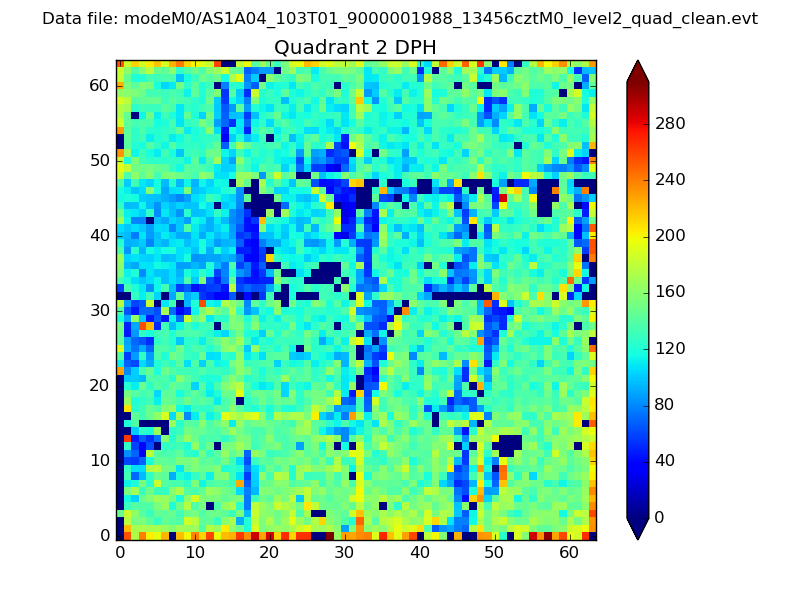 |
Quadrant C |
| Plot type | Count rate plots | Images |
|---|---|---|
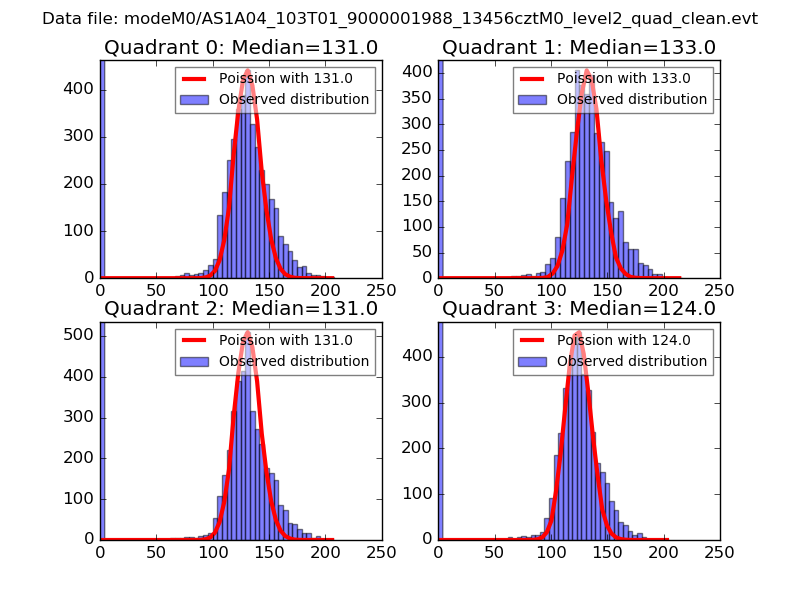
| Comparison with Poisson distribution Blue bars denote a histogram of data divided into 1 sec bins. Red curve is a Poisson curve with rate = median count rate of data. |
 |
 |
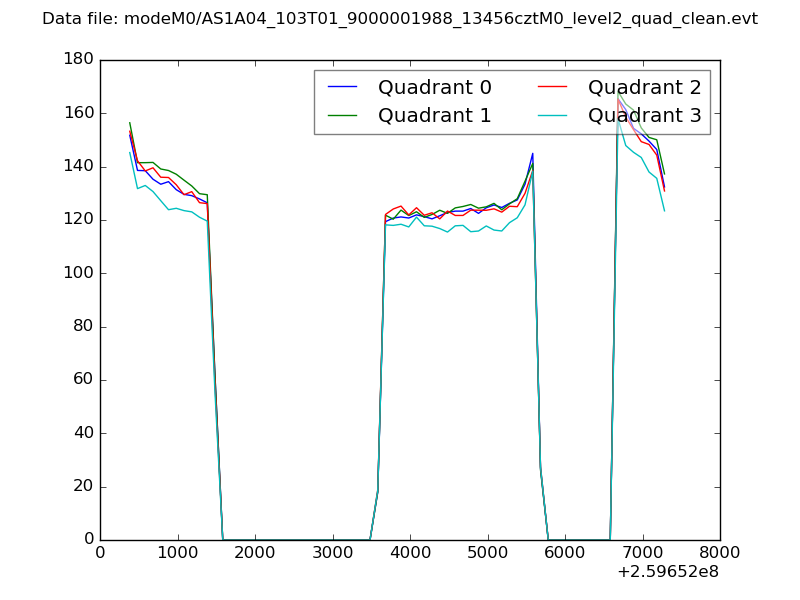
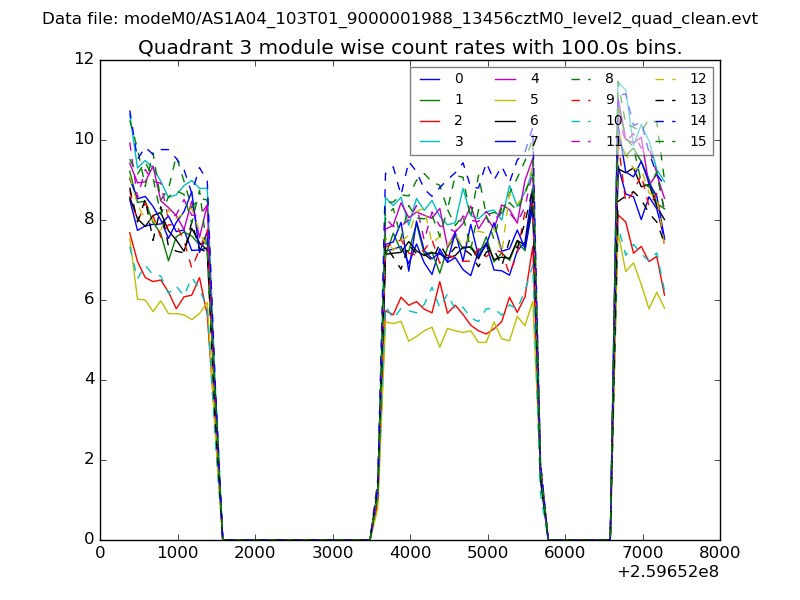
| Quadrant-wise count rates Data is divided into 100 sec bins |
 |
|
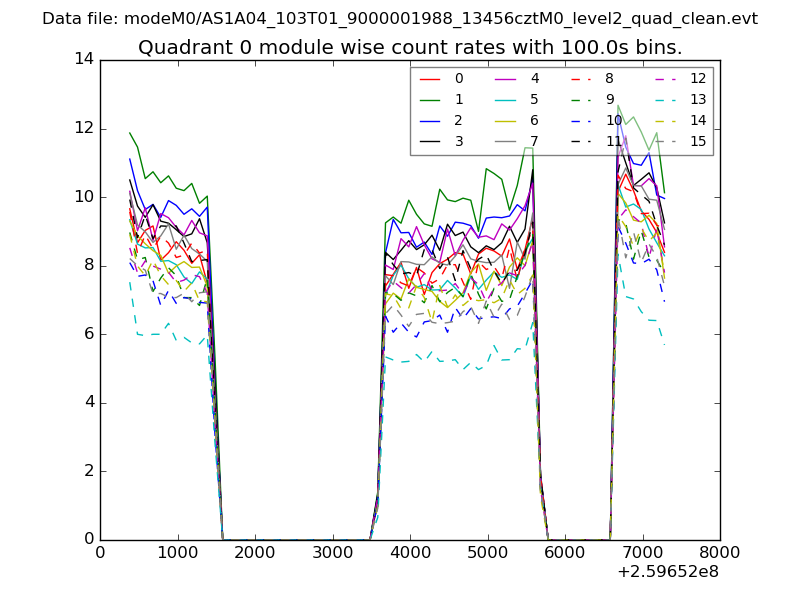
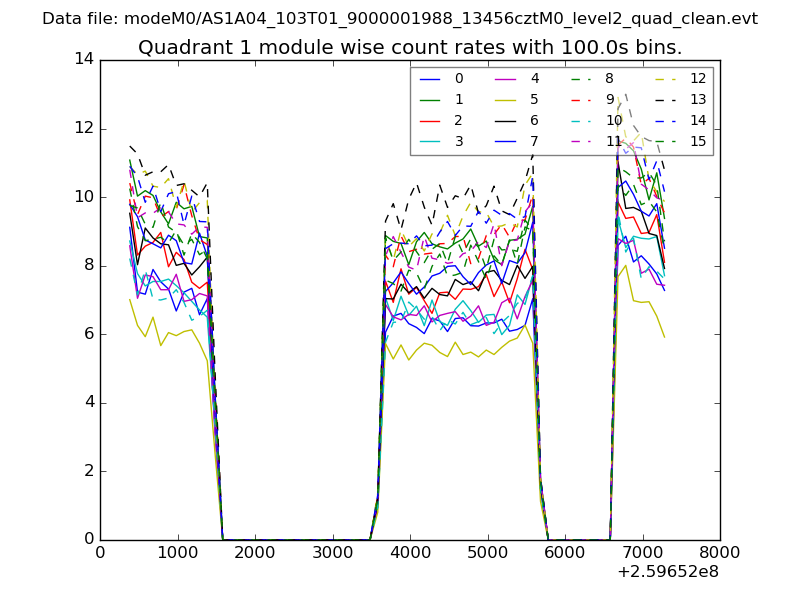
| Module-wise count rates for Quadrant A Data is divided into 100 sec bins |
 |
 |
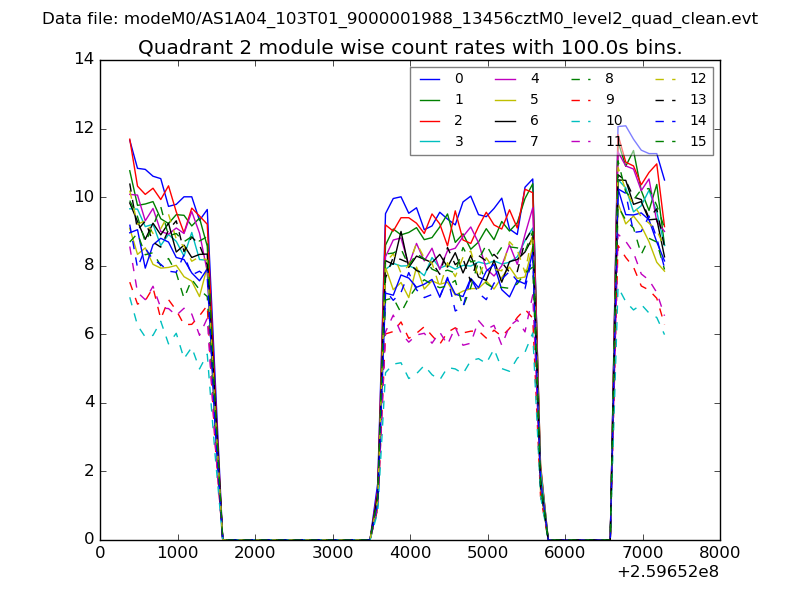
| Module-wise count rates for Quadrant B Data is divided into 100 sec bins |
 |
 |
| Module-wise count rates for Quadrant C Data is divided into 100 sec bins |
 |
 |
| Module-wise count rates for Quadrant D Data is divided into 100 sec bins |
 |
 |
| Parameter | Plot |
|---|---|
| CZT HV Monitor | 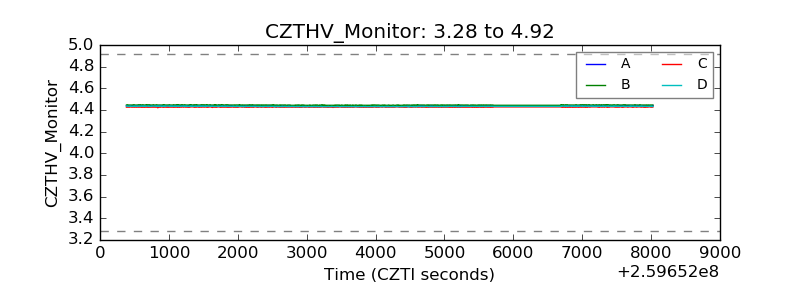 |
| D_VDD | 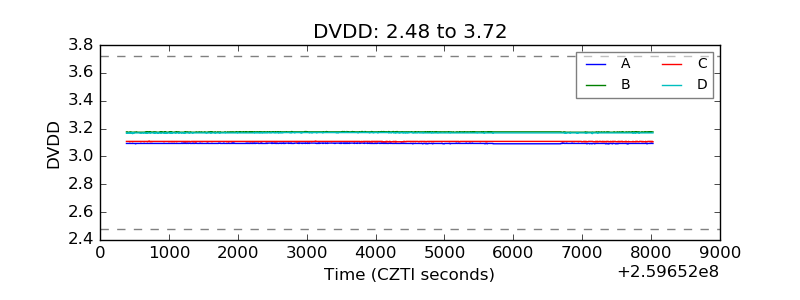 |
| Temperature 1 | 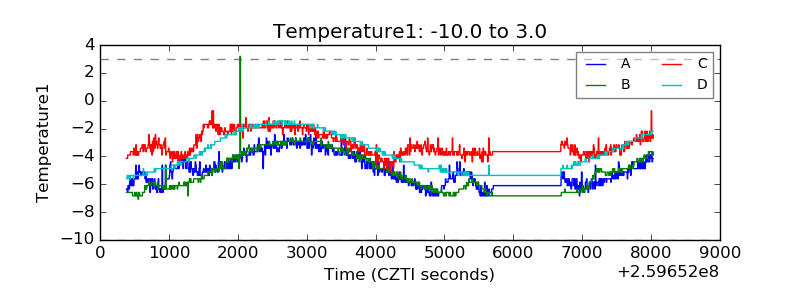 |
| Veto HV Monitor | 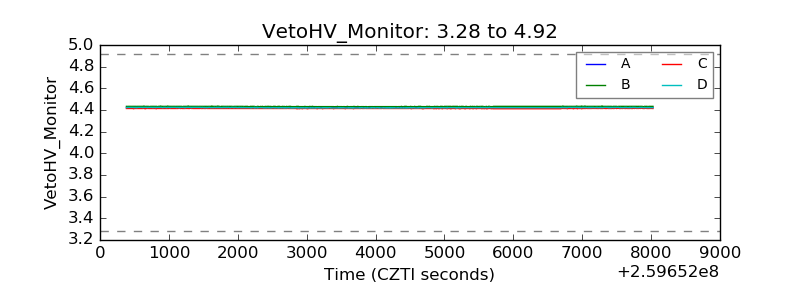 |
| Veto LLD | 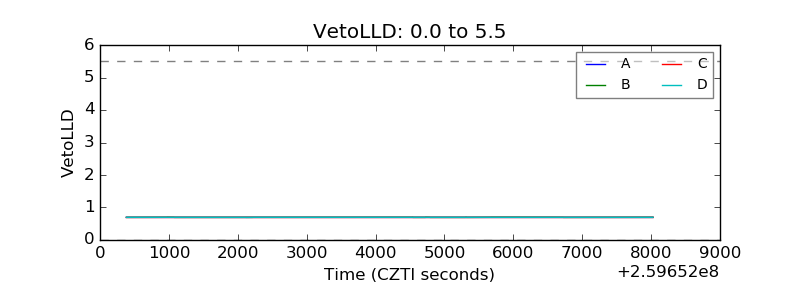 |
| Alpha Counter | 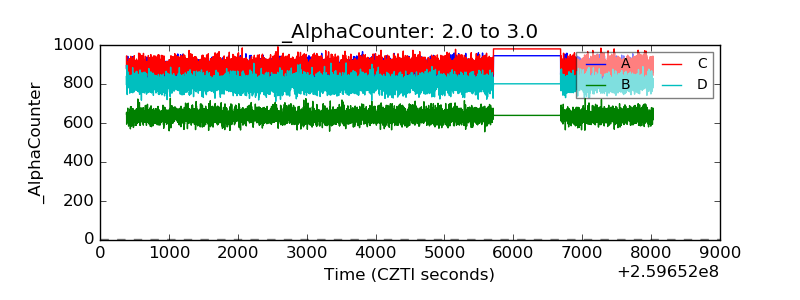 |
| _CPM_Rate | 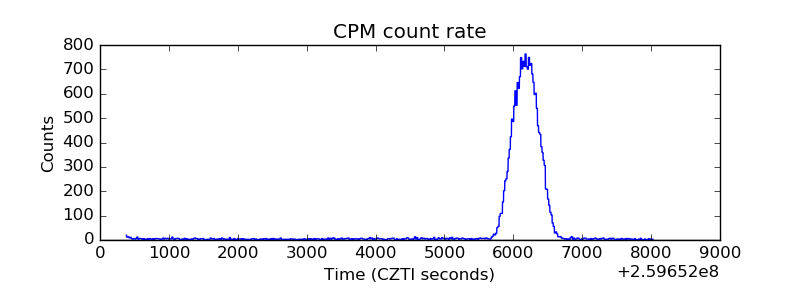 |
| CZT Counter | 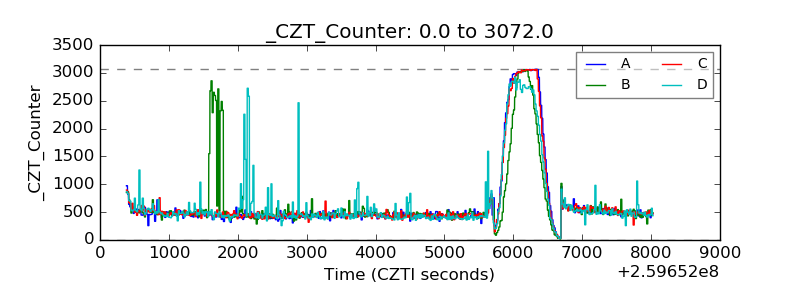 |
| +2.5 Volts monitor | 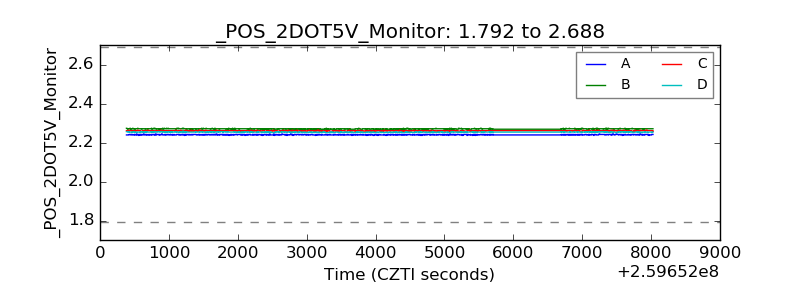 |
| +5 Volts monitor | 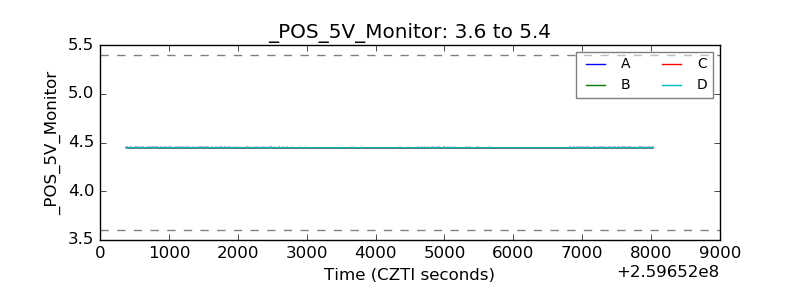 |
| _ROLL_ROT | 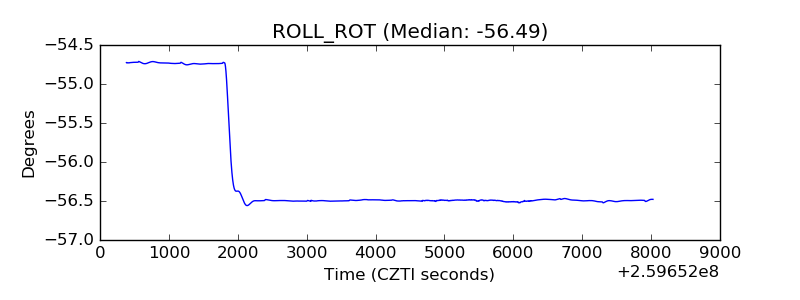 |
| _Roll_DEC | 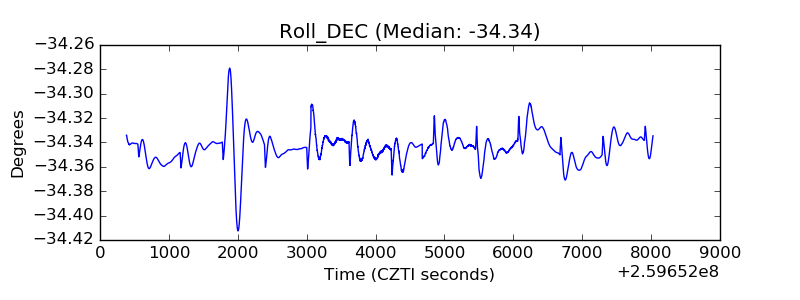 |
| _Roll_RA | 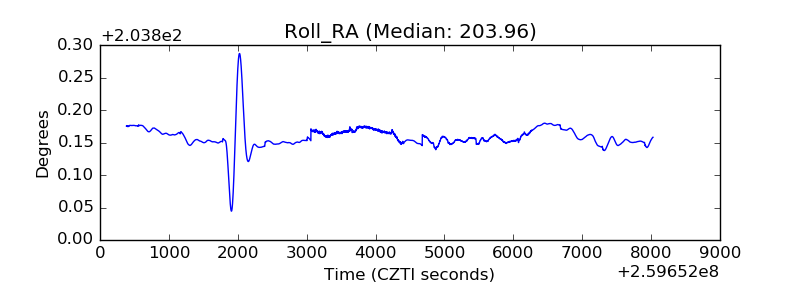 |
| Veto Counter | 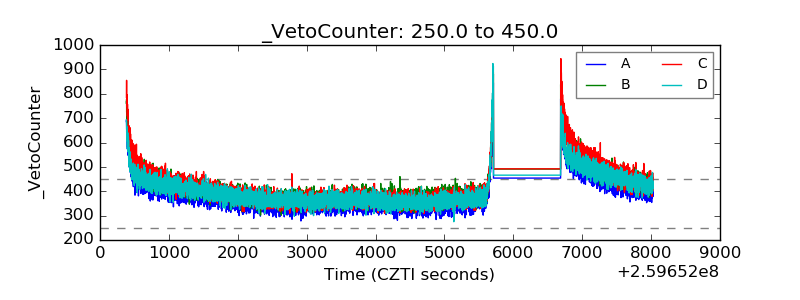 |