| Param | Original file | Final file |
|---|---|---|
| Filename | modeM0/AS1A04_103T01_9000001988_13459cztM0_level2.evt | modeM0/AS1A04_103T01_9000001988_13459cztM0_level2_quad_clean.evt |
| Size (bytes) | 482,751,360 | 66,481,920 |
| Size | 460.4 MB | 63.4 MB |
| Events in quadrant A | 3,246,384 | 398,865 |
| Events in quadrant B | 3,243,603 | 406,647 |
| Events in quadrant C | 3,177,239 | 399,650 |
| Events in quadrant D | 4,526,852 | 369,524 |
| Mode M0 | |||
|---|---|---|---|
| Quadrant | BADHDUFLAG | Total packets | Discarded packets |
| A | 0 | 13547 | 3 |
| B | 0 | 13593 | 2 |
| C | 0 | 13466 | 2 |
| D | 0 | 17593 | 2 |
| Mode SS | |||
|---|---|---|---|
| Quadrant | BADHDUFLAG | Total packets | Discarded packets |
| A | 0 | 130 | 0 |
| B | 0 | 130 | 0 |
| C | 0 | 130 | 0 |
| D | 0 | 130 | 0 |
| Mode M9 | |||
|---|---|---|---|
| Quadrant | BADHDUFLAG | Total packets | Discarded packets |
| A | 0 | 23 | 0 |
| B | 0 | 23 | 0 |
| C | 0 | 23 | 0 |
| D | 0 | 23 | 0 |
| Quadrant | Total seconds | Saturated seconds | Saturation percentage |
|---|---|---|---|
| A | 6274 | 98 | 1.562002% |
| B | 6274 | 106 | 1.689512% |
| C | 6274 | 84 | 1.338859% |
| D | 6274 | 385 | 6.136436% |
Noise dominated data is calculated using 1-second bins in cleaned event files. If a bin has >2000 counts, and if more than 50% of those come from <1% of pixels, then it is considered to be noise-dominated and hence unusable.
| Quadrant | # 1 sec bins | Bins with >0 counts | Bins with >2000 counts | High rate bins dominated by noise | Noise dominated (total time) | Noise dominated (detector-on time) | Marked lightcurve |
|---|---|---|---|---|---|---|---|
| A | 8605 | 6275 | 0 | 0 | 0.00% | 0.00% | 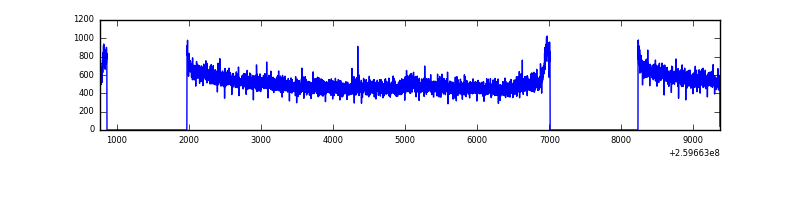 |
| B | 8605 | 6275 | 1 | 1 | 0.01% | 0.02% | 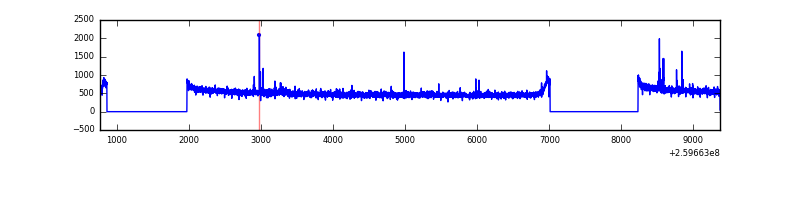 |
| C | 8605 | 6275 | 1 | 1 | 0.01% | 0.02% | 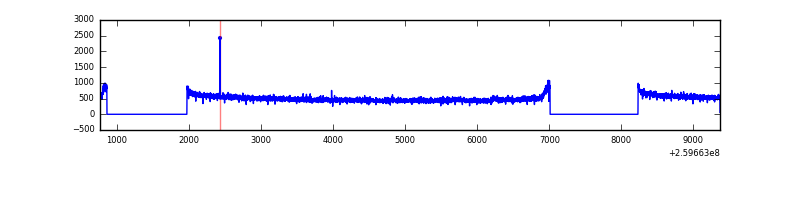 |
| D | 8605 | 6275 | 272 | 272 | 3.16% | 4.33% | 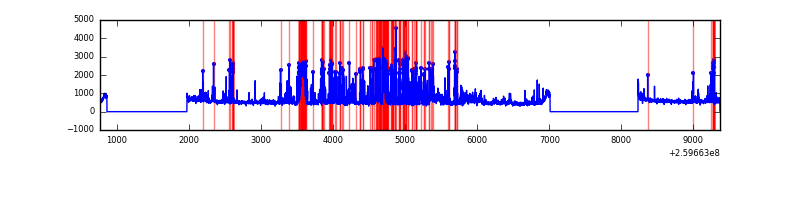 |
Top three noisy pixels from each quadrant. If the there are fewer than three noisy pixels in the level2.evt file, extra rows are filled as -1
| Pixel properties | Quadrant properties | ||||||
|---|---|---|---|---|---|---|---|
| Quadrant | DetID | PixID | Counts | Sigma | Mean | Median | Sigma |
| A | 2 | 250 | 66868 | 401.99 | 821 | 803 | 164.3 |
| A | 1 | 162 | 12654 | 72.11 | 821 | 803 | 164.3 |
| A | 0 | 226 | 7348 | 39.83 | 821 | 803 | 164.3 |
| B | 4 | 173 | 27400 | 174.79 | 815 | 796 | 152.2 |
| B | 3 | 209 | 19522 | 123.03 | 815 | 796 | 152.2 |
| B | 12 | 111 | 17696 | 111.03 | 815 | 796 | 152.2 |
| C | 3 | 233 | 31444 | 167.48 | 799 | 802 | 183.0 |
| C | 10 | 9 | 30368 | 161.6 | 799 | 802 | 183.0 |
| C | 13 | 61 | 5792 | 27.27 | 799 | 802 | 183.0 |
| D | 13 | 249 | 1184301 | 6369.17 | 780 | 757 | 185.8 |
| D | 8 | 195 | 211899 | 1136.25 | 780 | 757 | 185.8 |
| D | 14 | 34 | 97614 | 521.23 | 780 | 757 | 185.8 |
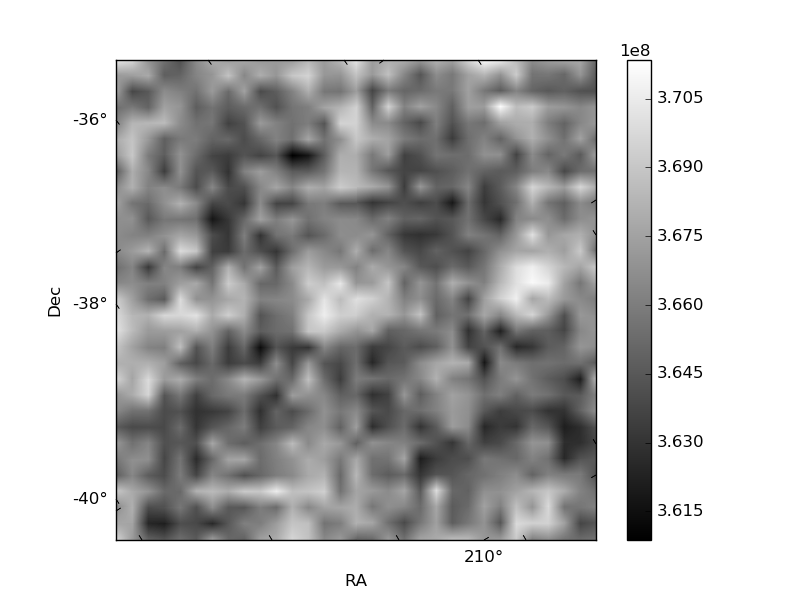
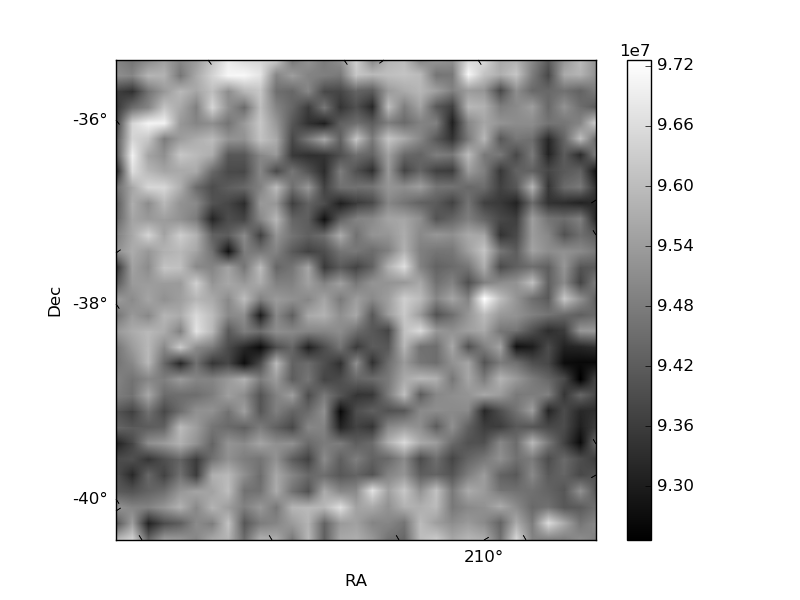
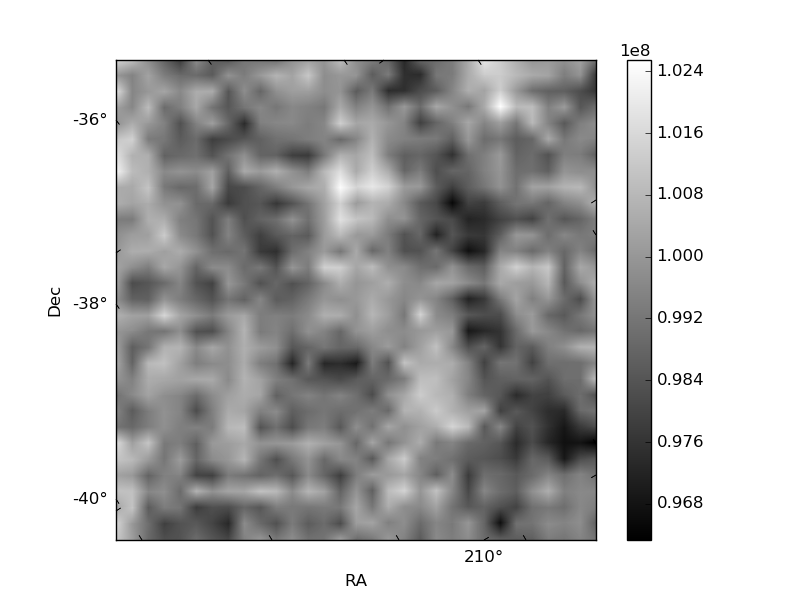
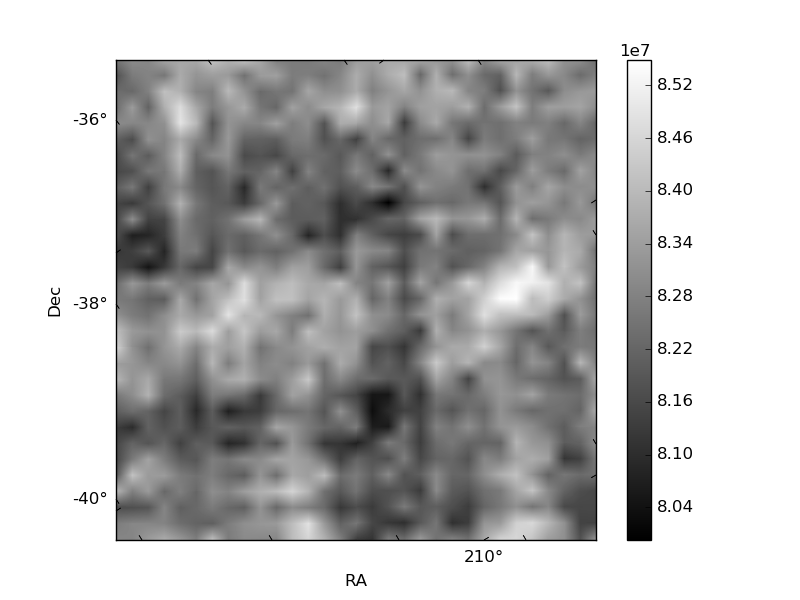
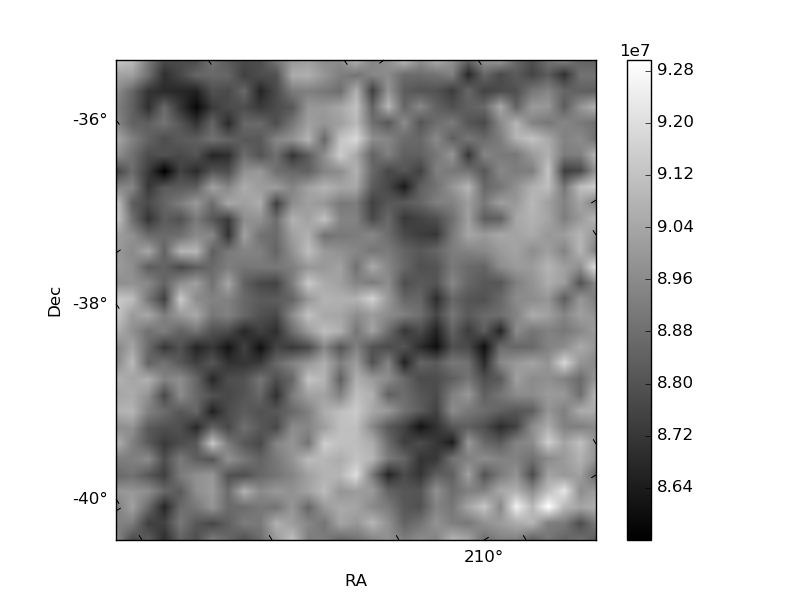
Histogram calculated using DETX and DETY for each event in the final _common_clean file
| Quadrant A | 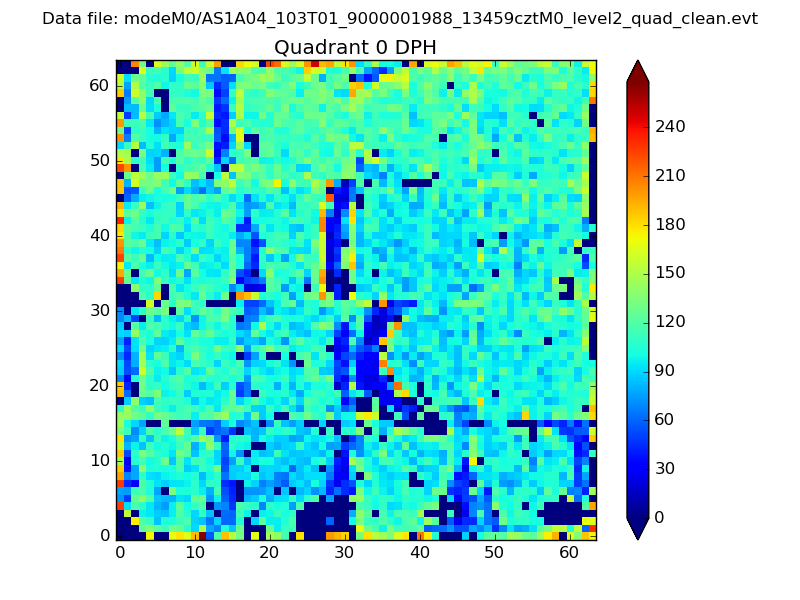 |
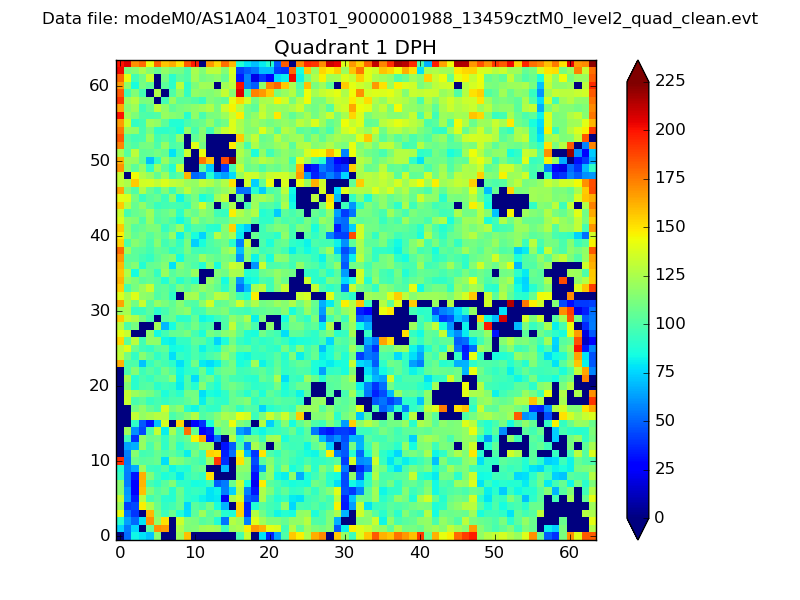 |
Quadrant B |
|---|---|---|---|
| Quadrant D | 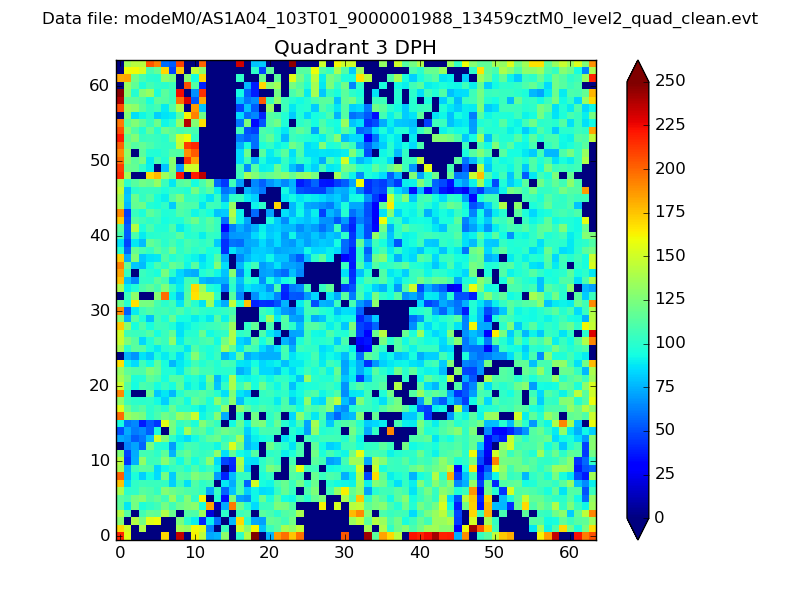 |
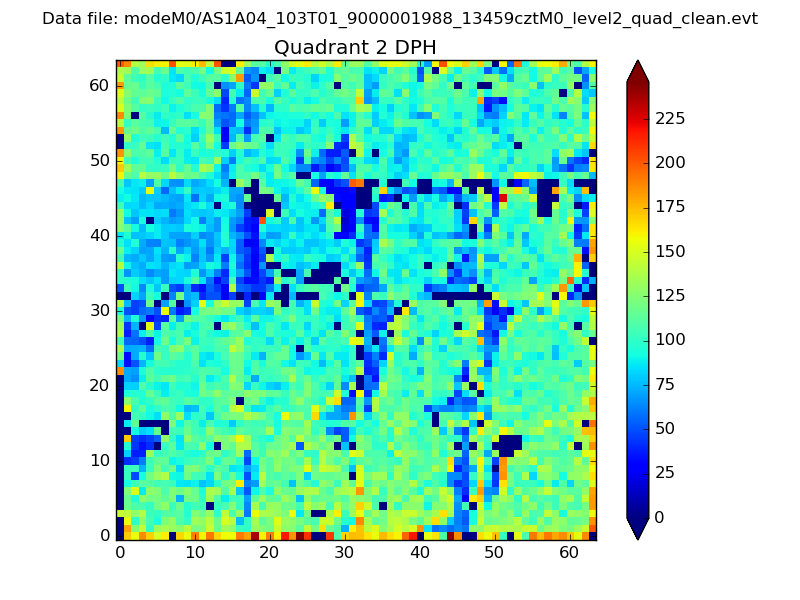 |
Quadrant C |
| Plot type | Count rate plots | Images |
|---|---|---|
| Comparison with Poisson distribution Blue bars denote a histogram of data divided into 1 sec bins. Red curve is a Poisson curve with rate = median count rate of data. |
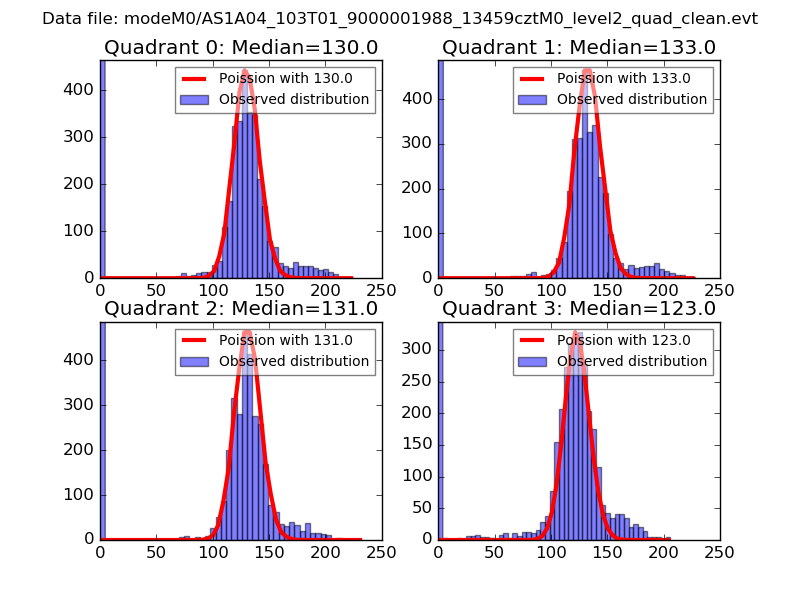 |
 |
| Quadrant-wise count rates Data is divided into 100 sec bins |
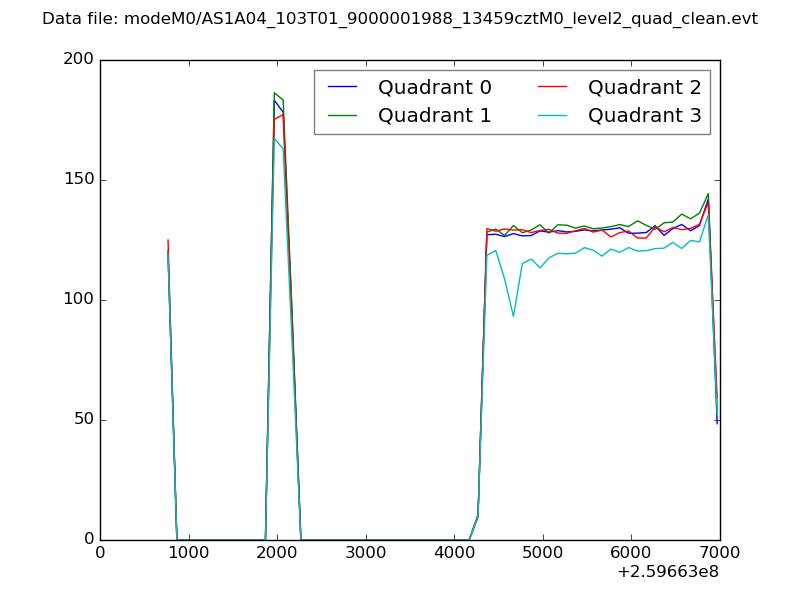 |
|
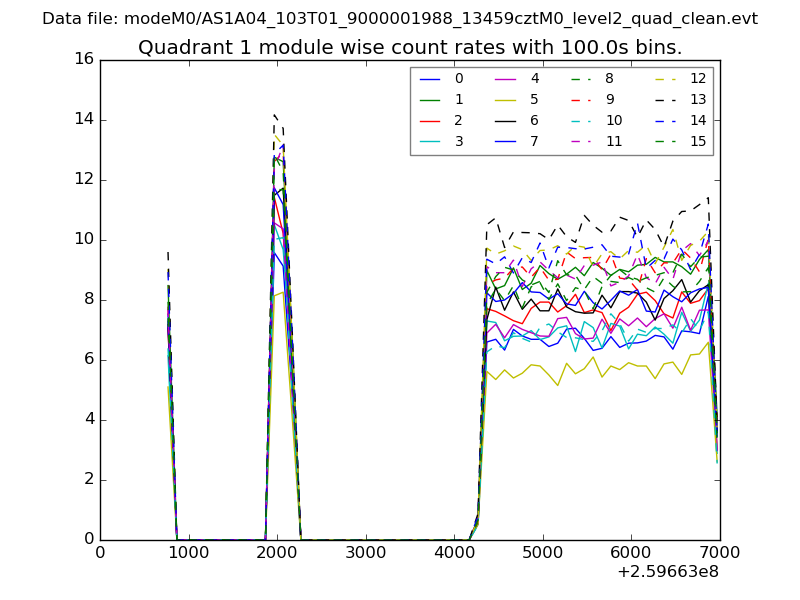
| Module-wise count rates for Quadrant A Data is divided into 100 sec bins |
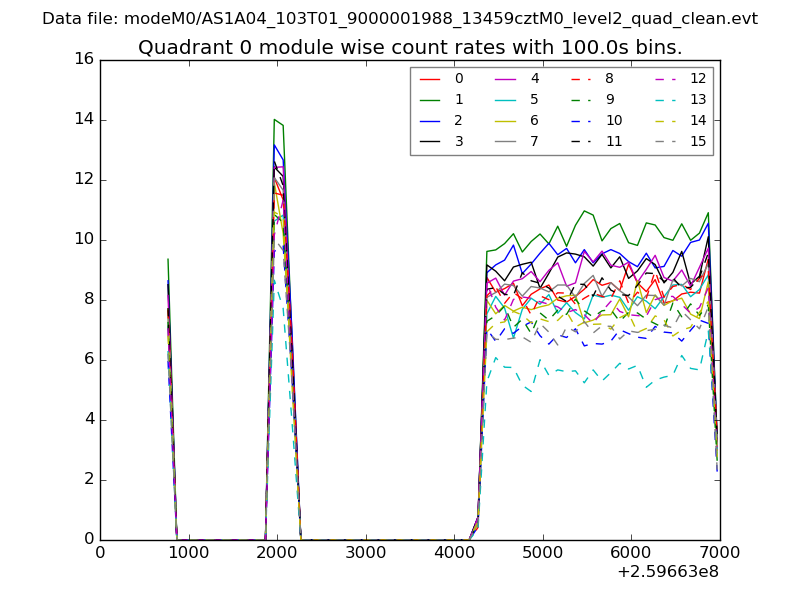 |
 |
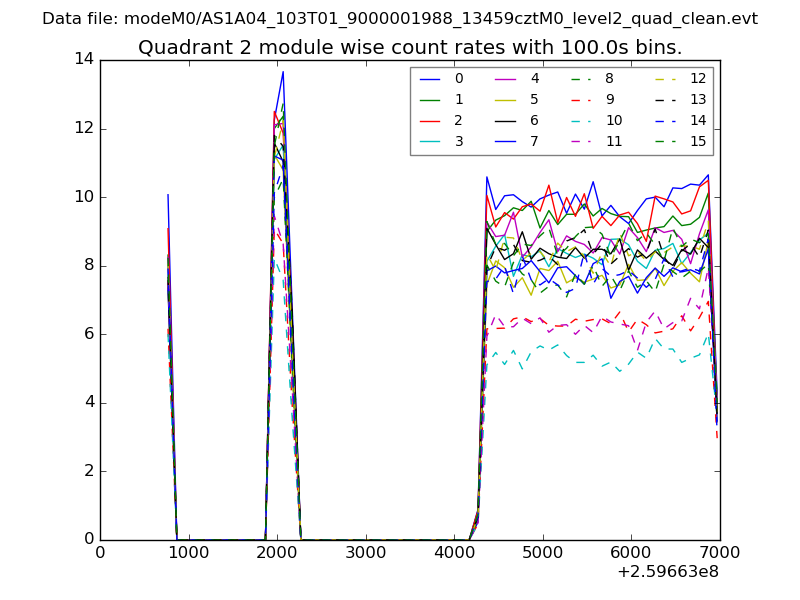
| Module-wise count rates for Quadrant B Data is divided into 100 sec bins |
 |
 |
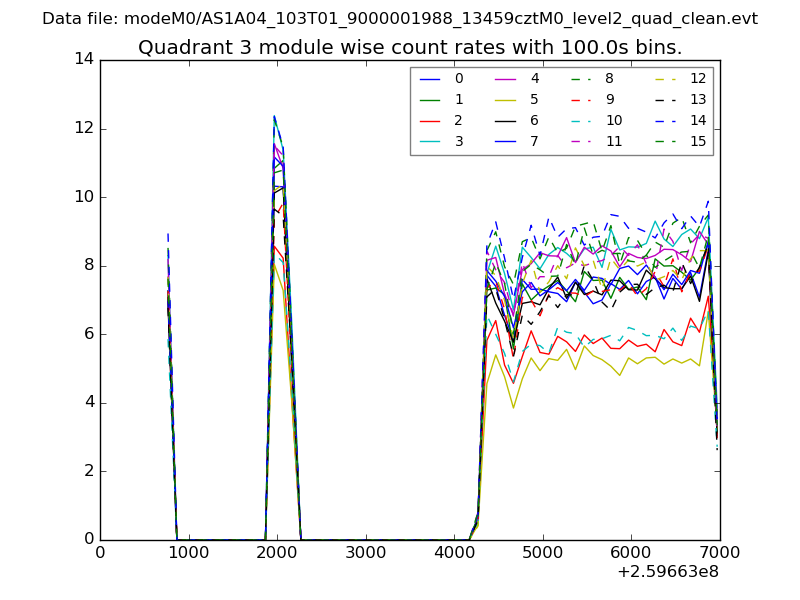
| Module-wise count rates for Quadrant C Data is divided into 100 sec bins |
 |
 |
| Module-wise count rates for Quadrant D Data is divided into 100 sec bins |
 |
 |
| Parameter | Plot |
|---|---|
| CZT HV Monitor | 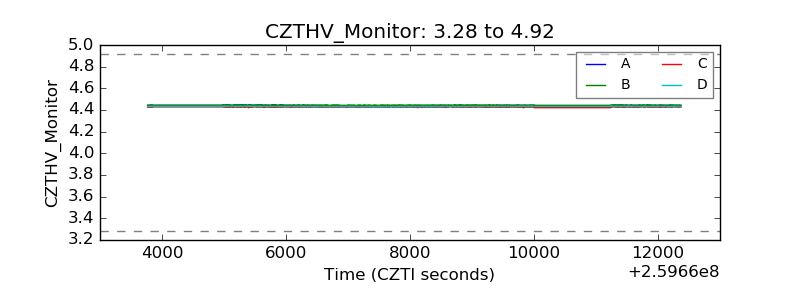 |
| D_VDD | 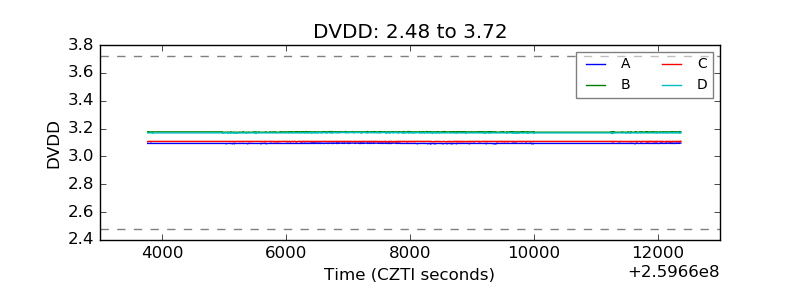 |
| Temperature 1 | 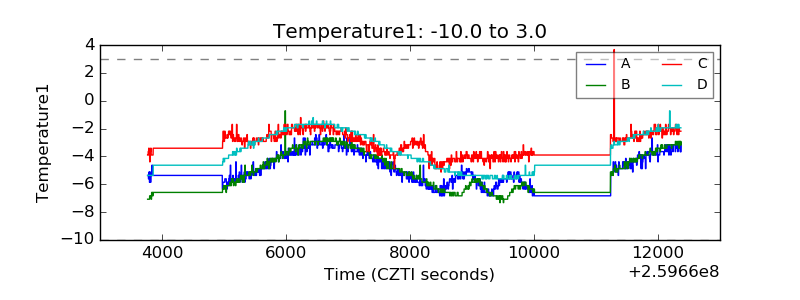 |
| Veto HV Monitor | 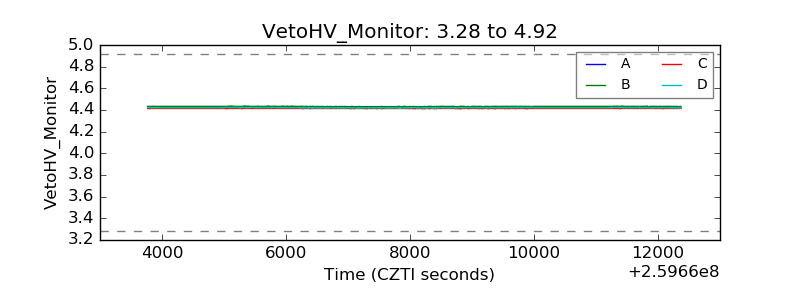 |
| Veto LLD |  |
| Alpha Counter | 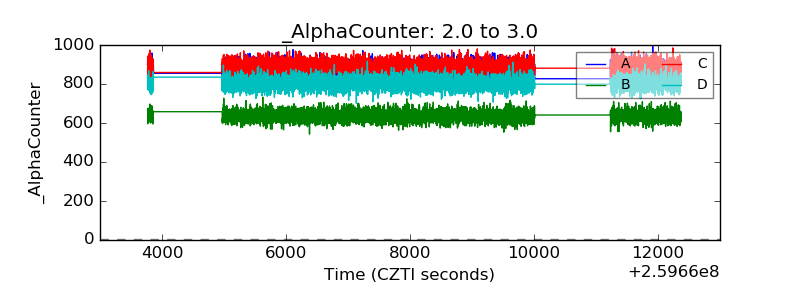 |
| _CPM_Rate | 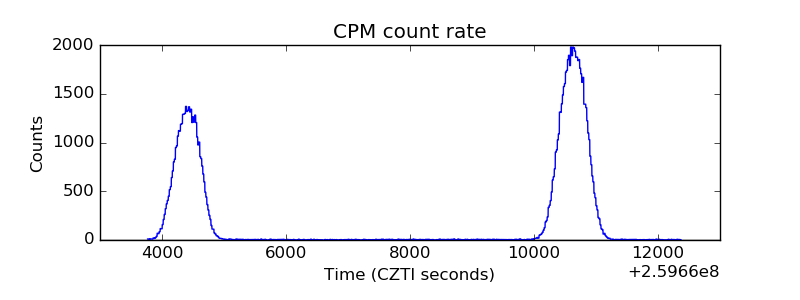 |
| CZT Counter | 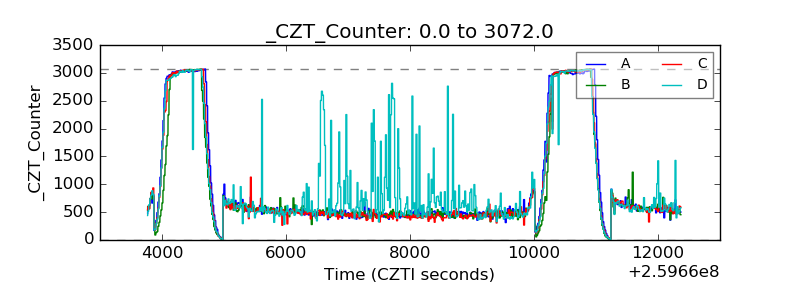 |
| +2.5 Volts monitor | 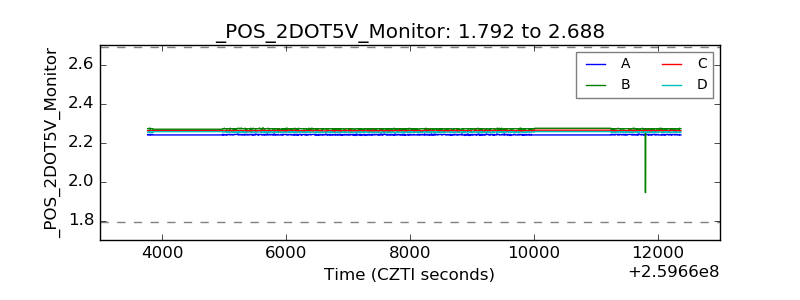 |
| +5 Volts monitor |  |
| _ROLL_ROT | 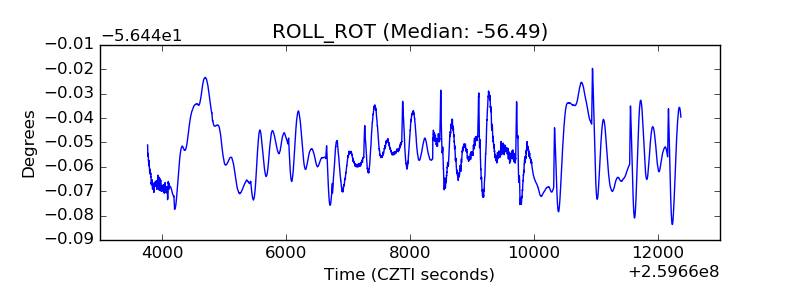 |
| _Roll_DEC | 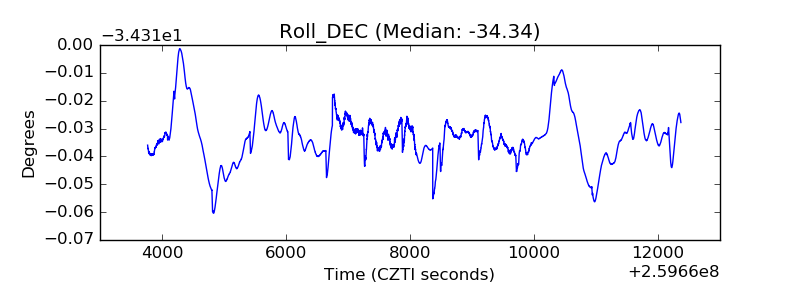 |
| _Roll_RA | 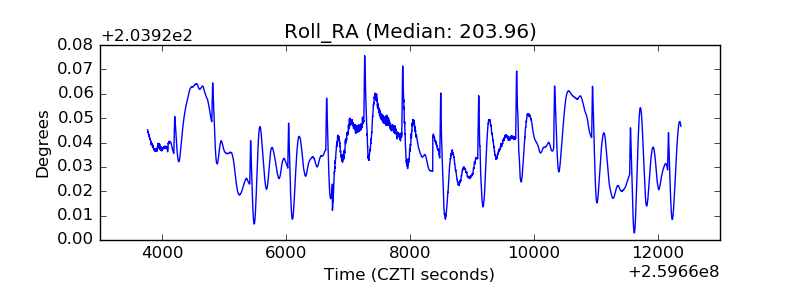 |
| Veto Counter | 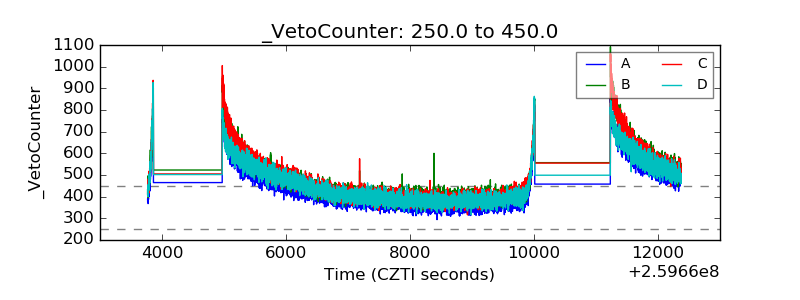 |