| Param | Original file | Final file |
|---|---|---|
| Filename | modeM0/AS1A04_103T01_9000001988_13464cztM0_level2.evt | modeM0/AS1A04_103T01_9000001988_13464cztM0_level2_quad_clean.evt |
| Size (bytes) | 456,059,520 | 102,942,720 |
| Size | 434.9 MB | 98.2 MB |
| Events in quadrant A | 3,334,999 | 658,470 |
| Events in quadrant B | 3,457,090 | 673,912 |
| Events in quadrant C | 3,334,816 | 654,179 |
| Events in quadrant D | 3,191,854 | 626,417 |
| Mode M0 | |||
|---|---|---|---|
| Quadrant | BADHDUFLAG | Total packets | Discarded packets |
| A | 0 | 14935 | 3 |
| B | 0 | 15094 | 2 |
| C | 0 | 14858 | 2 |
| D | 0 | 14913 | 2 |
| Mode SS | |||
|---|---|---|---|
| Quadrant | BADHDUFLAG | Total packets | Discarded packets |
| A | 0 | 148 | 0 |
| B | 0 | 148 | 0 |
| C | 0 | 148 | 0 |
| D | 0 | 148 | 0 |
| Mode M9 | |||
|---|---|---|---|
| Quadrant | BADHDUFLAG | Total packets | Discarded packets |
| A | 0 | 13 | 0 |
| B | 0 | 13 | 0 |
| C | 0 | 13 | 0 |
| D | 0 | 14 | 0 |
| Quadrant | Total seconds | Saturated seconds | Saturation percentage |
|---|---|---|---|
| A | 7247 | 32 | 0.441562% |
| B | 7247 | 61 | 0.841728% |
| C | 7247 | 11 | 0.151787% |
| D | 7247 | 11 | 0.151787% |
Noise dominated data is calculated using 1-second bins in cleaned event files. If a bin has >2000 counts, and if more than 50% of those come from <1% of pixels, then it is considered to be noise-dominated and hence unusable.
| Quadrant | # 1 sec bins | Bins with >0 counts | Bins with >2000 counts | High rate bins dominated by noise | Noise dominated (total time) | Noise dominated (detector-on time) | Marked lightcurve |
|---|---|---|---|---|---|---|---|
| A | 7908 | 7249 | 0 | 0 | 0.00% | 0.00% | 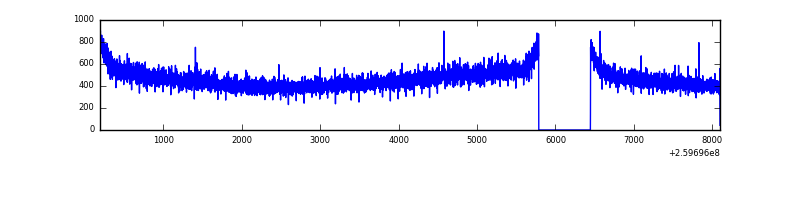 |
| B | 7908 | 7249 | 6 | 6 | 0.08% | 0.08% | 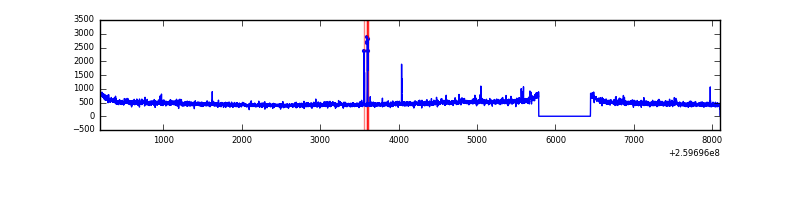 |
| C | 7908 | 7249 | 1 | 1 | 0.01% | 0.01% | 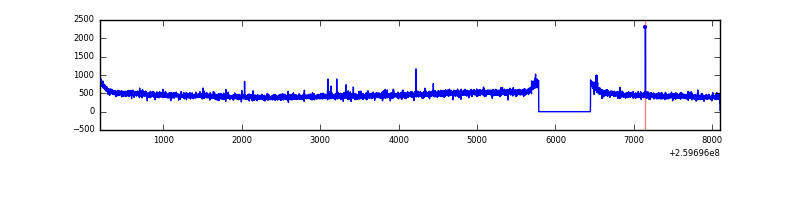 |
| D | 7908 | 7249 | 3 | 3 | 0.04% | 0.04% | 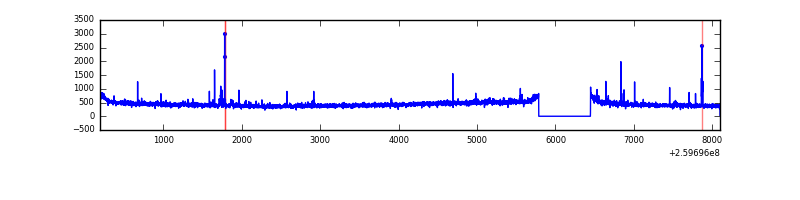 |
Top three noisy pixels from each quadrant. If the there are fewer than three noisy pixels in the level2.evt file, extra rows are filled as -1
| Pixel properties | Quadrant properties | ||||||
|---|---|---|---|---|---|---|---|
| Quadrant | DetID | PixID | Counts | Sigma | Mean | Median | Sigma |
| A | 8 | 15 | 14626 | 79.02 | 860 | 842 | 174.4 |
| A | 1 | 162 | 9271 | 48.32 | 860 | 842 | 174.4 |
| A | 0 | 226 | 7724 | 39.45 | 860 | 842 | 174.4 |
| B | 3 | 64 | 39919 | 236.47 | 866 | 843 | 165.2 |
| B | 3 | 209 | 20854 | 121.1 | 866 | 843 | 165.2 |
| B | 12 | 111 | 19374 | 112.14 | 866 | 843 | 165.2 |
| C | 3 | 233 | 62541 | 318.27 | 835 | 838 | 193.9 |
| C | 14 | 220 | 13800 | 66.86 | 835 | 838 | 193.9 |
| C | 13 | 61 | 5937 | 26.3 | 835 | 838 | 193.9 |
| D | 9 | 85 | 30713 | 151.59 | 824 | 803 | 197.3 |
| D | 2 | 234 | 23375 | 114.4 | 824 | 803 | 197.3 |
| D | 8 | 195 | 20963 | 102.18 | 824 | 803 | 197.3 |
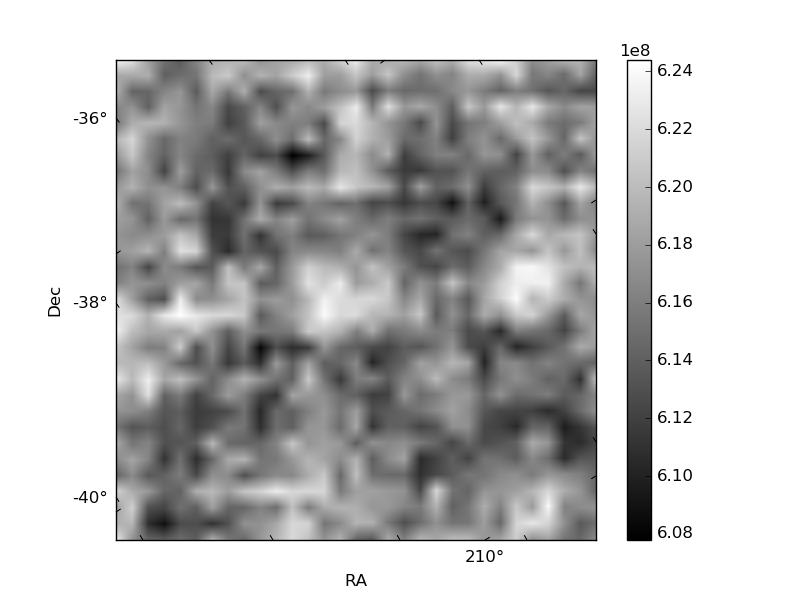
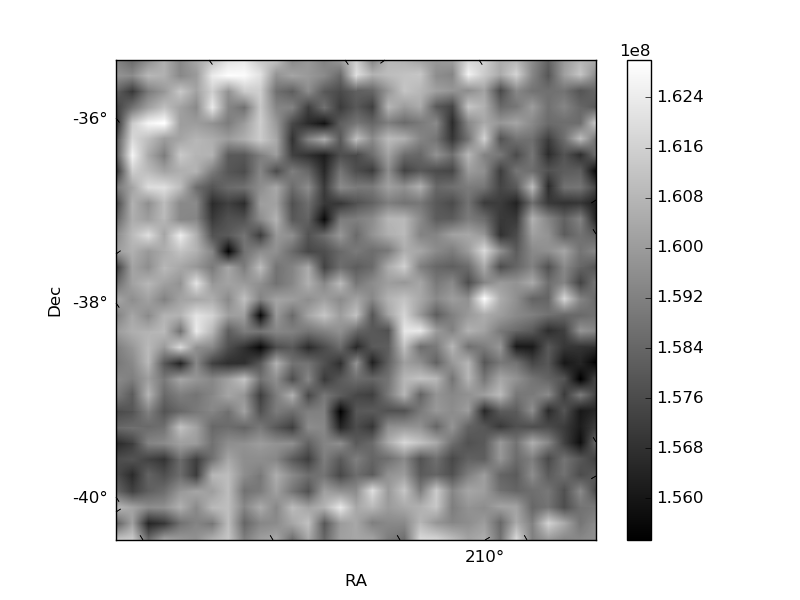
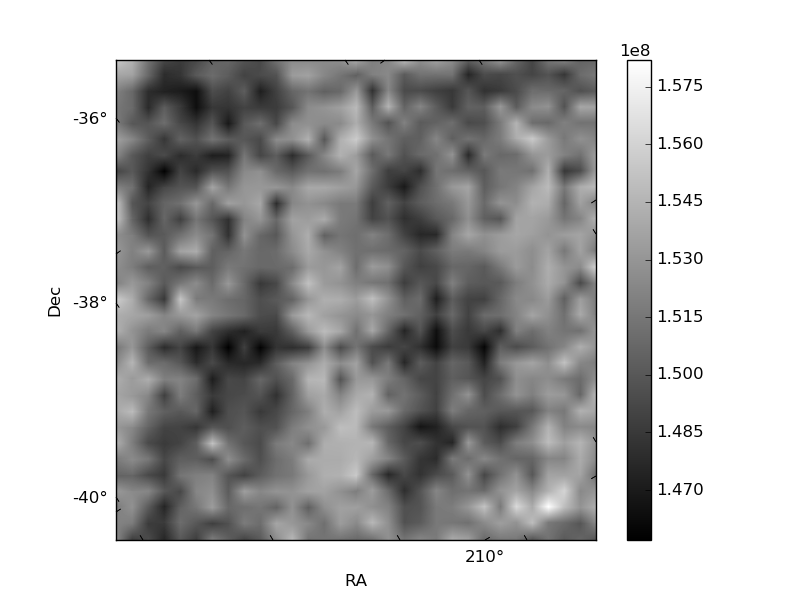
Histogram calculated using DETX and DETY for each event in the final _common_clean file
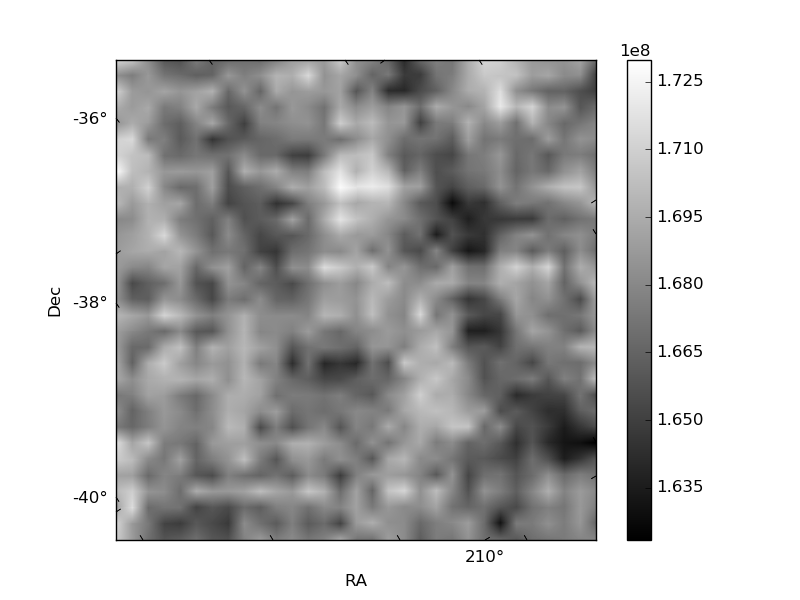
| Quadrant A | 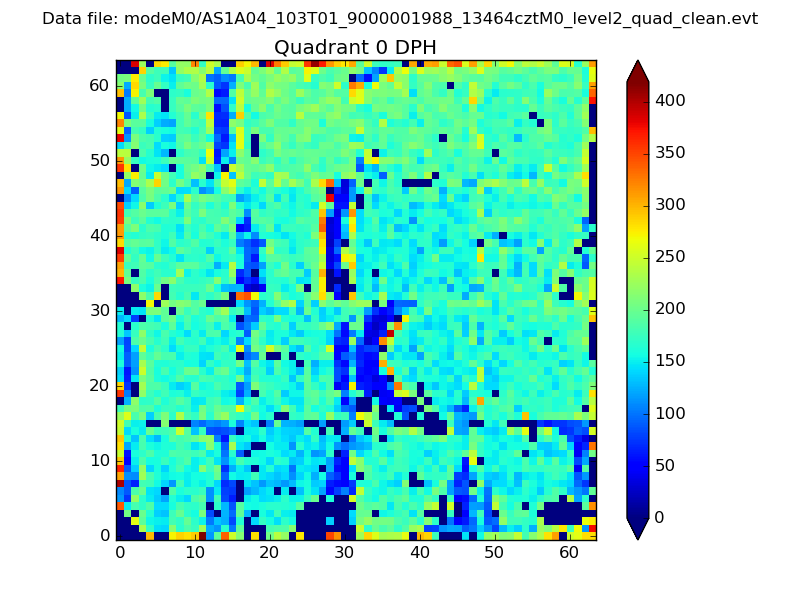 |
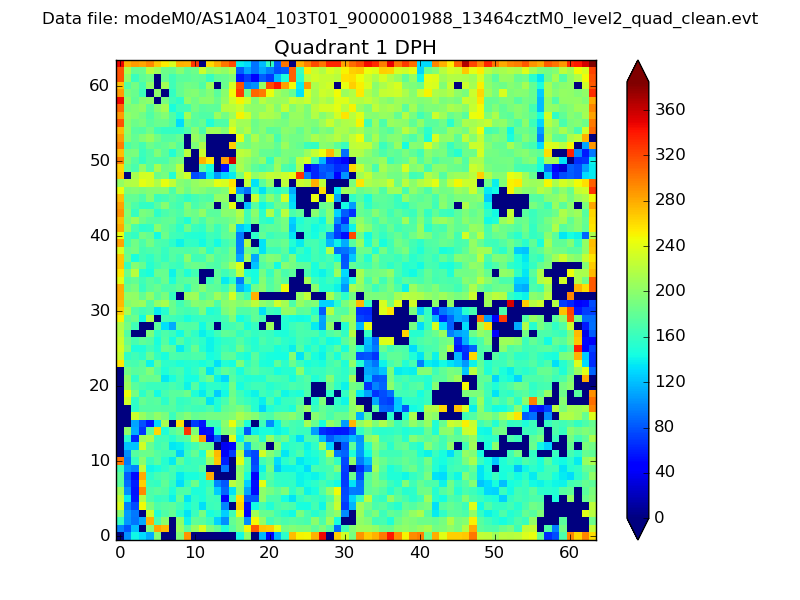 |
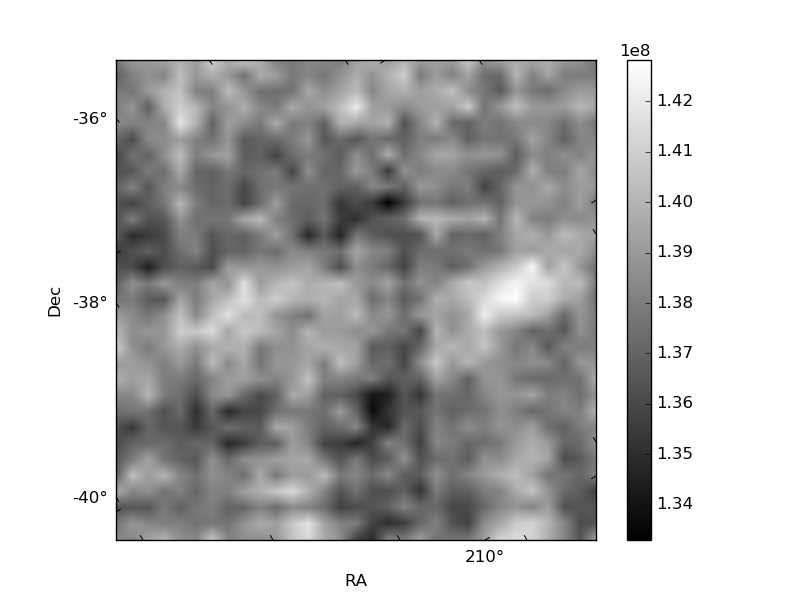
Quadrant B |
|---|---|---|---|
| Quadrant D | 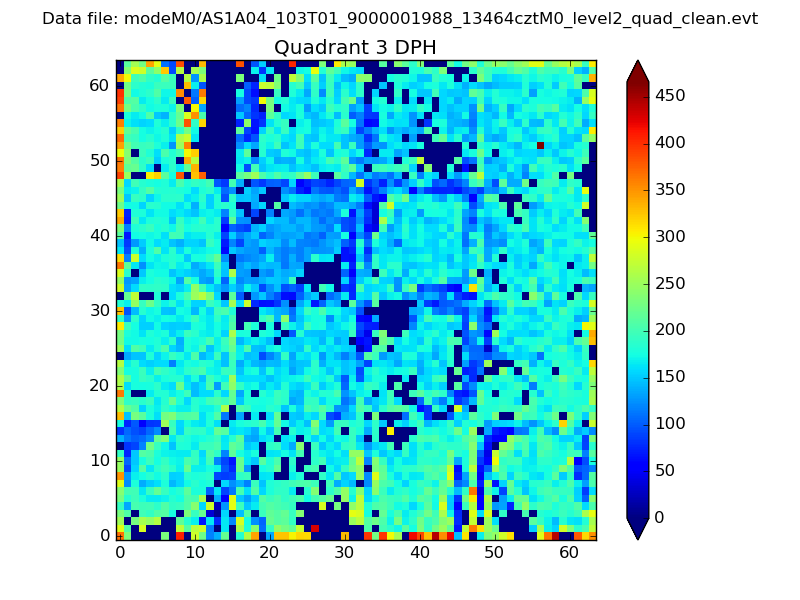 |
 |
Quadrant C |
| Plot type | Count rate plots | Images |
|---|---|---|
| Comparison with Poisson distribution Blue bars denote a histogram of data divided into 1 sec bins. Red curve is a Poisson curve with rate = median count rate of data. |
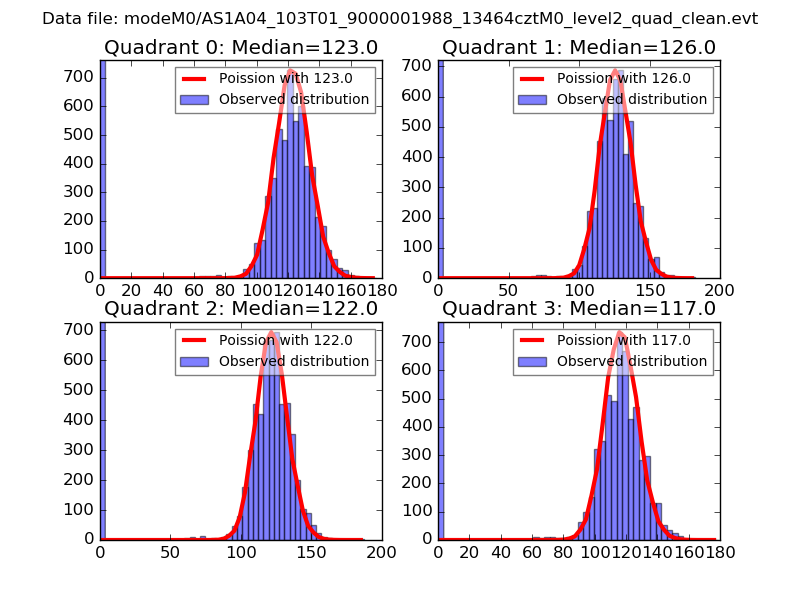 |
 |
| Quadrant-wise count rates Data is divided into 100 sec bins |
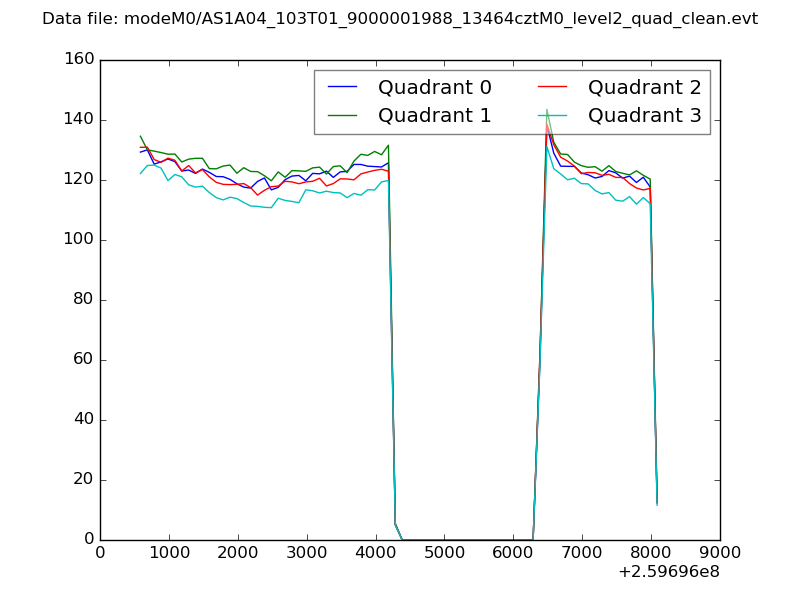 |
|
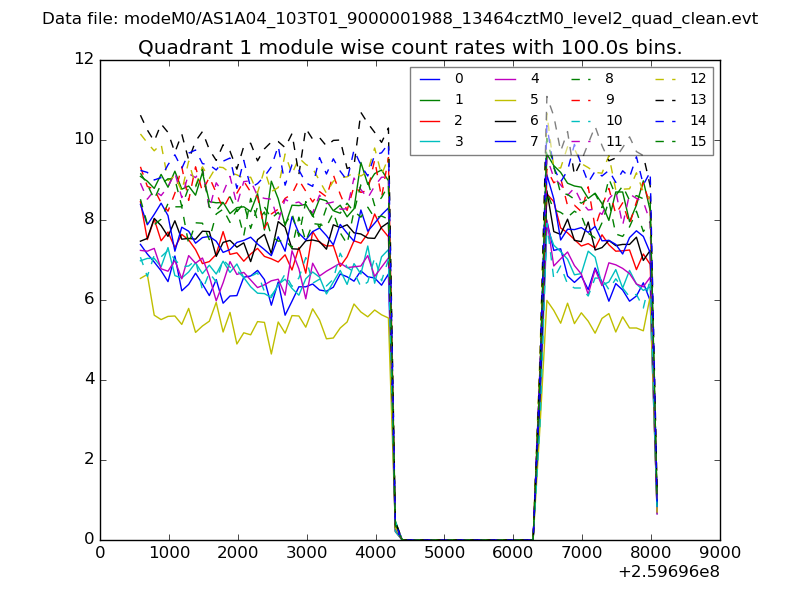
| Module-wise count rates for Quadrant A Data is divided into 100 sec bins |
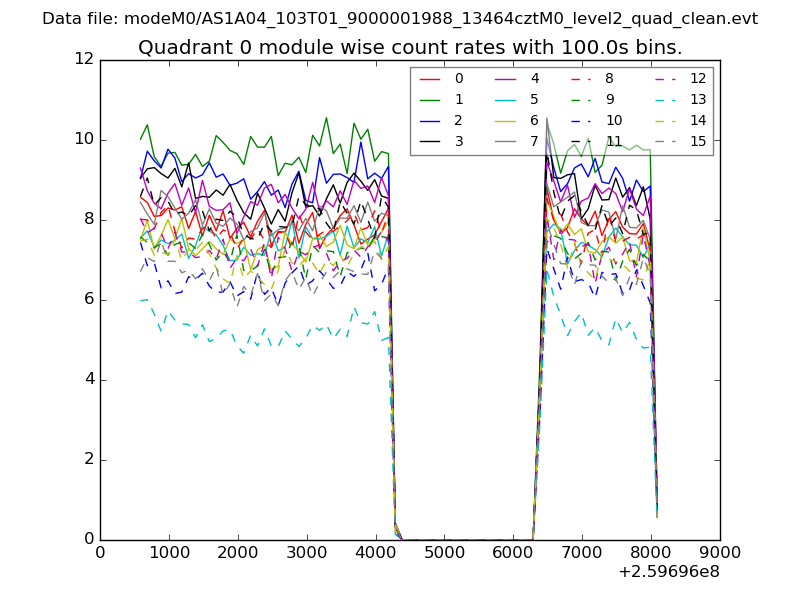 |
 |
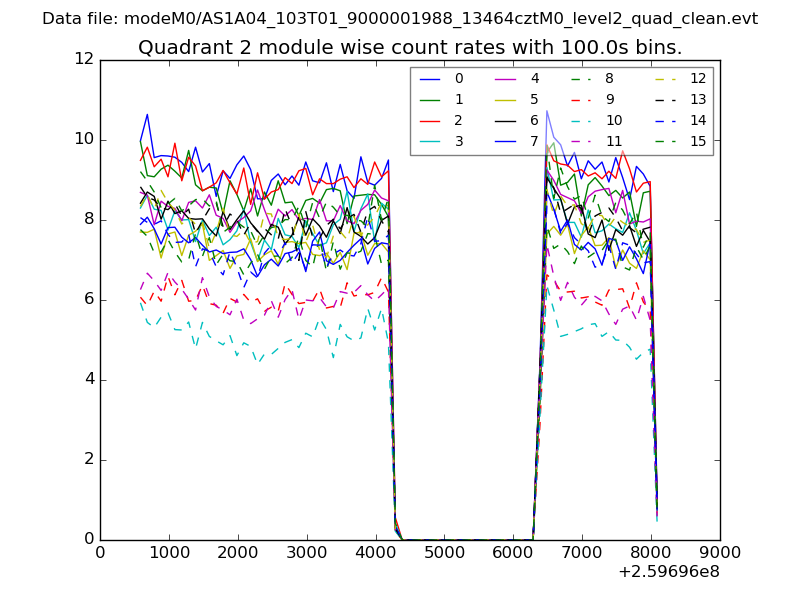
| Module-wise count rates for Quadrant B Data is divided into 100 sec bins |
 |
 |
| Module-wise count rates for Quadrant C Data is divided into 100 sec bins |
 |
 |
| Module-wise count rates for Quadrant D Data is divided into 100 sec bins |
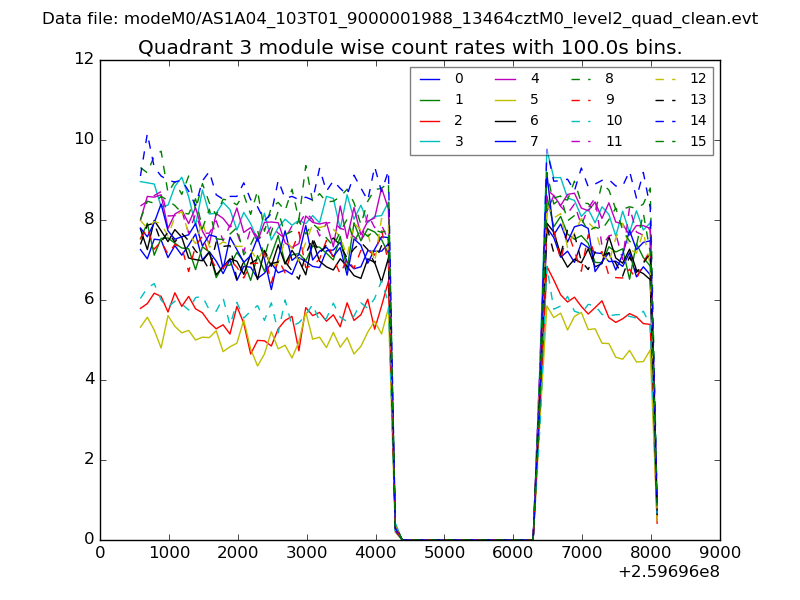 |
 |
| Parameter | Plot |
|---|---|
| CZT HV Monitor | 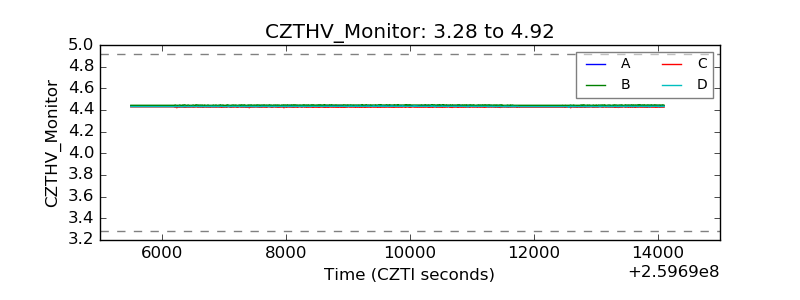 |
| D_VDD | 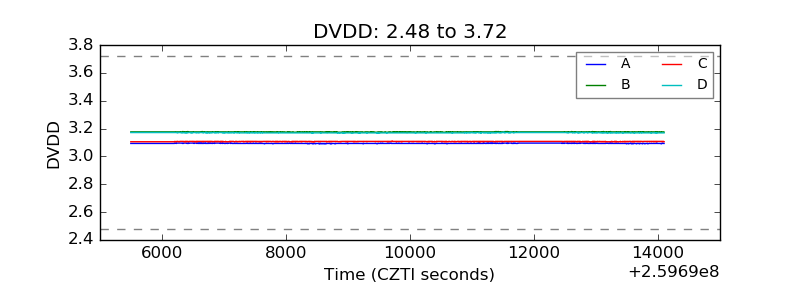 |
| Temperature 1 | 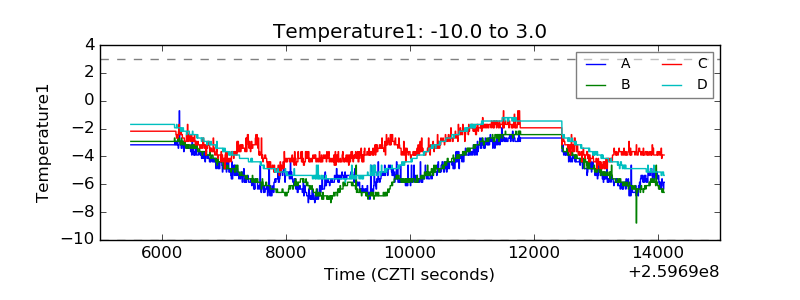 |
| Veto HV Monitor | 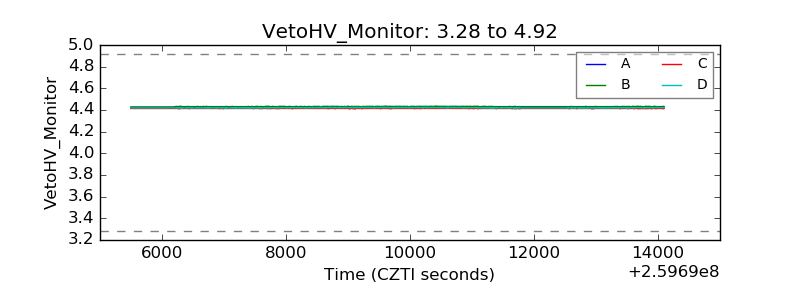 |
| Veto LLD | 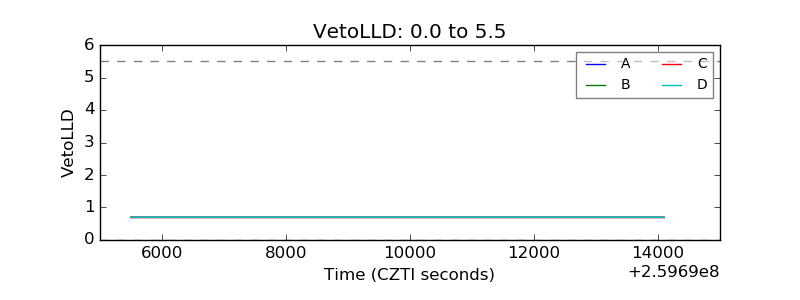 |
| Alpha Counter | 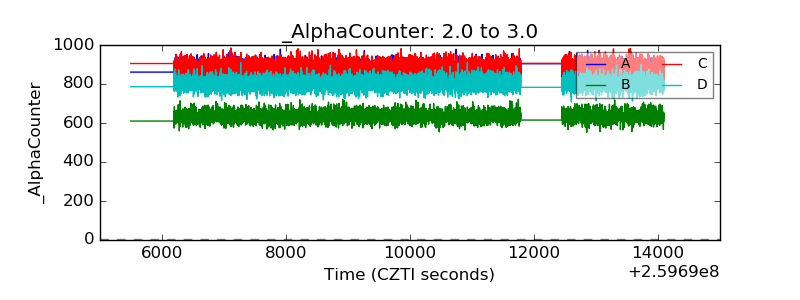 |
| _CPM_Rate | 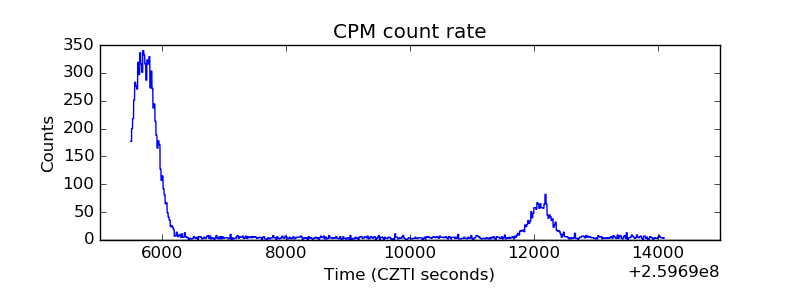 |
| CZT Counter | 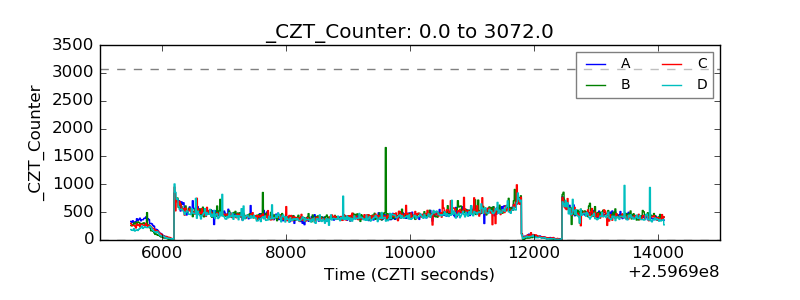 |
| +2.5 Volts monitor |  |
| +5 Volts monitor |  |
| _ROLL_ROT | 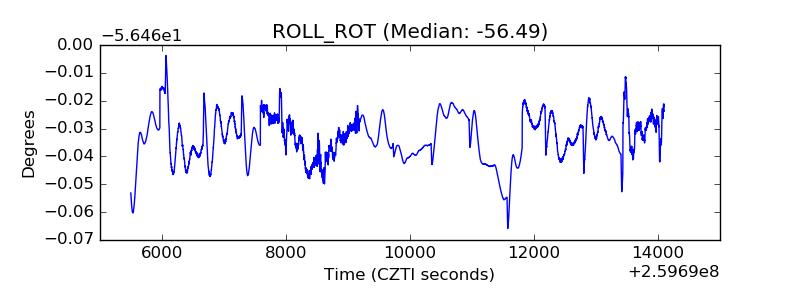 |
| _Roll_DEC | 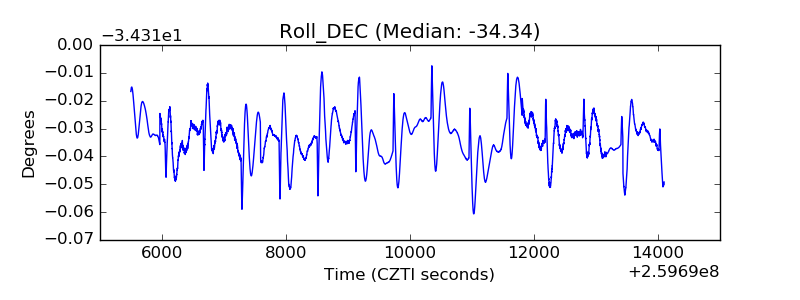 |
| _Roll_RA | 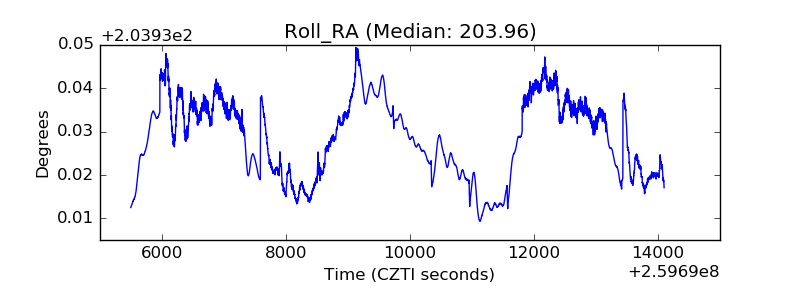 |
| Veto Counter | 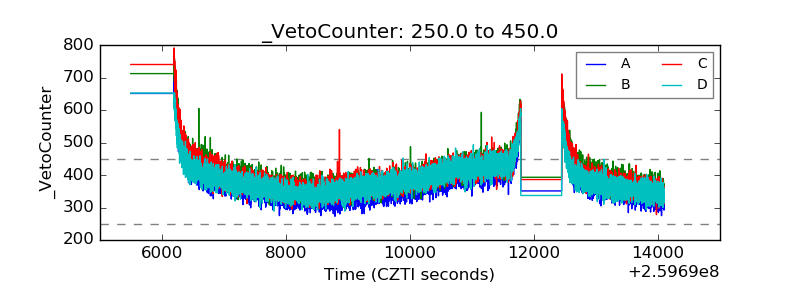 |