| Param | Original file | Final file |
|---|---|---|
| Filename | modeM0/AS1A04_103T01_9000001988_13465cztM0_level2.evt | modeM0/AS1A04_103T01_9000001988_13465cztM0_level2_quad_clean.evt |
| Size (bytes) | 508,484,160 | 105,436,800 |
| Size | 484.9 MB | 100.6 MB |
| Events in quadrant A | 3,675,869 | 669,803 |
| Events in quadrant B | 4,169,385 | 677,793 |
| Events in quadrant C | 3,596,349 | 666,195 |
| Events in quadrant D | 3,427,183 | 636,286 |
| Mode M0 | |||
|---|---|---|---|
| Quadrant | BADHDUFLAG | Total packets | Discarded packets |
| A | 0 | 16368 | 3 |
| B | 0 | 17685 | 2 |
| C | 0 | 16130 | 2 |
| D | 0 | 16090 | 2 |
| Mode SS | |||
|---|---|---|---|
| Quadrant | BADHDUFLAG | Total packets | Discarded packets |
| A | 0 | 160 | 0 |
| B | 0 | 160 | 0 |
| C | 0 | 160 | 0 |
| D | 0 | 160 | 0 |
| Mode M9 | |||
|---|---|---|---|
| Quadrant | BADHDUFLAG | Total packets | Discarded packets |
| A | 0 | 10 | 0 |
| B | 0 | 10 | 0 |
| C | 0 | 10 | 0 |
| D | 0 | 10 | 0 |
| Quadrant | Total seconds | Saturated seconds | Saturation percentage |
|---|---|---|---|
| A | 7811 | 64 | 0.819357% |
| B | 7811 | 263 | 3.367046% |
| C | 7811 | 22 | 0.281654% |
| D | 7811 | 11 | 0.140827% |
Noise dominated data is calculated using 1-second bins in cleaned event files. If a bin has >2000 counts, and if more than 50% of those come from <1% of pixels, then it is considered to be noise-dominated and hence unusable.
| Quadrant | # 1 sec bins | Bins with >0 counts | Bins with >2000 counts | High rate bins dominated by noise | Noise dominated (total time) | Noise dominated (detector-on time) | Marked lightcurve |
|---|---|---|---|---|---|---|---|
| A | 8772 | 7814 | 1 | 1 | 0.01% | 0.01% | 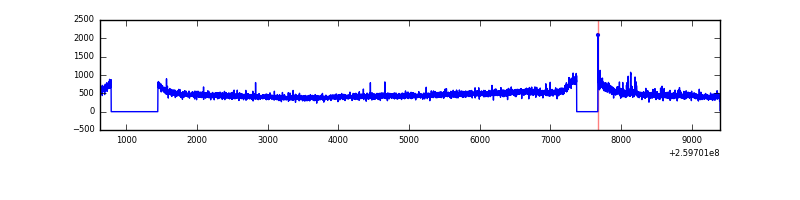 |
| B | 8772 | 7813 | 157 | 157 | 1.79% | 2.01% | 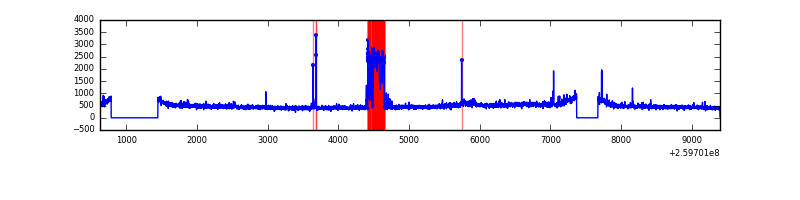 |
| C | 8772 | 7814 | 1 | 1 | 0.01% | 0.01% | 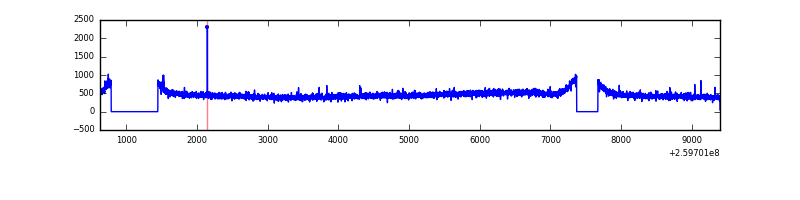 |
| D | 8772 | 7814 | 2 | 2 | 0.02% | 0.03% | 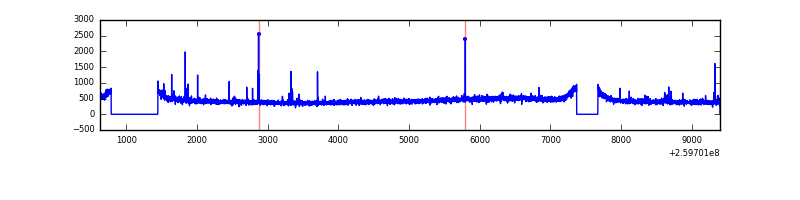 |
Top three noisy pixels from each quadrant. If the there are fewer than three noisy pixels in the level2.evt file, extra rows are filled as -1
| Pixel properties | Quadrant properties | ||||||
|---|---|---|---|---|---|---|---|
| Quadrant | DetID | PixID | Counts | Sigma | Mean | Median | Sigma |
| A | 8 | 15 | 83332 | 432.59 | 930 | 907 | 190.5 |
| A | 1 | 162 | 9457 | 44.87 | 930 | 907 | 190.5 |
| A | 0 | 226 | 8305 | 38.82 | 930 | 907 | 190.5 |
| B | 3 | 64 | 436841 | 2435.84 | 933 | 908 | 179.0 |
| B | 0 | 85 | 29298 | 158.63 | 933 | 908 | 179.0 |
| B | 4 | 80 | 24071 | 129.43 | 933 | 908 | 179.0 |
| C | 3 | 233 | 45681 | 212.74 | 907 | 909 | 210.5 |
| C | 14 | 220 | 13091 | 57.88 | 907 | 909 | 210.5 |
| C | 13 | 61 | 6593 | 27.01 | 907 | 909 | 210.5 |
| D | 2 | 234 | 27092 | 122.7 | 893 | 868 | 213.7 |
| D | 9 | 85 | 13219 | 57.79 | 893 | 868 | 213.7 |
| D | 12 | 110 | 13178 | 57.6 | 893 | 868 | 213.7 |
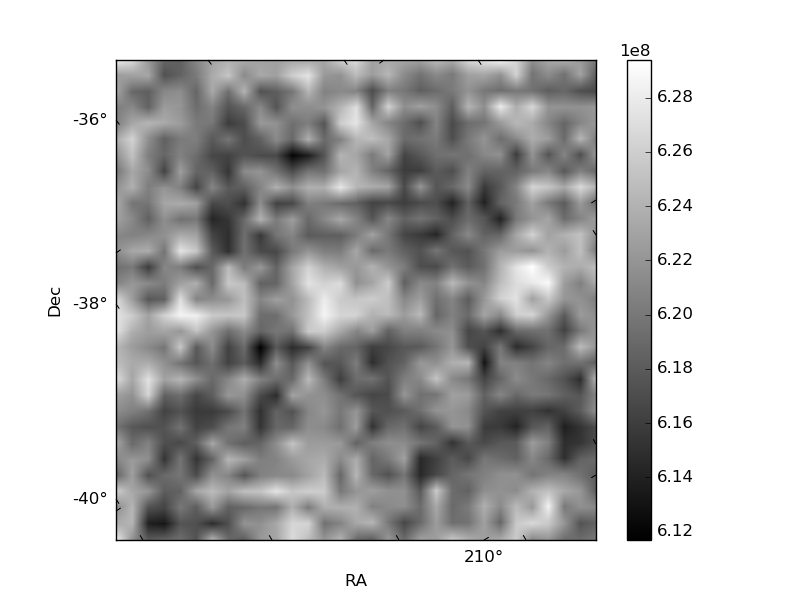
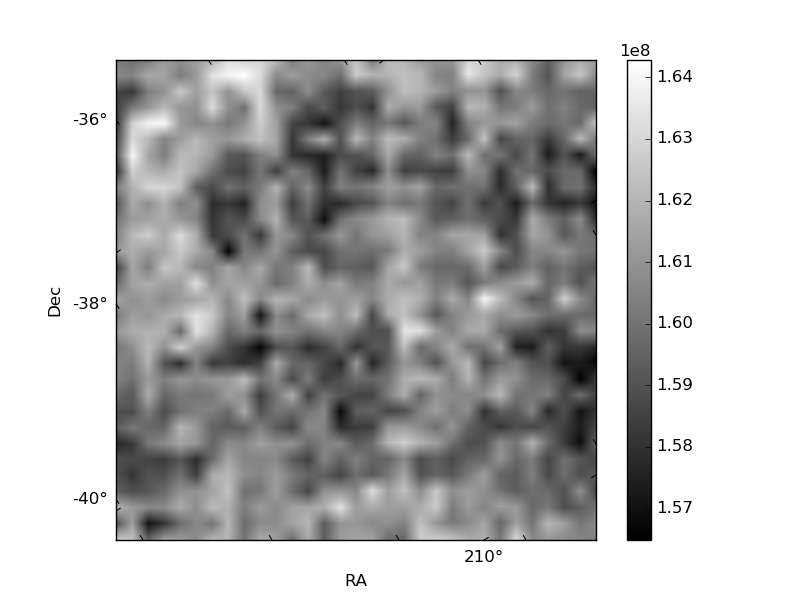
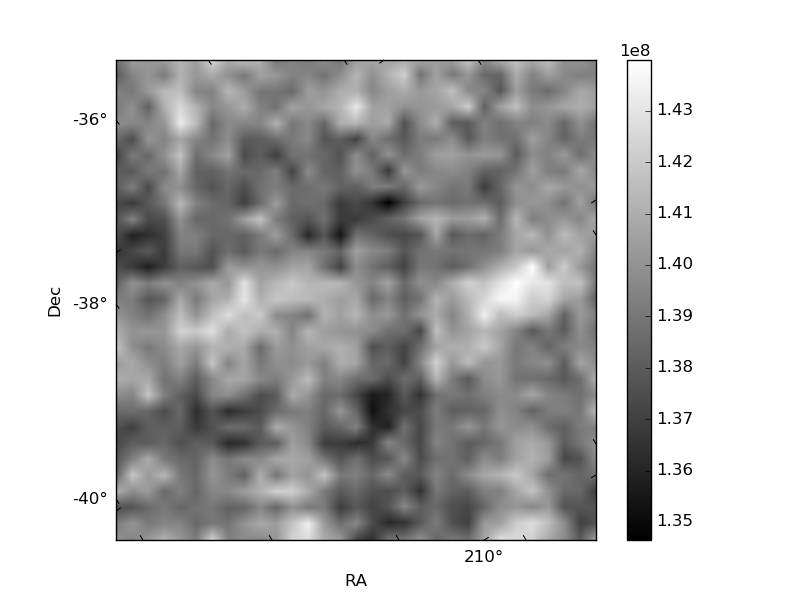
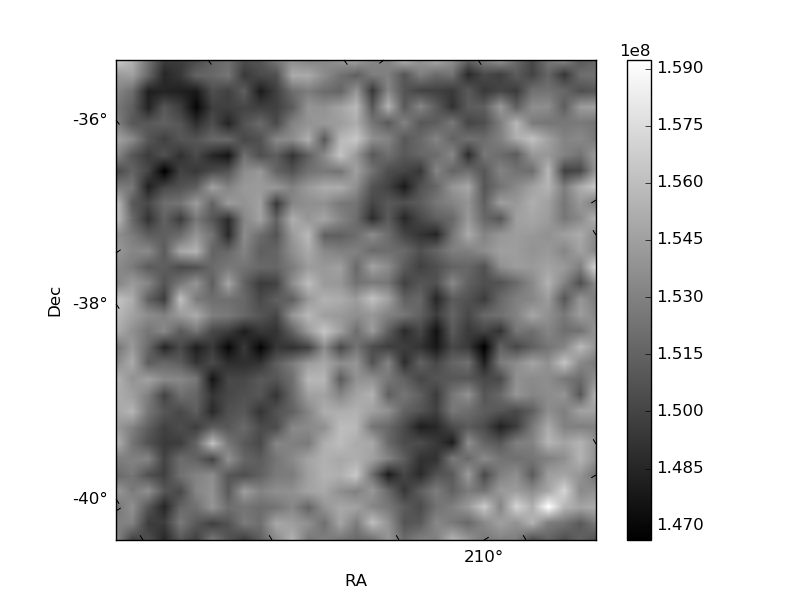
Histogram calculated using DETX and DETY for each event in the final _common_clean file
| Quadrant A | 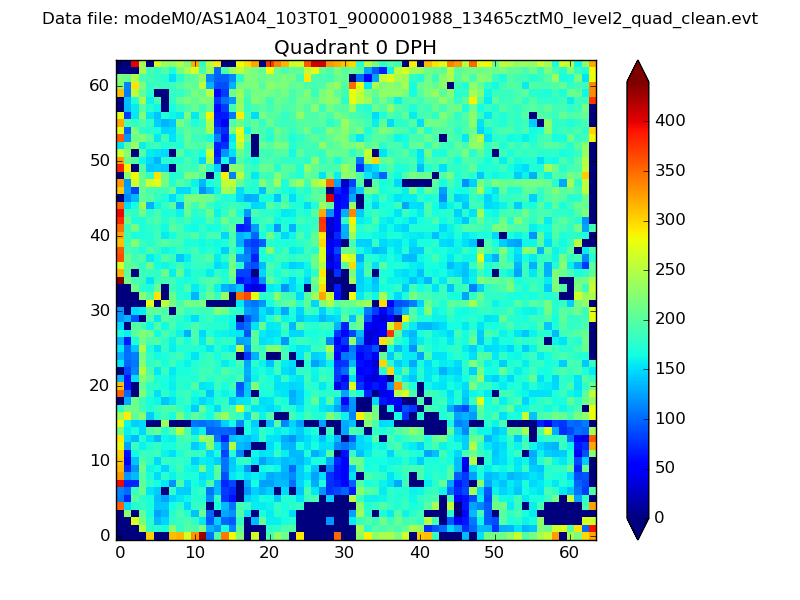 |
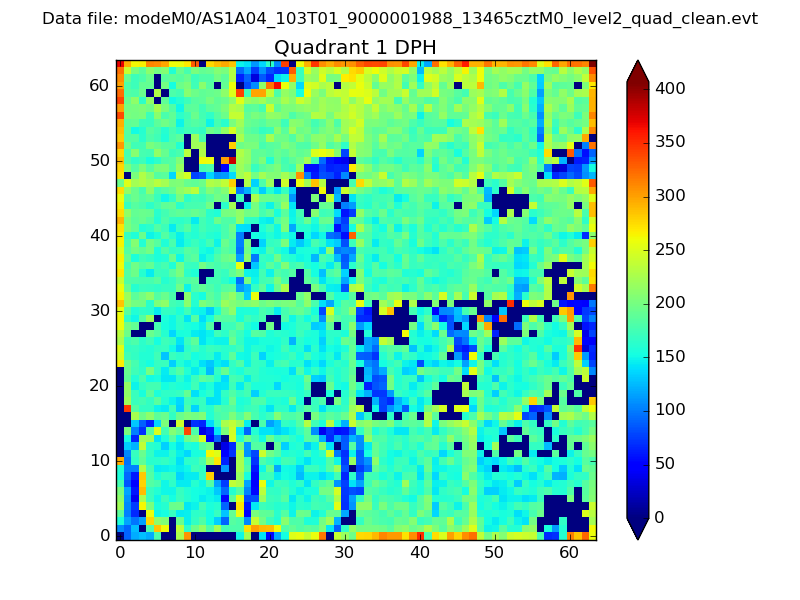 |
Quadrant B |
|---|---|---|---|
| Quadrant D | 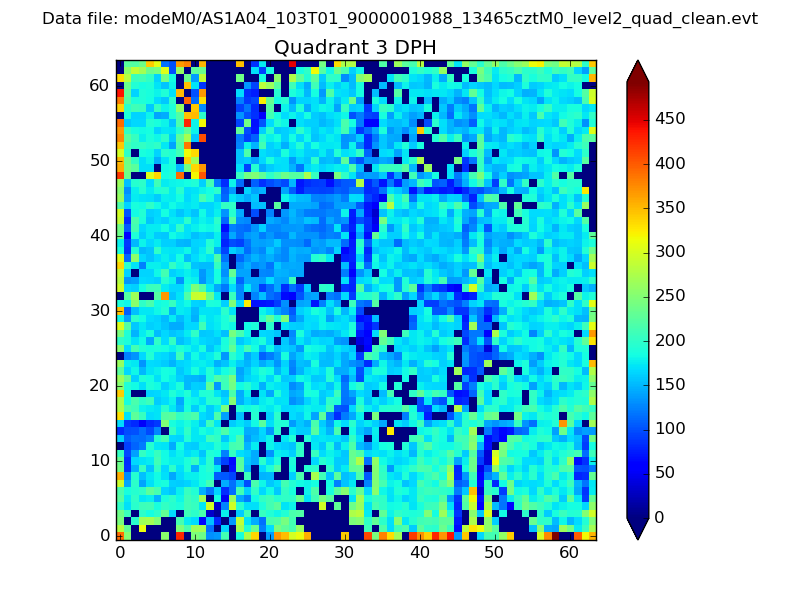 |
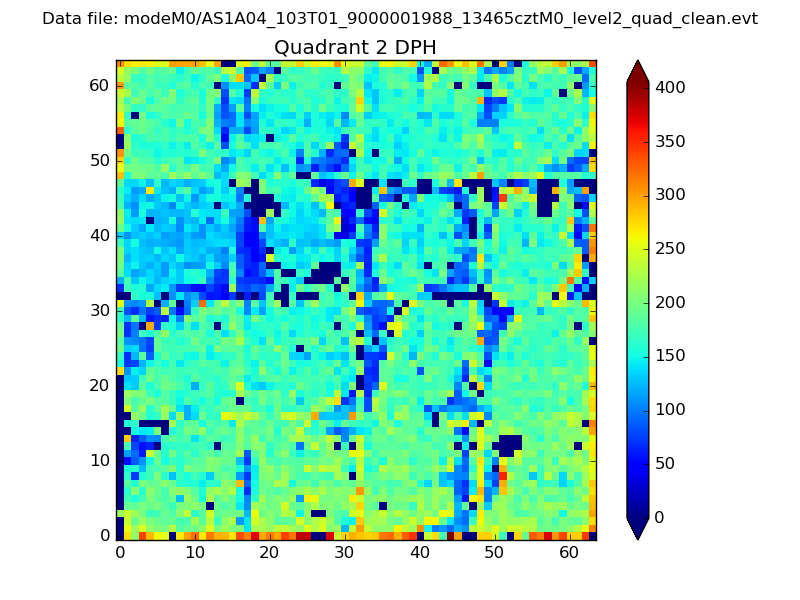 |
Quadrant C |
| Plot type | Count rate plots | Images |
|---|---|---|
| Comparison with Poisson distribution Blue bars denote a histogram of data divided into 1 sec bins. Red curve is a Poisson curve with rate = median count rate of data. |
 |
 |
| Quadrant-wise count rates Data is divided into 100 sec bins |
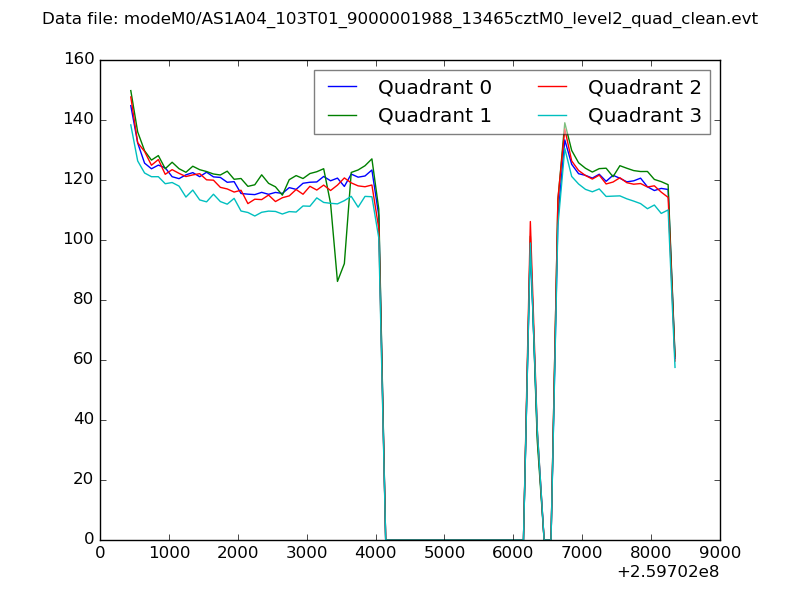 |
|
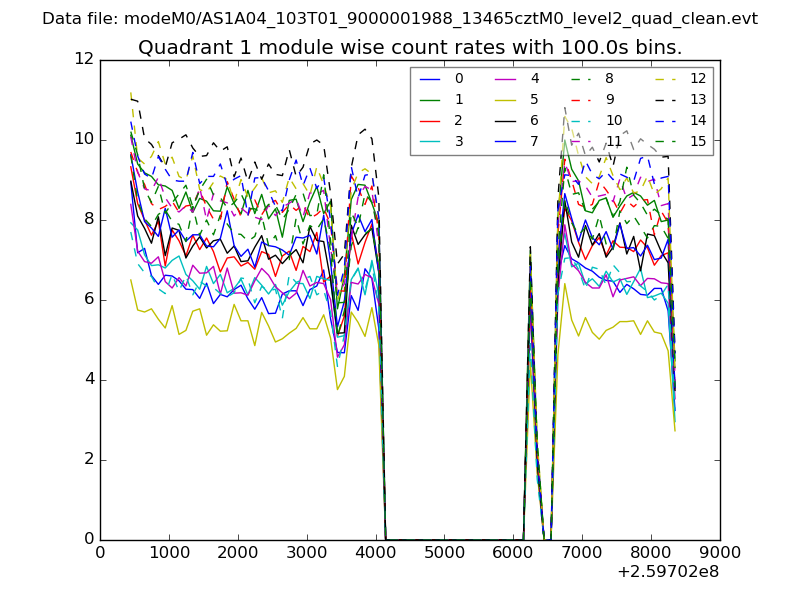
| Module-wise count rates for Quadrant A Data is divided into 100 sec bins |
 |
 |
| Module-wise count rates for Quadrant B Data is divided into 100 sec bins |
 |
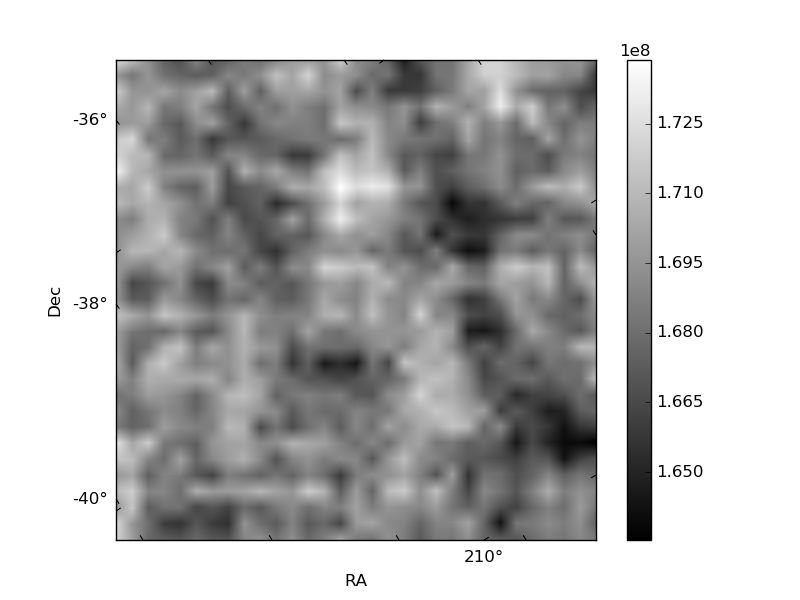 |
| Module-wise count rates for Quadrant C Data is divided into 100 sec bins |
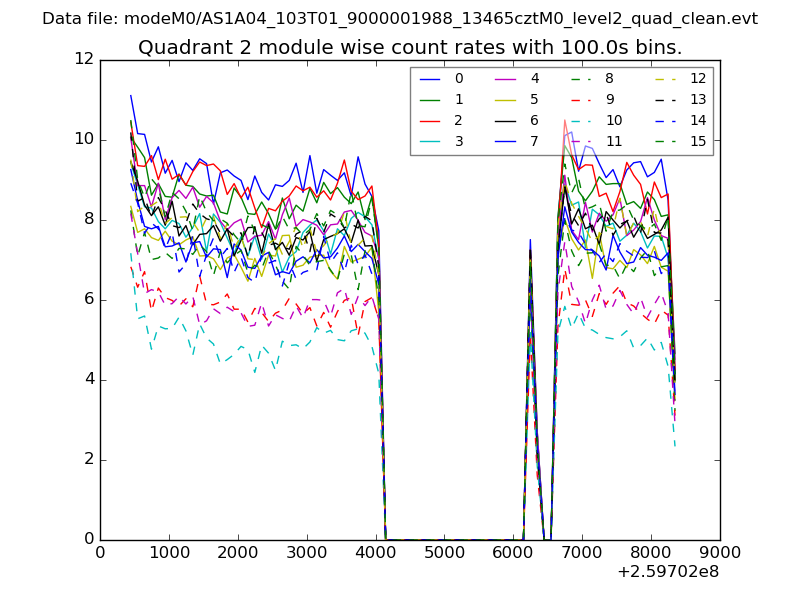 |
 |
| Module-wise count rates for Quadrant D Data is divided into 100 sec bins |
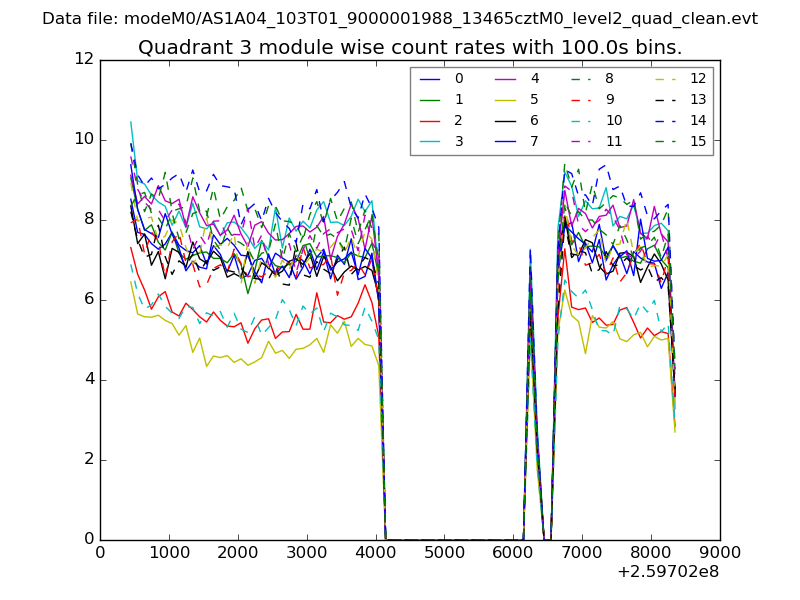 |
 |
| Parameter | Plot |
|---|---|
| CZT HV Monitor | 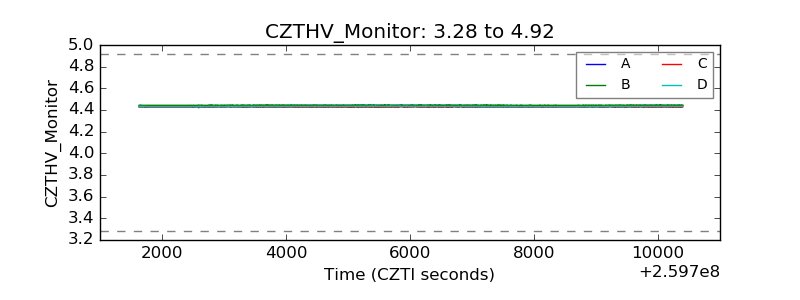 |
| D_VDD | 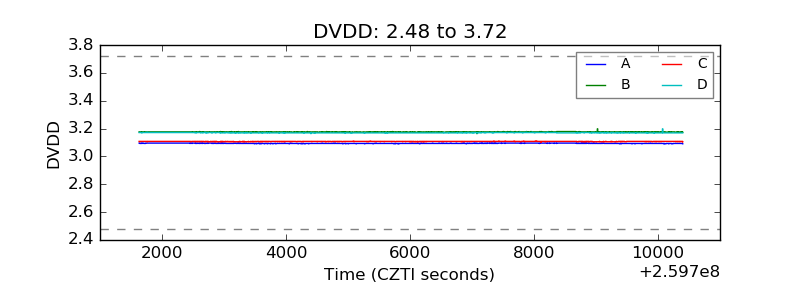 |
| Temperature 1 |  |
| Veto HV Monitor | 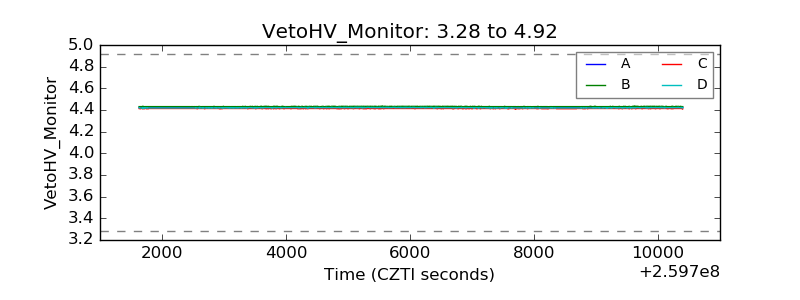 |
| Veto LLD |  |
| Alpha Counter | 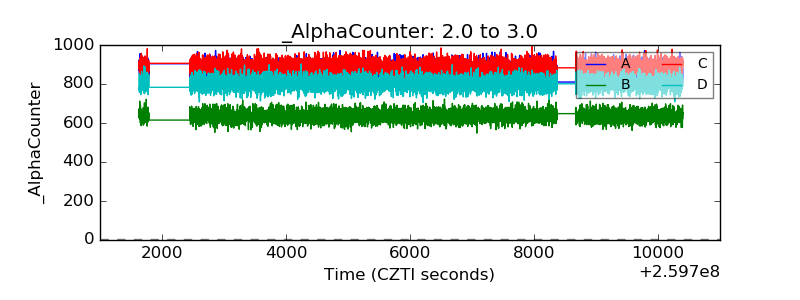 |
| _CPM_Rate | 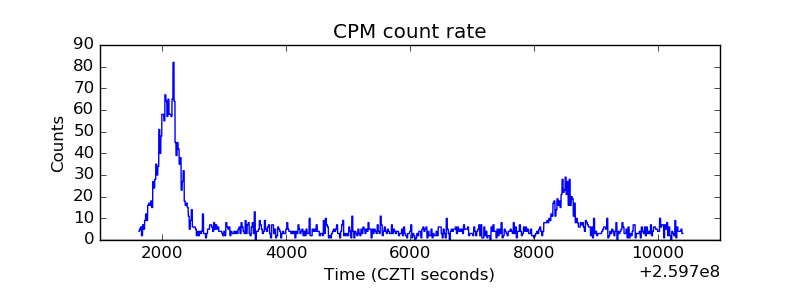 |
| CZT Counter | 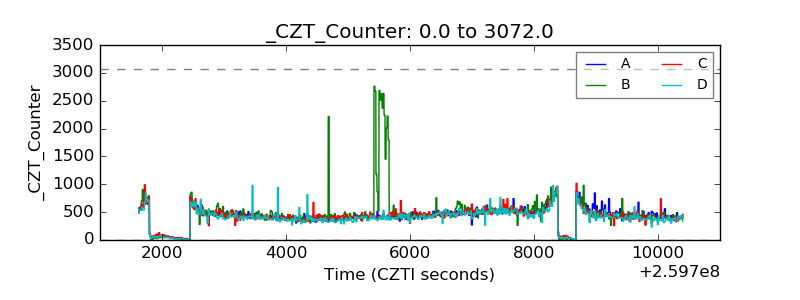 |
| +2.5 Volts monitor |  |
| +5 Volts monitor |  |
| _ROLL_ROT |  |
| _Roll_DEC | 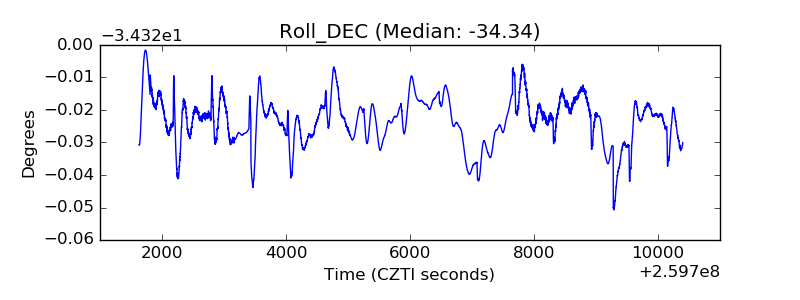 |
| _Roll_RA | 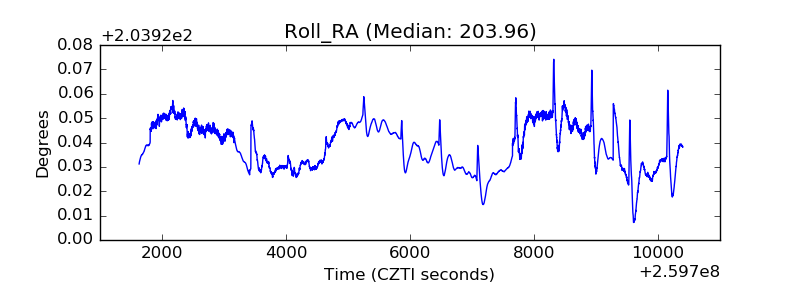 |
| Veto Counter | 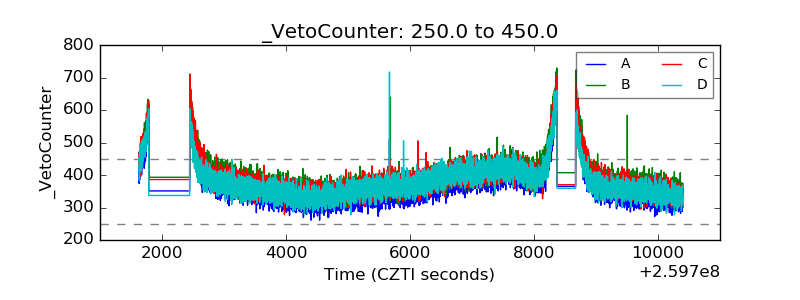 |