| Param | Original file | Final file |
|---|---|---|
| Filename | modeM0/AS1A04_103T01_9000001988_13469cztM0_level2.evt | modeM0/AS1A04_103T01_9000001988_13469cztM0_level2_quad_clean.evt |
| Size (bytes) | 1,240,914,240 | 247,285,440 |
| Size | 1.2 GB | 235.8 MB |
| Events in quadrant A | 8,918,785 | 1,550,621 |
| Events in quadrant B | 9,567,481 | 1,579,126 |
| Events in quadrant C | 8,897,245 | 1,537,865 |
| Events in quadrant D | 8,875,680 | 1,476,449 |
| Mode M0 | |||
|---|---|---|---|
| Quadrant | BADHDUFLAG | Total packets | Discarded packets |
| A | 0 | 39683 | 5 |
| B | 0 | 41045 | 4 |
| C | 0 | 39664 | 4 |
| D | 0 | 40541 | 4 |
| Mode SS | |||
|---|---|---|---|
| Quadrant | BADHDUFLAG | Total packets | Discarded packets |
| A | 0 | 398 | 0 |
| B | 0 | 398 | 0 |
| C | 0 | 398 | 0 |
| D | 0 | 398 | 0 |
| Mode M9 | |||
|---|---|---|---|
| Quadrant | BADHDUFLAG | Total packets | Discarded packets |
| A | 0 | 22 | 0 |
| B | 0 | 22 | 0 |
| C | 0 | 22 | 0 |
| D | 0 | 22 | 0 |
| Quadrant | Total seconds | Saturated seconds | Saturation percentage |
|---|---|---|---|
| A | 19538 | 50 | 0.255912% |
| B | 19538 | 162 | 0.829153% |
| C | 19538 | 63 | 0.322449% |
| D | 19538 | 68 | 0.348040% |
Noise dominated data is calculated using 1-second bins in cleaned event files. If a bin has >2000 counts, and if more than 50% of those come from <1% of pixels, then it is considered to be noise-dominated and hence unusable.
| Quadrant | # 1 sec bins | Bins with >0 counts | Bins with >2000 counts | High rate bins dominated by noise | Noise dominated (total time) | Noise dominated (detector-on time) | Marked lightcurve |
|---|---|---|---|---|---|---|---|
| A | 21715 | 19542 | 0 | 0 | 0.00% | 0.00% | 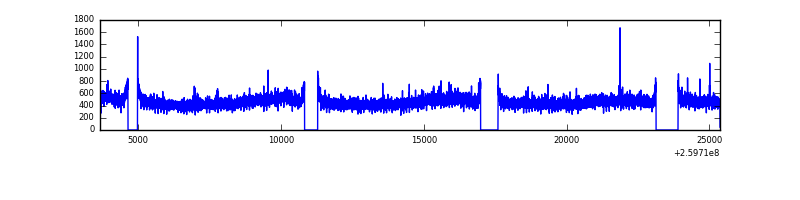 |
| B | 21715 | 19541 | 42 | 42 | 0.19% | 0.21% | 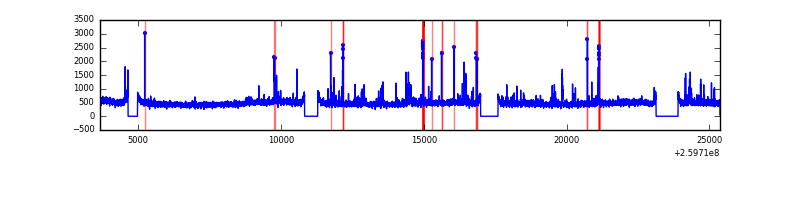 |
| C | 21715 | 19541 | 1 | 1 | 0.00% | 0.01% | 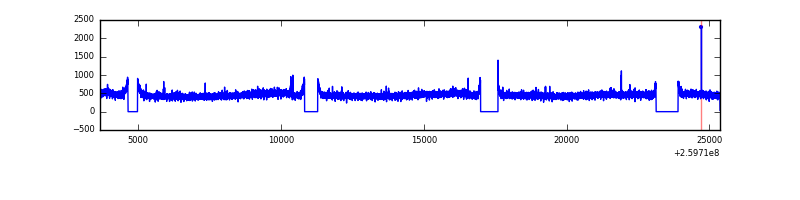 |
| D | 21715 | 19541 | 22 | 22 | 0.10% | 0.11% | 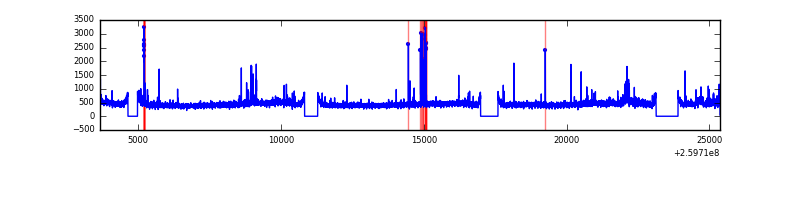 |
Top three noisy pixels from each quadrant. If the there are fewer than three noisy pixels in the level2.evt file, extra rows are filled as -1
| Pixel properties | Quadrant properties | ||||||
|---|---|---|---|---|---|---|---|
| Quadrant | DetID | PixID | Counts | Sigma | Mean | Median | Sigma |
| A | 1 | 162 | 45783 | 93.21 | 2299 | 2241 | 467.2 |
| A | 0 | 226 | 20368 | 38.8 | 2299 | 2241 | 467.2 |
| A | 12 | 194 | 17139 | 31.89 | 2299 | 2241 | 467.2 |
| B | 4 | 48 | 252104 | 572.61 | 2299 | 2242 | 436.4 |
| B | 0 | 214 | 128371 | 289.05 | 2299 | 2242 | 436.4 |
| B | 3 | 64 | 99472 | 222.82 | 2299 | 2242 | 436.4 |
| C | 3 | 233 | 93467 | 175.61 | 2247 | 2261 | 519.4 |
| C | 13 | 61 | 16026 | 26.5 | 2247 | 2261 | 519.4 |
| C | 8 | 128 | 14810 | 24.16 | 2247 | 2261 | 519.4 |
| D | 8 | 195 | 222389 | 412.44 | 2226 | 2164 | 534.0 |
| D | 12 | 110 | 134498 | 247.84 | 2226 | 2164 | 534.0 |
| D | 2 | 234 | 64195 | 116.17 | 2226 | 2164 | 534.0 |
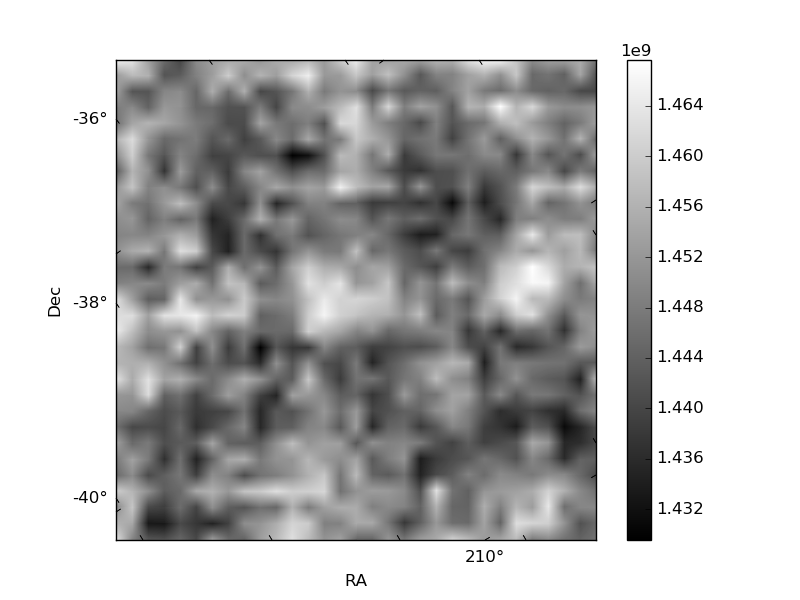
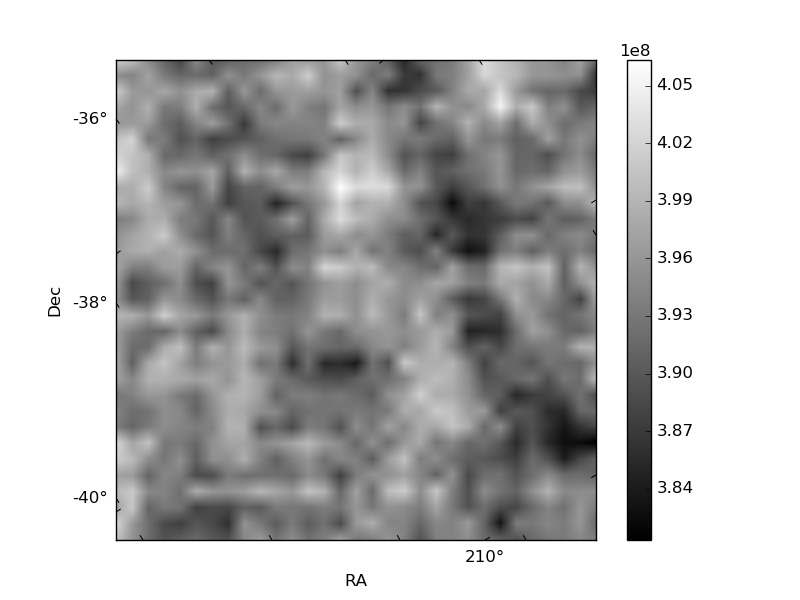
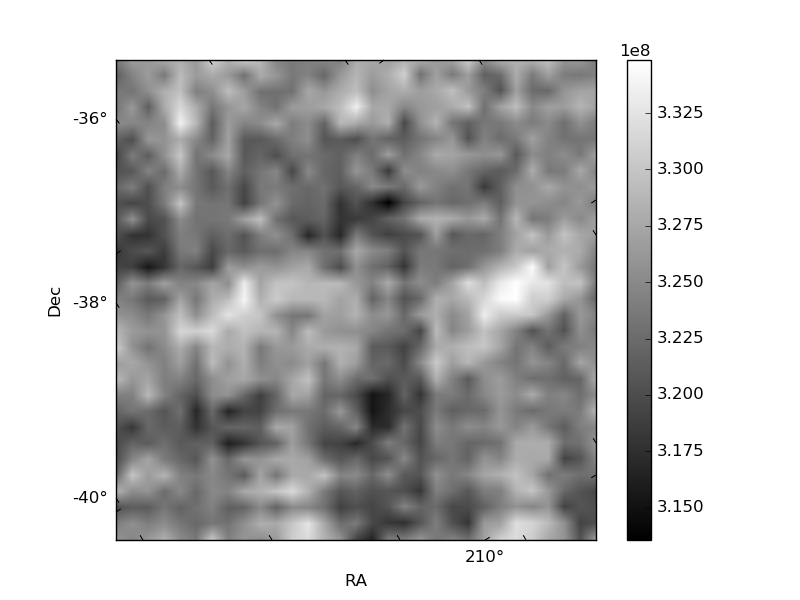
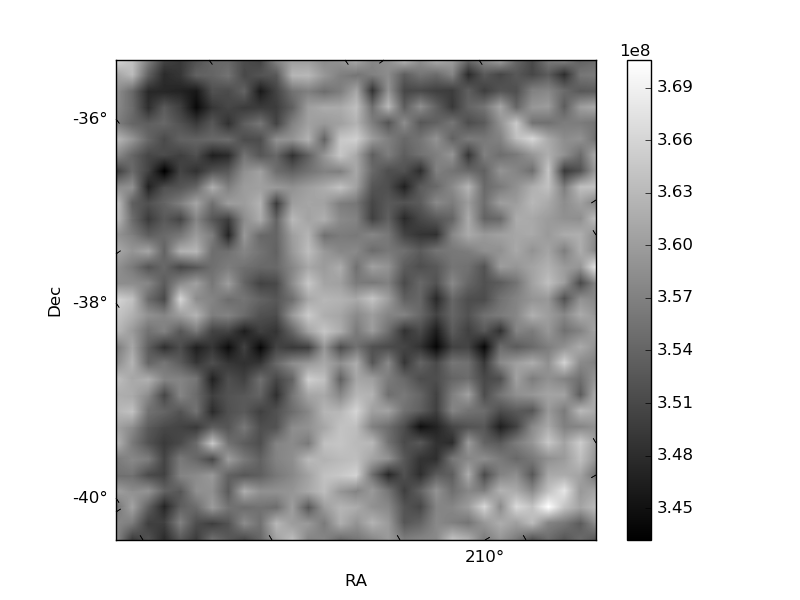
Histogram calculated using DETX and DETY for each event in the final _common_clean file
| Quadrant A | 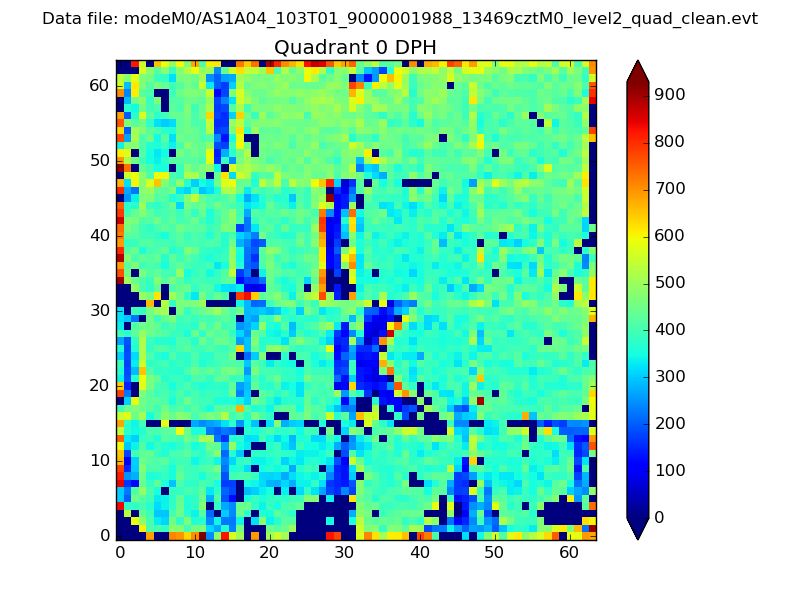 |
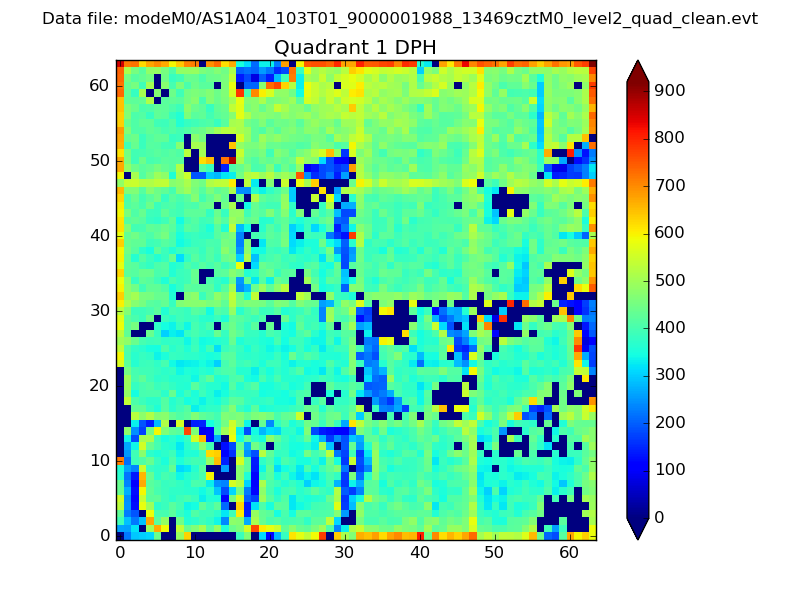 |
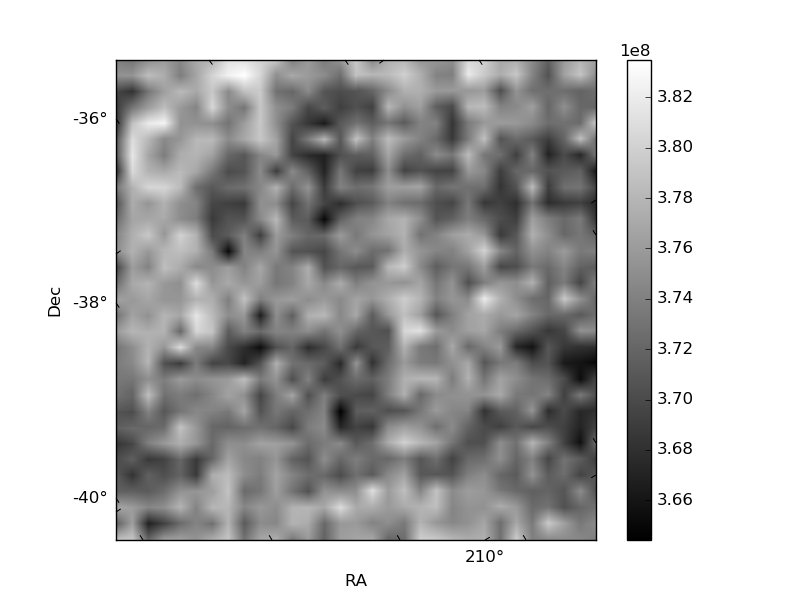
Quadrant B |
|---|---|---|---|
| Quadrant D |  |
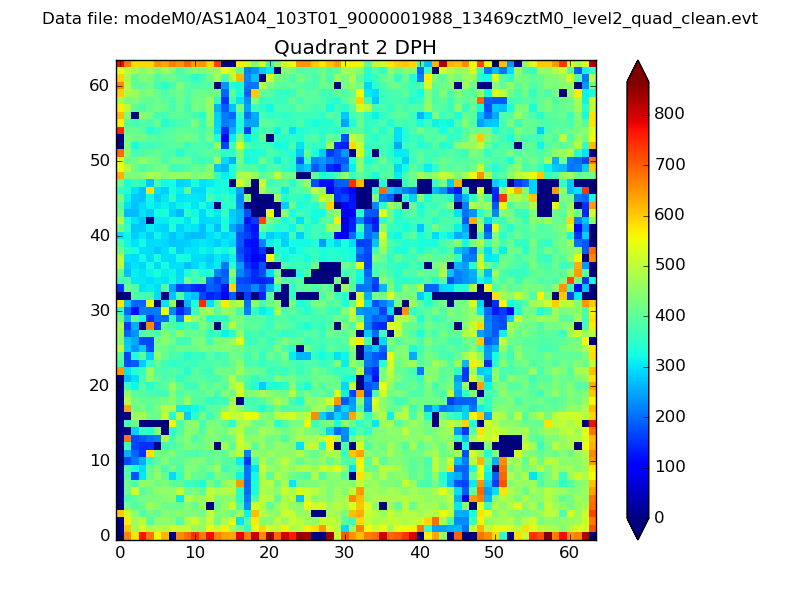 |
Quadrant C |
| Plot type | Count rate plots | Images |
|---|---|---|
| Comparison with Poisson distribution Blue bars denote a histogram of data divided into 1 sec bins. Red curve is a Poisson curve with rate = median count rate of data. |
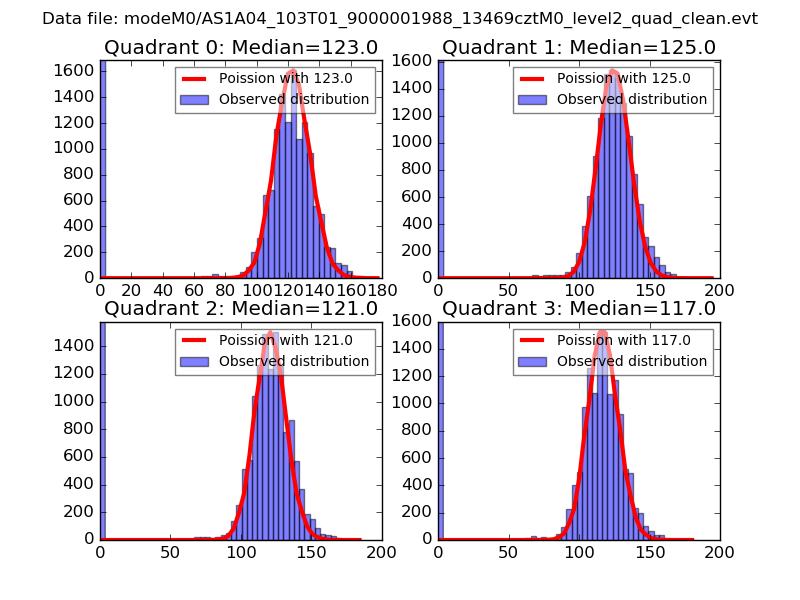 |
 |
| Quadrant-wise count rates Data is divided into 100 sec bins |
 |
|
| Module-wise count rates for Quadrant A Data is divided into 100 sec bins |
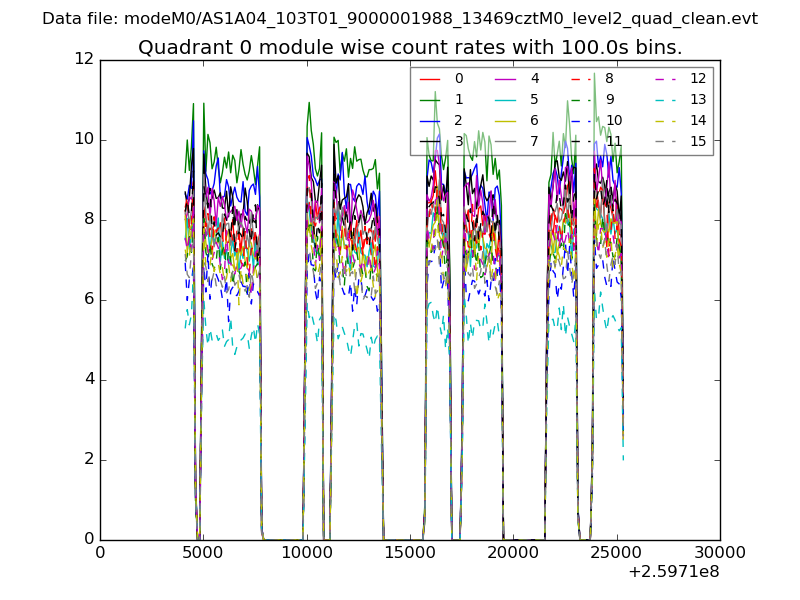 |
 |
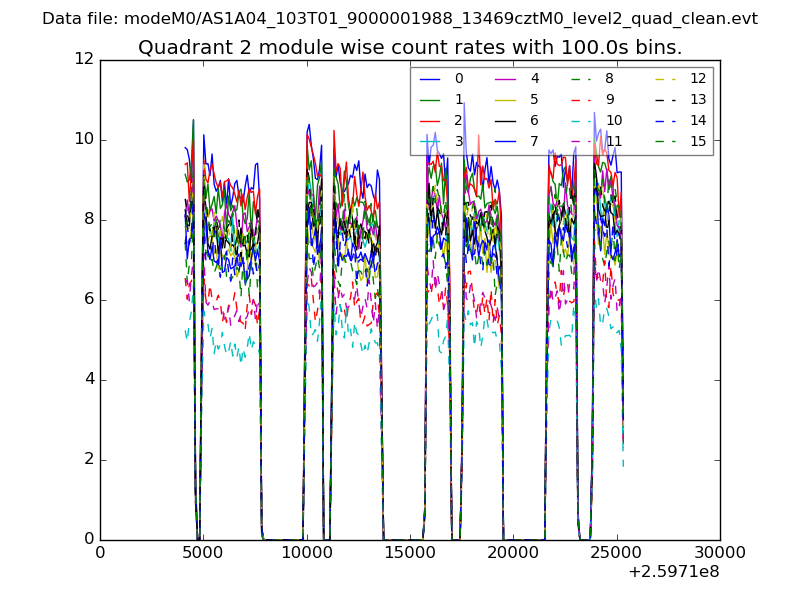
| Module-wise count rates for Quadrant B Data is divided into 100 sec bins |
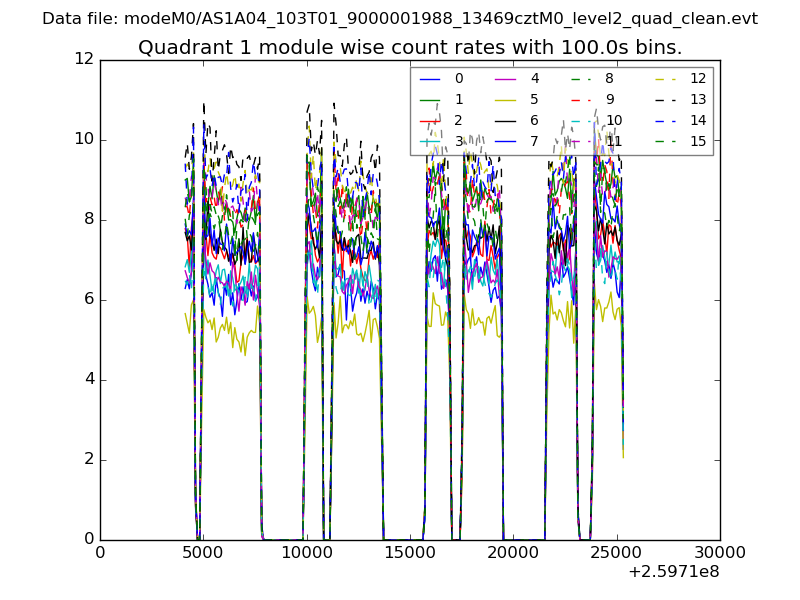 |
 |
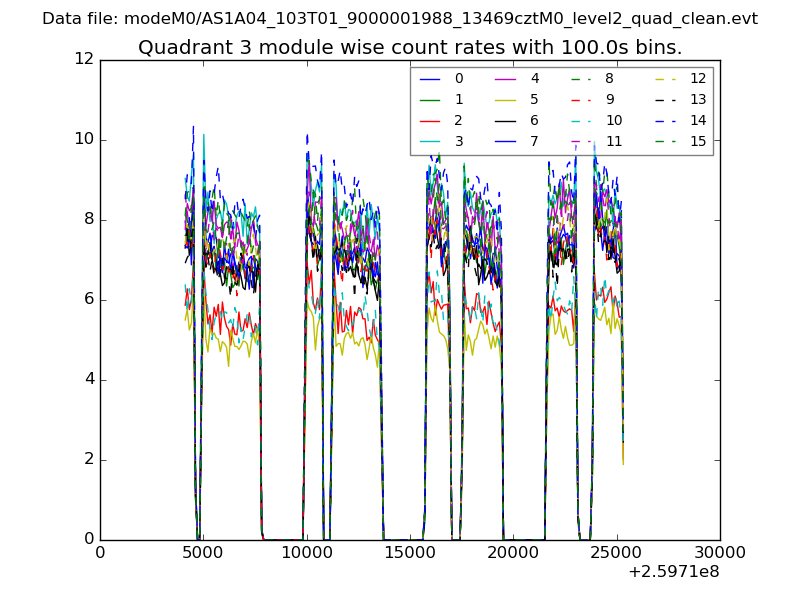
| Module-wise count rates for Quadrant C Data is divided into 100 sec bins |
 |
 |
| Module-wise count rates for Quadrant D Data is divided into 100 sec bins |
 |
 |
| Parameter | Plot |
|---|---|
| CZT HV Monitor | 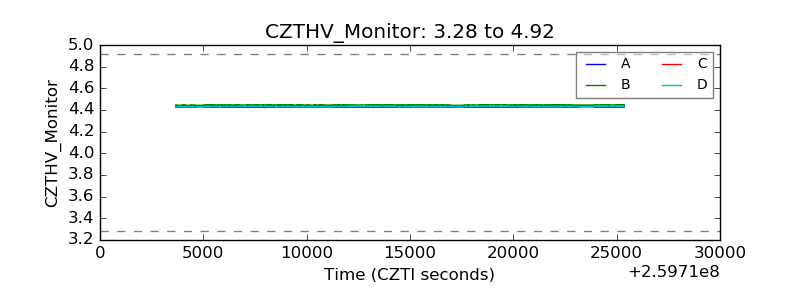 |
| D_VDD | 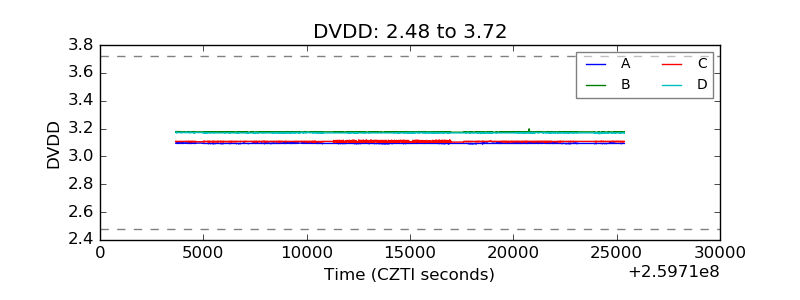 |
| Temperature 1 | 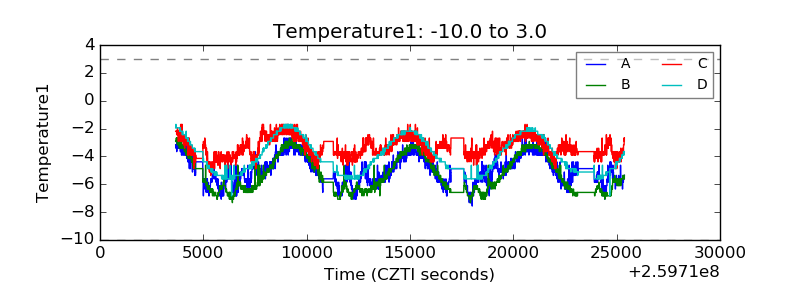 |
| Veto HV Monitor | 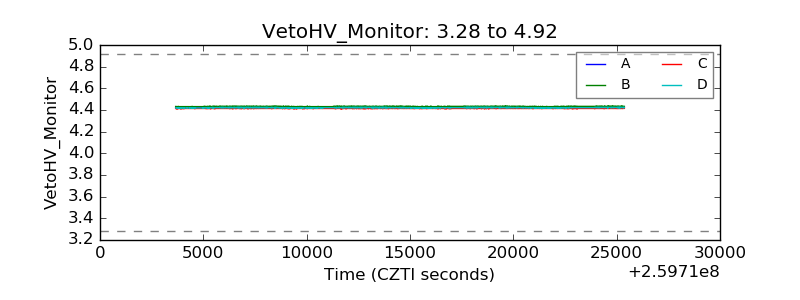 |
| Veto LLD | 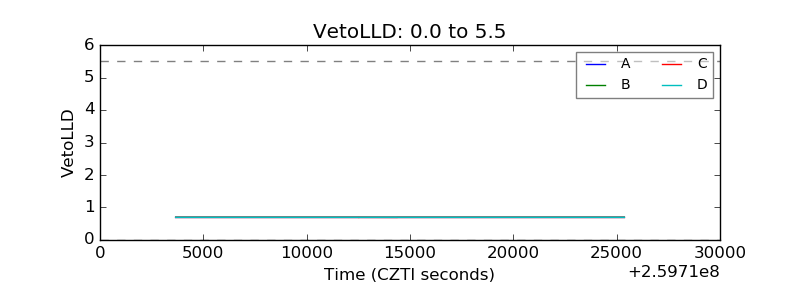 |
| Alpha Counter | 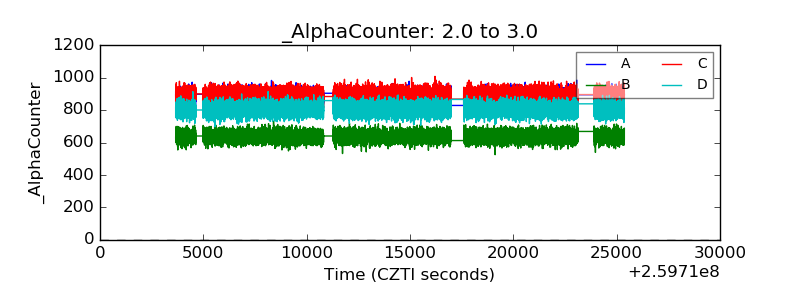 |
| _CPM_Rate | 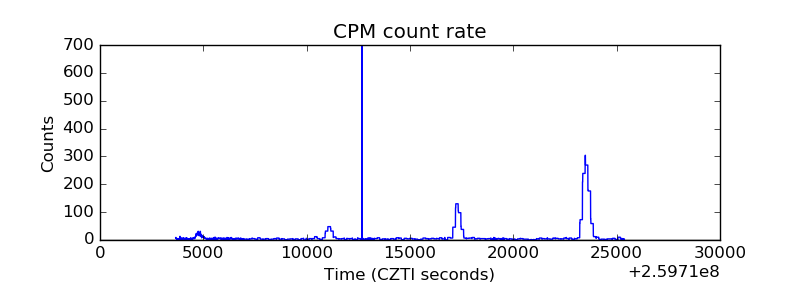 |
| CZT Counter | 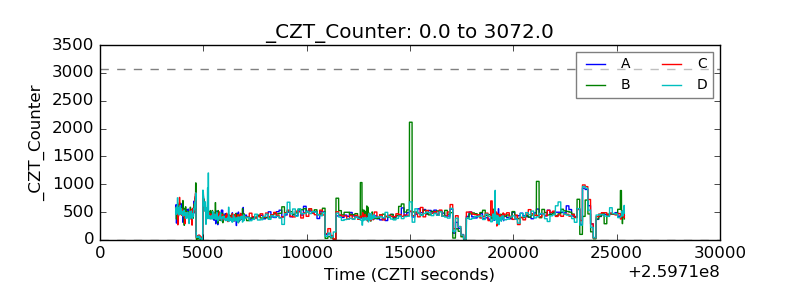 |
| +2.5 Volts monitor |  |
| +5 Volts monitor |  |
| _ROLL_ROT | 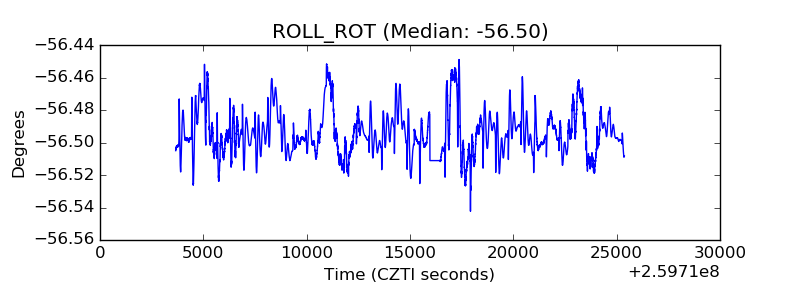 |
| _Roll_DEC | 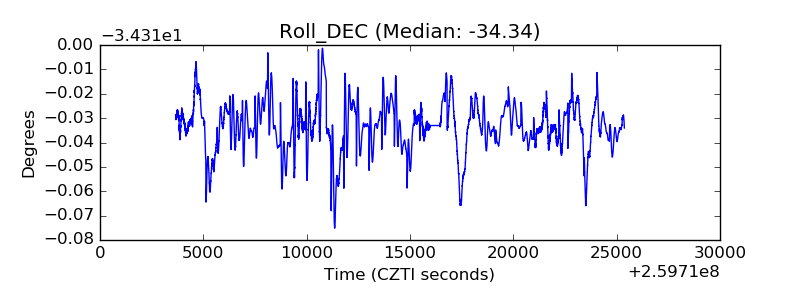 |
| _Roll_RA | 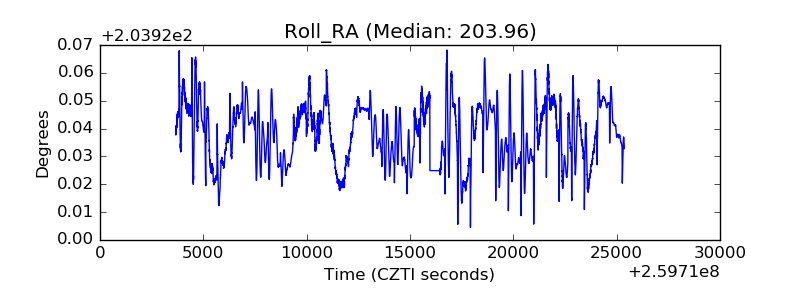 |
| Veto Counter | 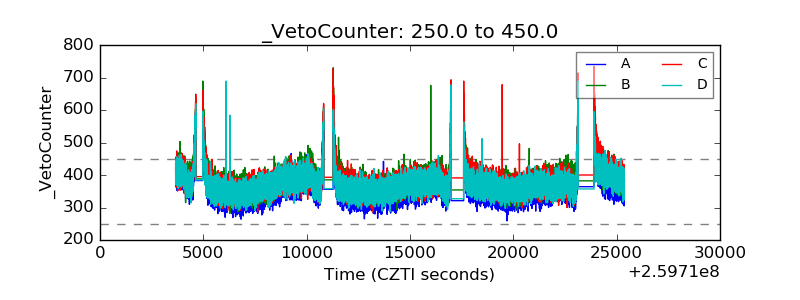 |