| Param | Original file | Final file |
|---|---|---|
| Filename | modeM0/AS1A04_103T01_9000001988_13470cztM0_level2.evt | modeM0/AS1A04_103T01_9000001988_13470cztM0_level2_quad_clean.evt |
| Size (bytes) | 446,777,280 | 89,832,960 |
| Size | 426.1 MB | 85.7 MB |
| Events in quadrant A | 3,161,893 | 563,266 |
| Events in quadrant B | 3,477,140 | 576,268 |
| Events in quadrant C | 3,191,962 | 565,009 |
| Events in quadrant D | 3,236,193 | 540,766 |
| Mode M0 | |||
|---|---|---|---|
| Quadrant | BADHDUFLAG | Total packets | Discarded packets |
| A | 0 | 13899 | 3 |
| B | 0 | 14577 | 2 |
| C | 0 | 13953 | 2 |
| D | 0 | 14328 | 2 |
| Mode SS | |||
|---|---|---|---|
| Quadrant | BADHDUFLAG | Total packets | Discarded packets |
| A | 0 | 140 | 0 |
| B | 0 | 140 | 0 |
| C | 0 | 140 | 0 |
| D | 0 | 140 | 0 |
| Mode M9 | |||
|---|---|---|---|
| Quadrant | BADHDUFLAG | Total packets | Discarded packets |
| A | 0 | 17 | 0 |
| B | 0 | 17 | 0 |
| C | 0 | 17 | 0 |
| D | 0 | 17 | 0 |
| Quadrant | Total seconds | Saturated seconds | Saturation percentage |
|---|---|---|---|
| A | 6817 | 56 | 0.821476% |
| B | 6817 | 93 | 1.364236% |
| C | 6817 | 62 | 0.909491% |
| D | 6817 | 53 | 0.777468% |
Noise dominated data is calculated using 1-second bins in cleaned event files. If a bin has >2000 counts, and if more than 50% of those come from <1% of pixels, then it is considered to be noise-dominated and hence unusable.
| Quadrant | # 1 sec bins | Bins with >0 counts | Bins with >2000 counts | High rate bins dominated by noise | Noise dominated (total time) | Noise dominated (detector-on time) | Marked lightcurve |
|---|---|---|---|---|---|---|---|
| A | 8494 | 6818 | 0 | 0 | 0.00% | 0.00% | 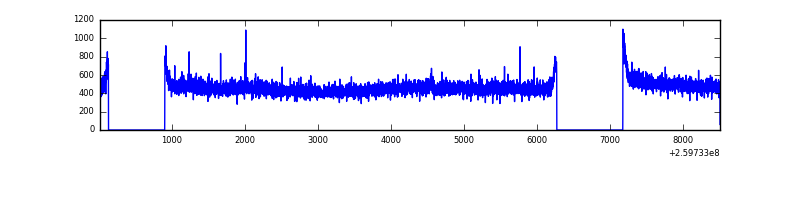 |
| B | 8494 | 6818 | 15 | 15 | 0.18% | 0.22% | 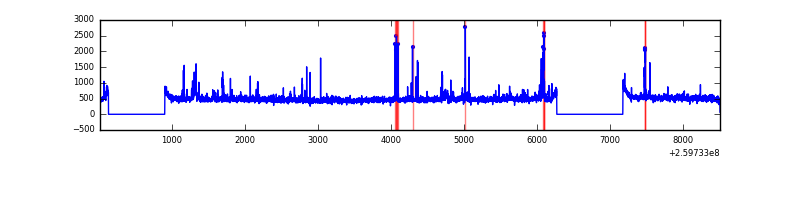 |
| C | 8494 | 6818 | 4 | 4 | 0.05% | 0.06% | 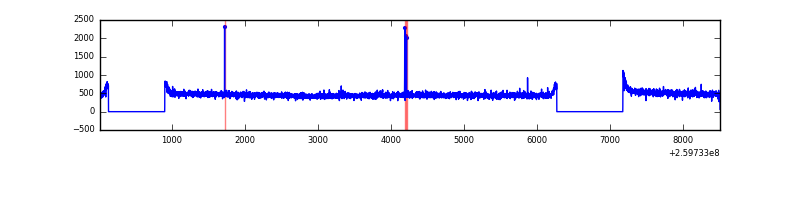 |
| D | 8494 | 6818 | 7 | 7 | 0.08% | 0.10% | 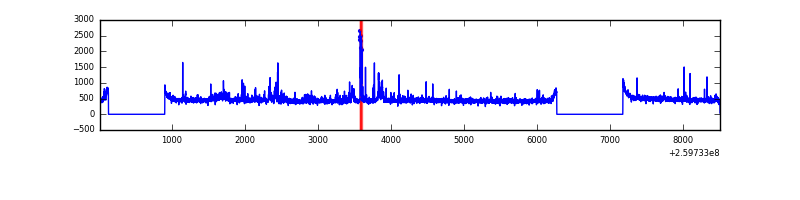 |
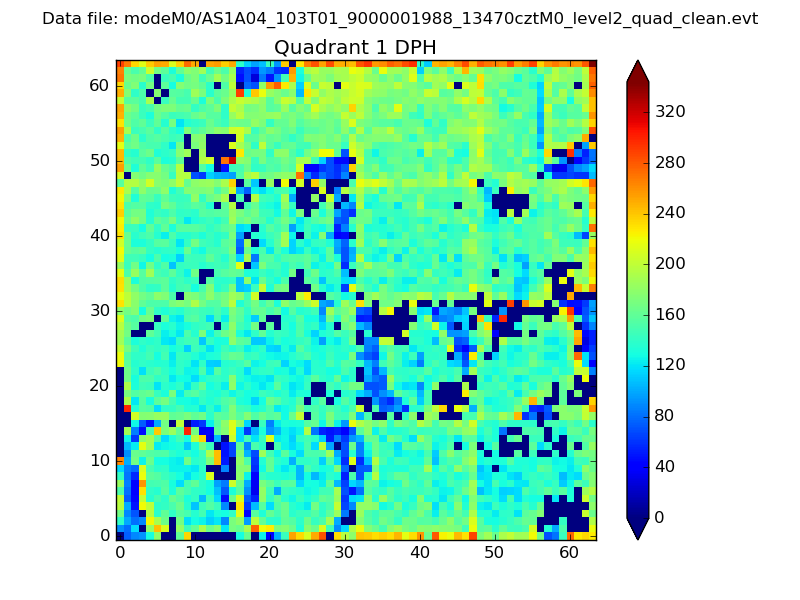
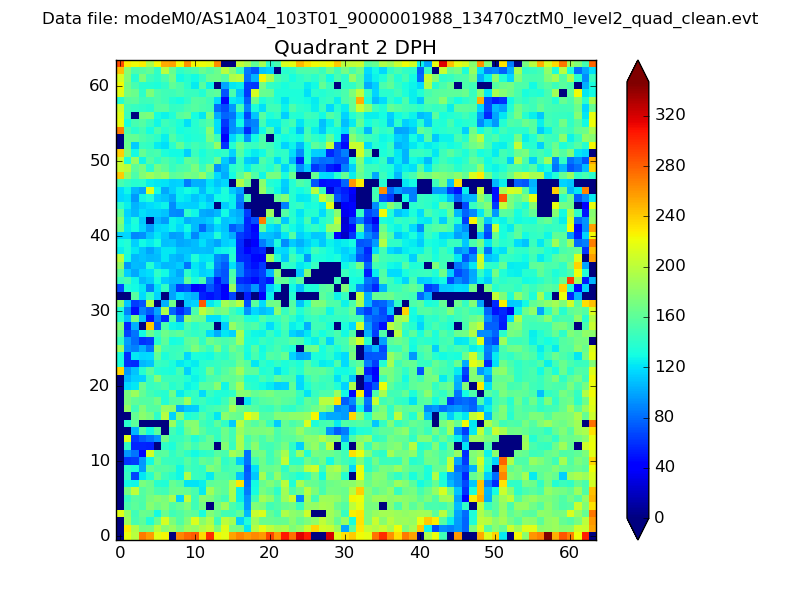
Top three noisy pixels from each quadrant. If the there are fewer than three noisy pixels in the level2.evt file, extra rows are filled as -1
| Pixel properties | Quadrant properties | ||||||
|---|---|---|---|---|---|---|---|
| Quadrant | DetID | PixID | Counts | Sigma | Mean | Median | Sigma |
| A | 1 | 162 | 7653 | 40.92 | 818 | 797 | 167.6 |
| A | 0 | 226 | 7227 | 38.37 | 818 | 797 | 167.6 |
| A | 8 | 15 | 6949 | 36.71 | 818 | 797 | 167.6 |
| B | 4 | 48 | 125994 | 801.42 | 815 | 793 | 156.2 |
| B | 10 | 252 | 75875 | 480.61 | 815 | 793 | 156.2 |
| B | 3 | 64 | 45737 | 287.69 | 815 | 793 | 156.2 |
| C | 3 | 233 | 36576 | 192.07 | 803 | 809 | 186.2 |
| C | 14 | 234 | 16489 | 84.2 | 803 | 809 | 186.2 |
| C | 10 | 9 | 5963 | 27.68 | 803 | 809 | 186.2 |
| D | 8 | 195 | 153778 | 809.37 | 795 | 773 | 189.0 |
| D | 13 | 249 | 46205 | 240.33 | 795 | 773 | 189.0 |
| D | 2 | 234 | 20134 | 102.41 | 795 | 773 | 189.0 |
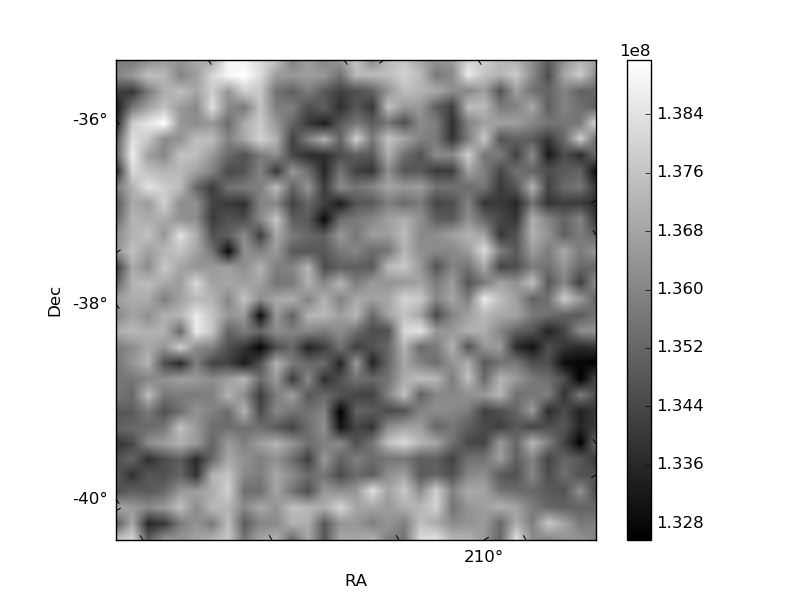
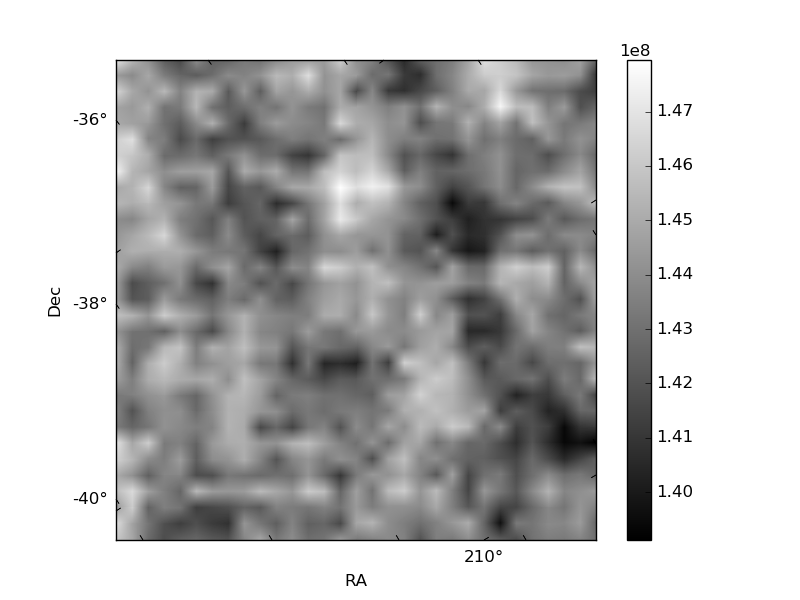
Histogram calculated using DETX and DETY for each event in the final _common_clean file
| Quadrant A | 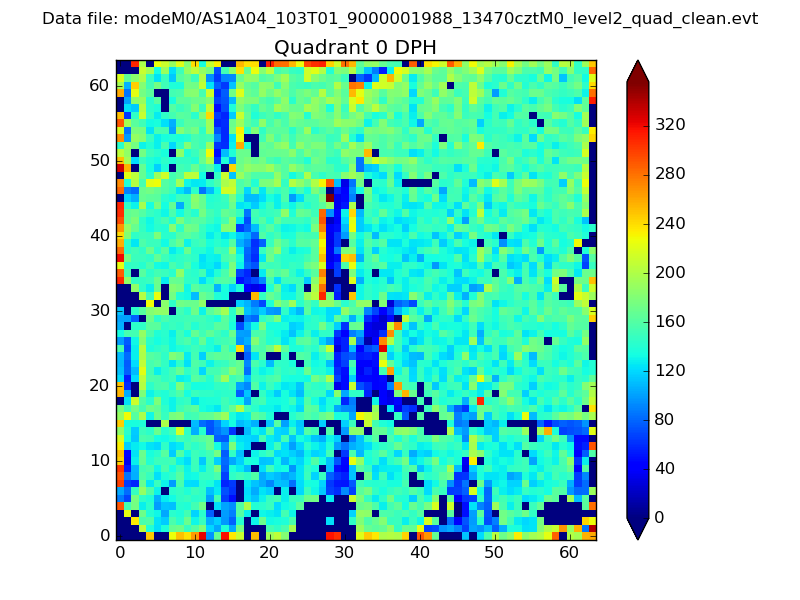 |
 |
Quadrant B |
|---|---|---|---|
| Quadrant D | 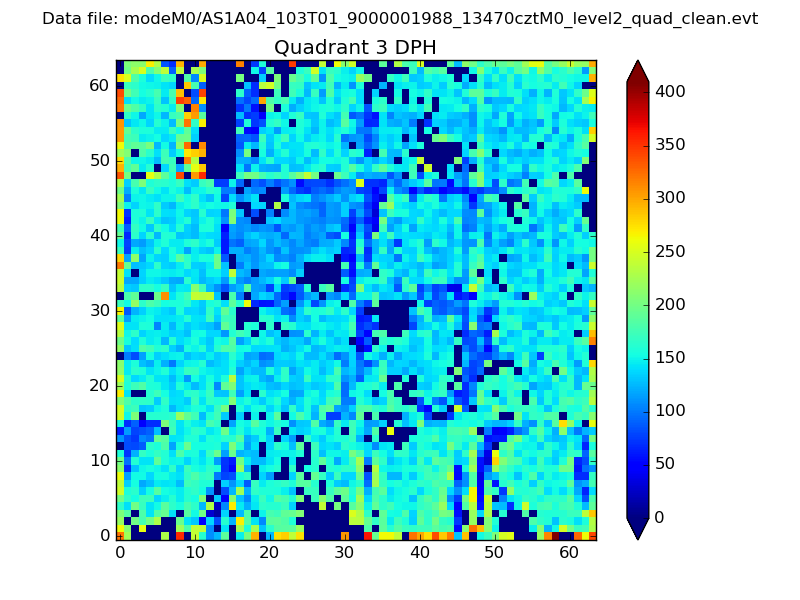 |
 |
Quadrant C |
| Plot type | Count rate plots | Images |
|---|---|---|
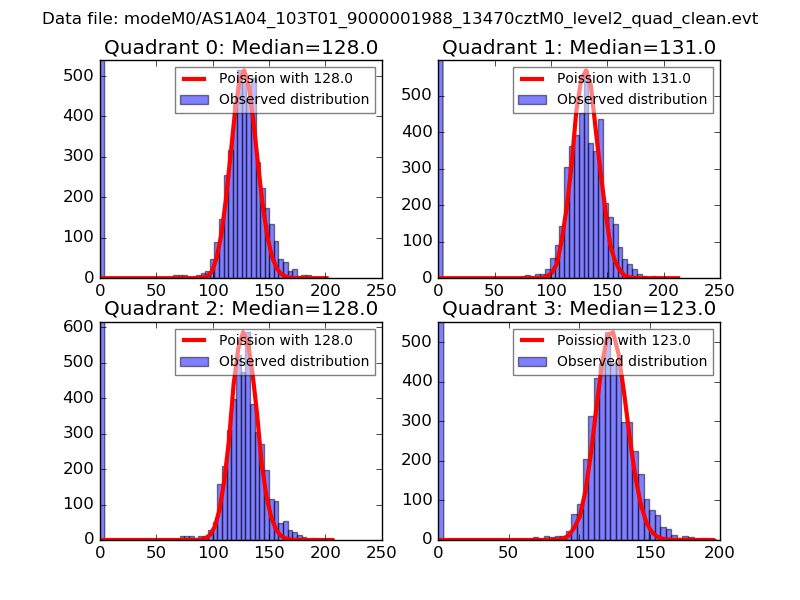
| Comparison with Poisson distribution Blue bars denote a histogram of data divided into 1 sec bins. Red curve is a Poisson curve with rate = median count rate of data. |
 |
 |
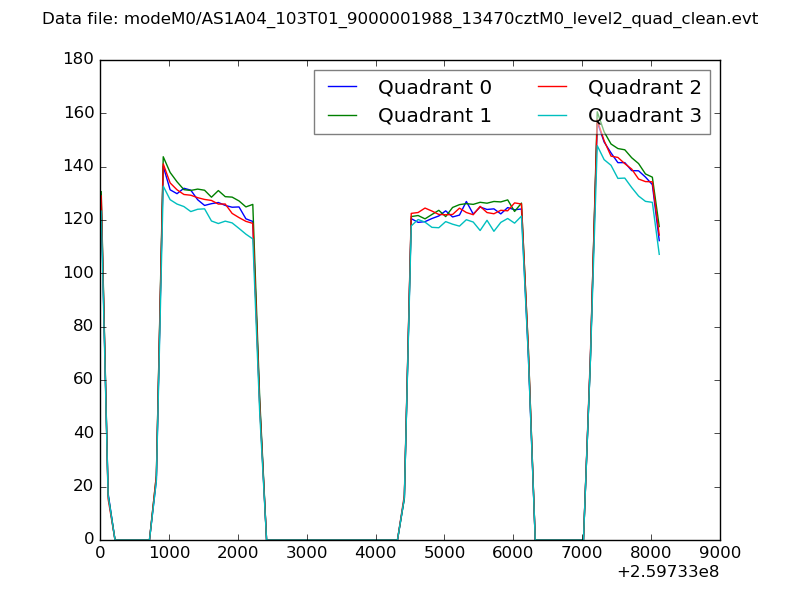
| Quadrant-wise count rates Data is divided into 100 sec bins |
 |
|
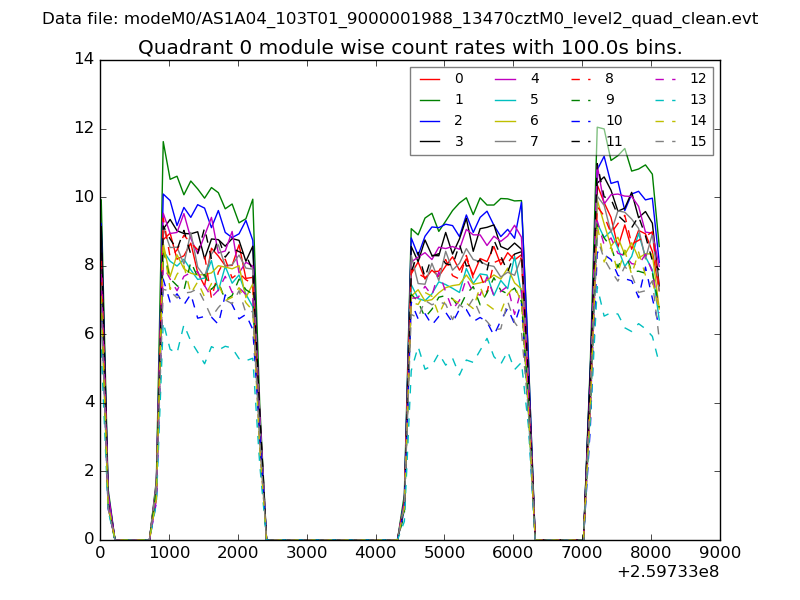
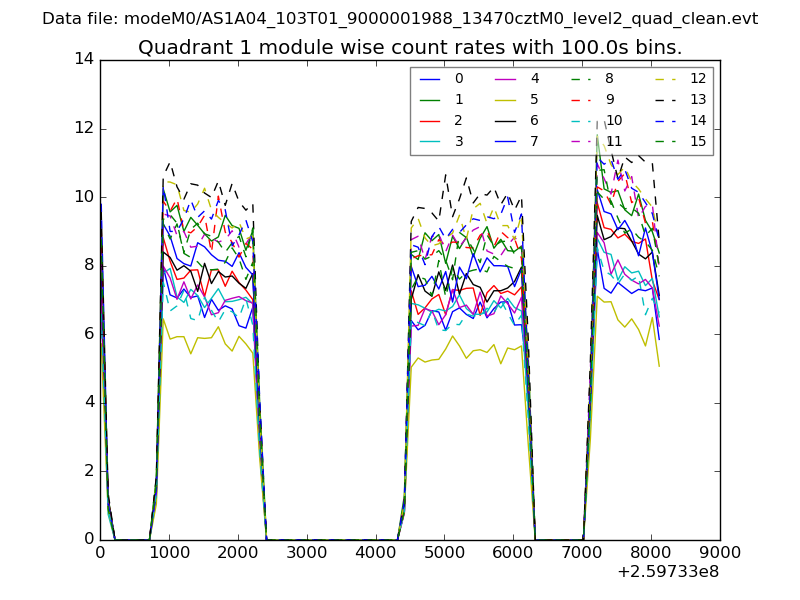
| Module-wise count rates for Quadrant A Data is divided into 100 sec bins |
 |
 |
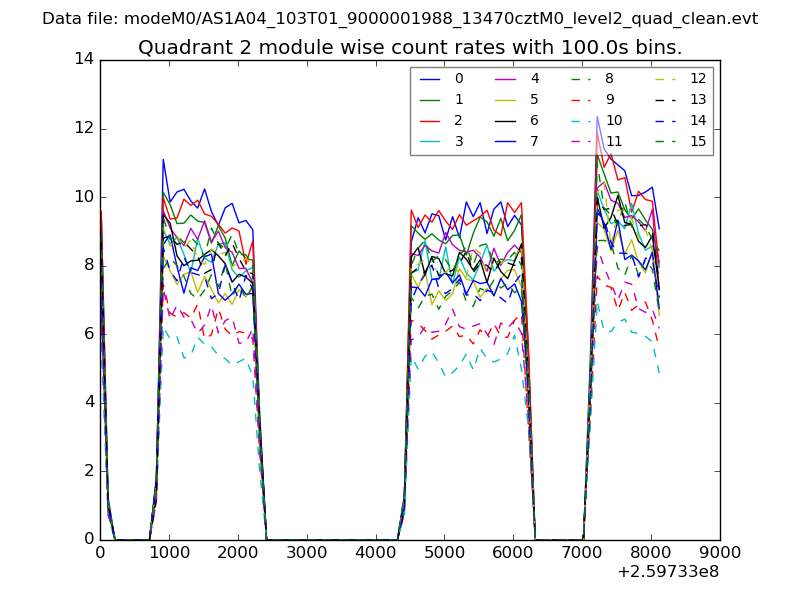
| Module-wise count rates for Quadrant B Data is divided into 100 sec bins |
 |
 |
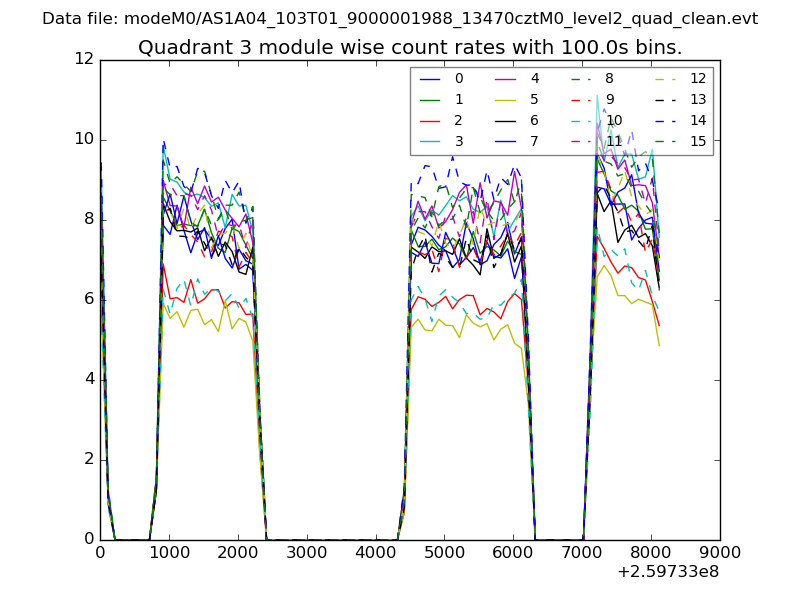
| Module-wise count rates for Quadrant C Data is divided into 100 sec bins |
 |
 |
| Module-wise count rates for Quadrant D Data is divided into 100 sec bins |
 |
 |
| Parameter | Plot |
|---|---|
| CZT HV Monitor | 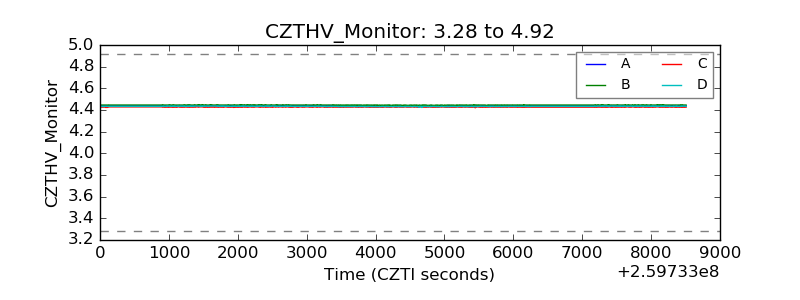 |
| D_VDD | 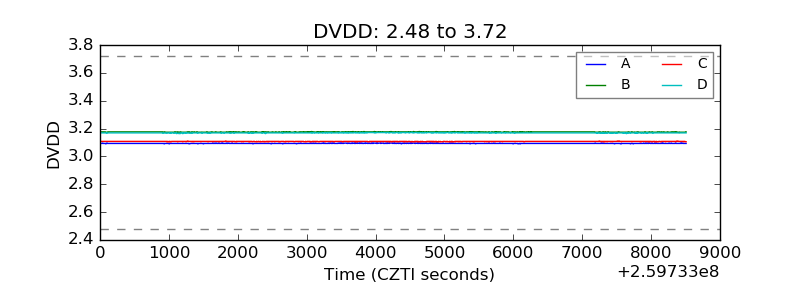 |
| Temperature 1 | 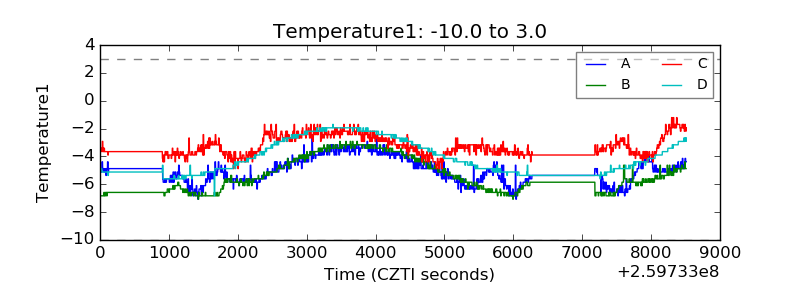 |
| Veto HV Monitor | 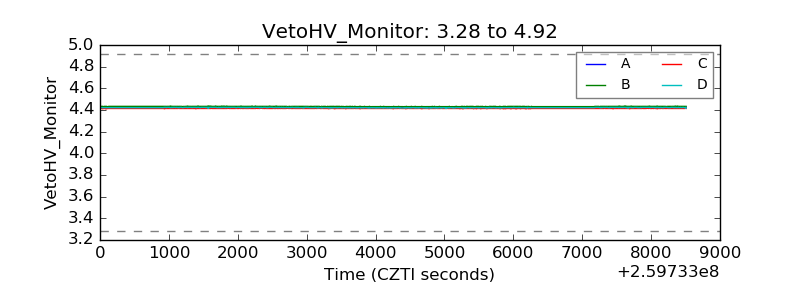 |
| Veto LLD | 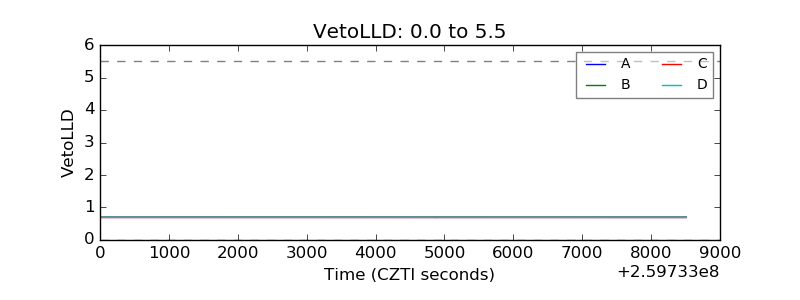 |
| Alpha Counter |  |
| _CPM_Rate | 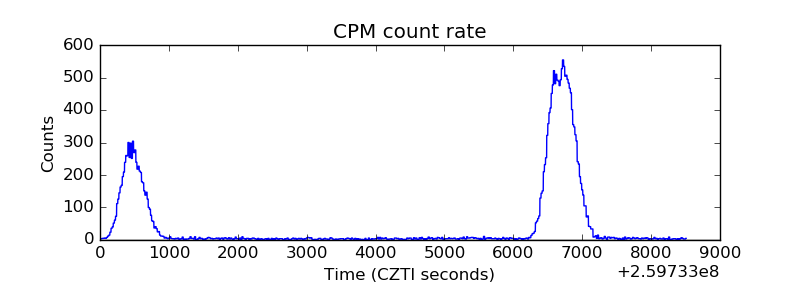 |
| CZT Counter | 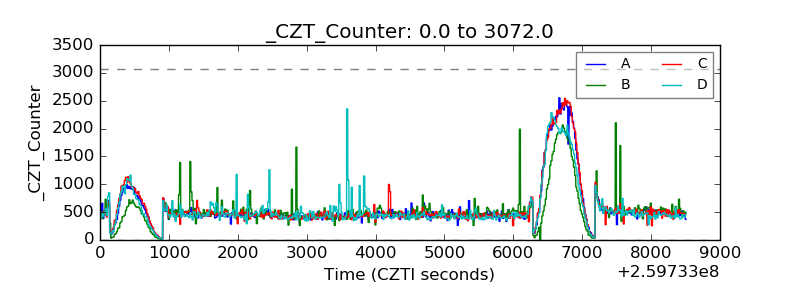 |
| +2.5 Volts monitor |  |
| +5 Volts monitor |  |
| _ROLL_ROT | 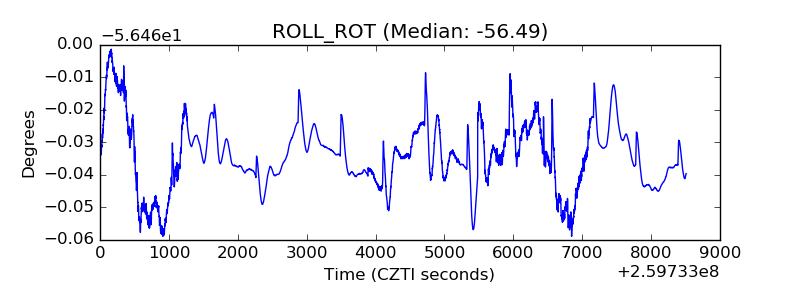 |
| _Roll_DEC | 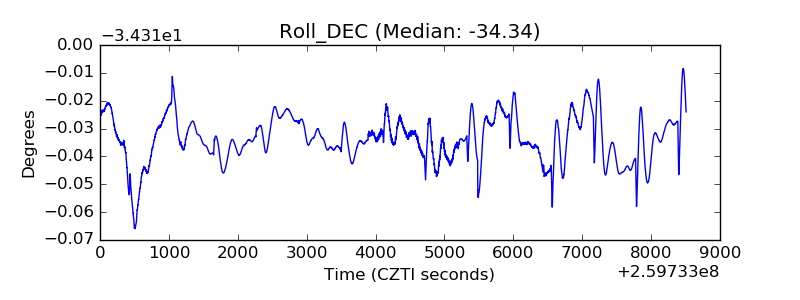 |
| _Roll_RA | 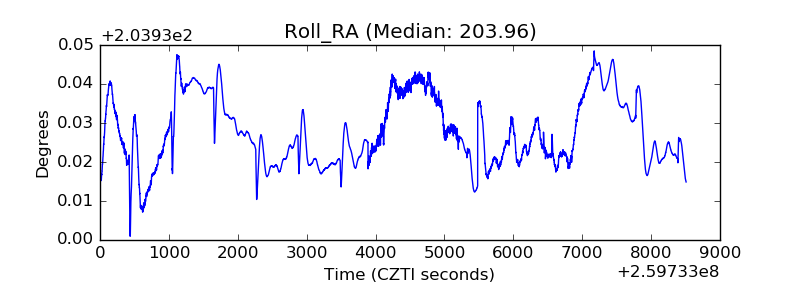 |
| Veto Counter | 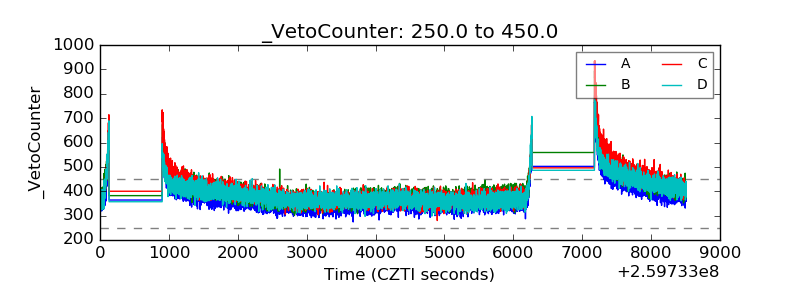 |