| Param | Original file | Final file |
|---|---|---|
| Filename | modeM0/AS1A04_103T01_9000001988_13472cztM0_level2.evt | modeM0/AS1A04_103T01_9000001988_13472cztM0_level2_quad_clean.evt |
| Size (bytes) | 403,024,320 | 71,228,160 |
| Size | 384.4 MB | 67.9 MB |
| Events in quadrant A | 2,880,965 | 436,269 |
| Events in quadrant B | 3,021,966 | 444,697 |
| Events in quadrant C | 2,911,607 | 436,513 |
| Events in quadrant D | 2,975,884 | 413,297 |
| Mode M0 | |||
|---|---|---|---|
| Quadrant | BADHDUFLAG | Total packets | Discarded packets |
| A | 0 | 12525 | 2 |
| B | 0 | 12843 | 1 |
| C | 0 | 12607 | 1 |
| D | 0 | 12956 | 1 |
| Mode SS | |||
|---|---|---|---|
| Quadrant | BADHDUFLAG | Total packets | Discarded packets |
| A | 0 | 126 | 0 |
| B | 0 | 126 | 0 |
| C | 0 | 126 | 0 |
| D | 0 | 126 | 0 |
| Mode M9 | |||
|---|---|---|---|
| Quadrant | BADHDUFLAG | Total packets | Discarded packets |
| A | 0 | 10 | 0 |
| B | 0 | 10 | 0 |
| C | 0 | 10 | 0 |
| D | 0 | 10 | 0 |
| Quadrant | Total seconds | Saturated seconds | Saturation percentage |
|---|---|---|---|
| A | 6094 | 47 | 0.771250% |
| B | 6094 | 66 | 1.083032% |
| C | 6094 | 46 | 0.754841% |
| D | 6094 | 96 | 1.575320% |
Noise dominated data is calculated using 1-second bins in cleaned event files. If a bin has >2000 counts, and if more than 50% of those come from <1% of pixels, then it is considered to be noise-dominated and hence unusable.
| Quadrant | # 1 sec bins | Bins with >0 counts | Bins with >2000 counts | High rate bins dominated by noise | Noise dominated (total time) | Noise dominated (detector-on time) | Marked lightcurve |
|---|---|---|---|---|---|---|---|
| A | 7140 | 6095 | 0 | 0 | 0.00% | 0.00% | 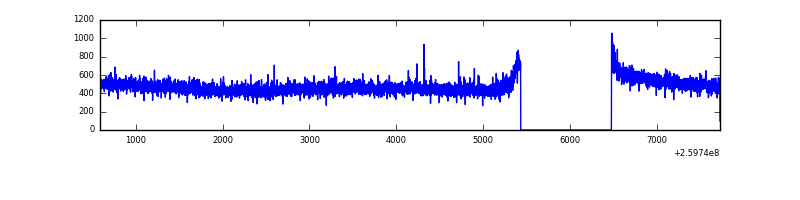 |
| B | 7140 | 6095 | 1 | 1 | 0.01% | 0.02% | 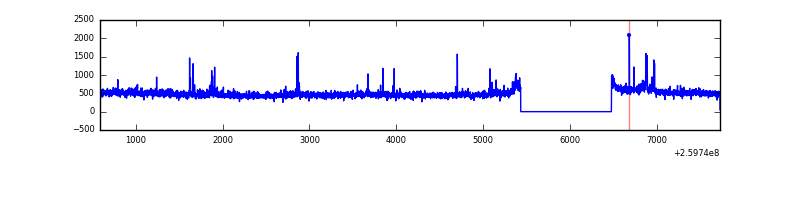 |
| C | 7140 | 6095 | 0 | 0 | 0.00% | 0.00% | 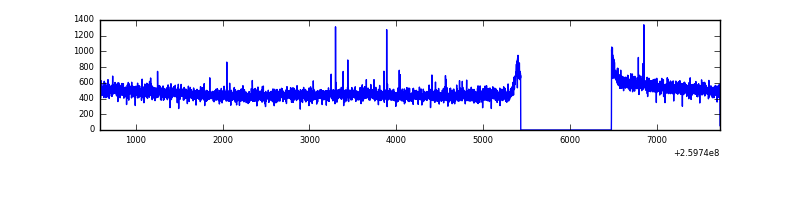 |
| D | 7140 | 6095 | 41 | 41 | 0.57% | 0.67% | 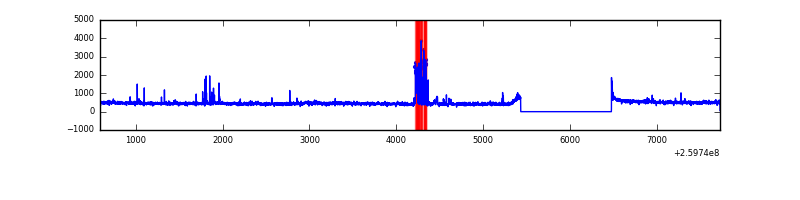 |
Top three noisy pixels from each quadrant. If the there are fewer than three noisy pixels in the level2.evt file, extra rows are filled as -1
| Pixel properties | Quadrant properties | ||||||
|---|---|---|---|---|---|---|---|
| Quadrant | DetID | PixID | Counts | Sigma | Mean | Median | Sigma |
| A | 8 | 15 | 16371 | 103.46 | 743 | 726 | 151.2 |
| A | 0 | 226 | 6674 | 39.33 | 743 | 726 | 151.2 |
| A | 1 | 162 | 5816 | 33.66 | 743 | 726 | 151.2 |
| B | 3 | 64 | 43295 | 303.5 | 740 | 721 | 140.3 |
| B | 4 | 48 | 40039 | 280.29 | 740 | 721 | 140.3 |
| B | 0 | 214 | 24146 | 166.99 | 740 | 721 | 140.3 |
| C | 3 | 233 | 45702 | 270.09 | 729 | 734 | 166.5 |
| C | 0 | 207 | 21557 | 125.07 | 729 | 734 | 166.5 |
| C | 13 | 61 | 5144 | 26.49 | 729 | 734 | 166.5 |
| D | 9 | 85 | 151554 | 874.76 | 721 | 699 | 172.5 |
| D | 8 | 195 | 39910 | 227.37 | 721 | 699 | 172.5 |
| D | 13 | 249 | 27005 | 152.54 | 721 | 699 | 172.5 |
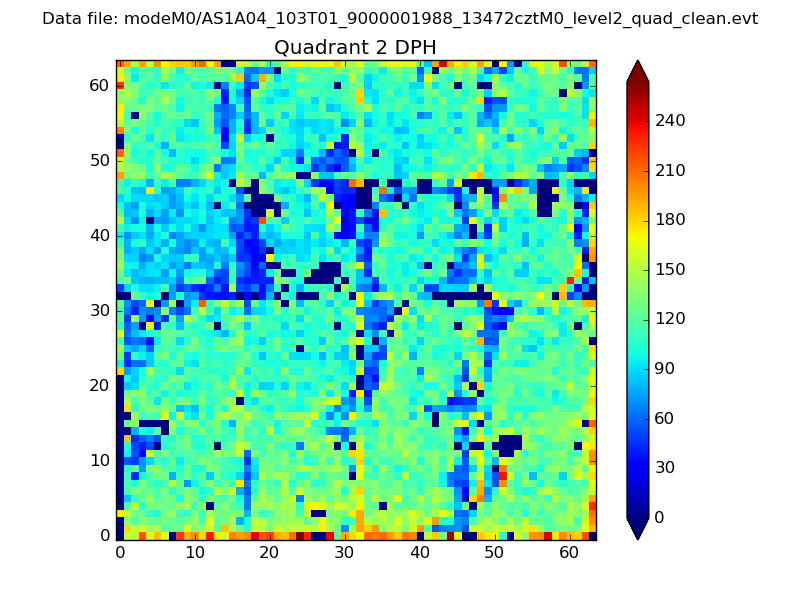
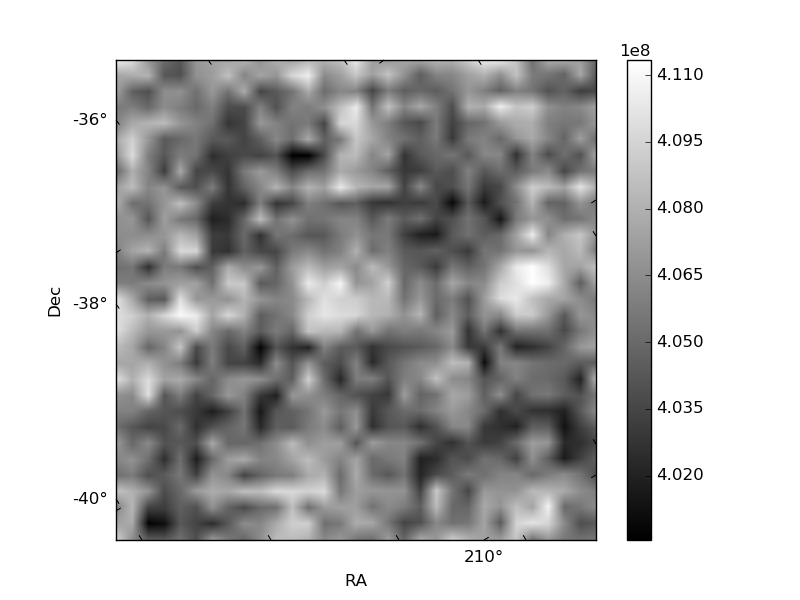
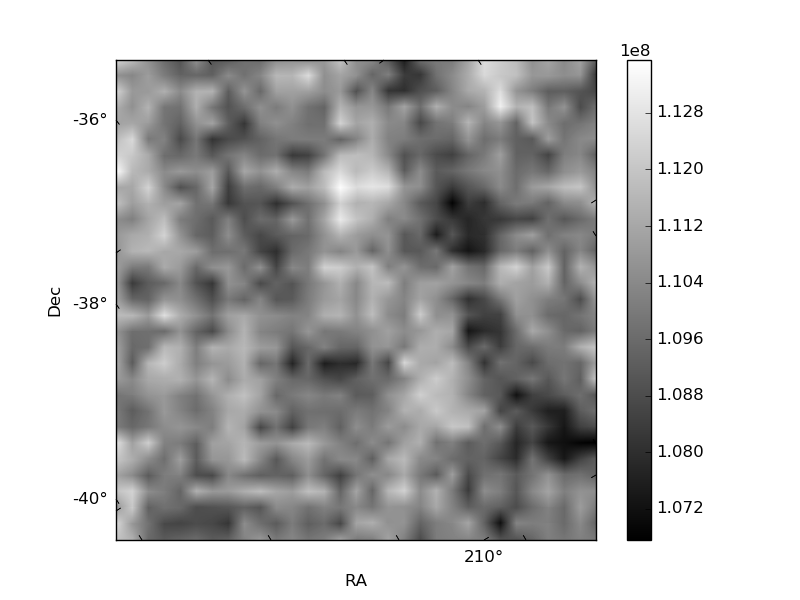
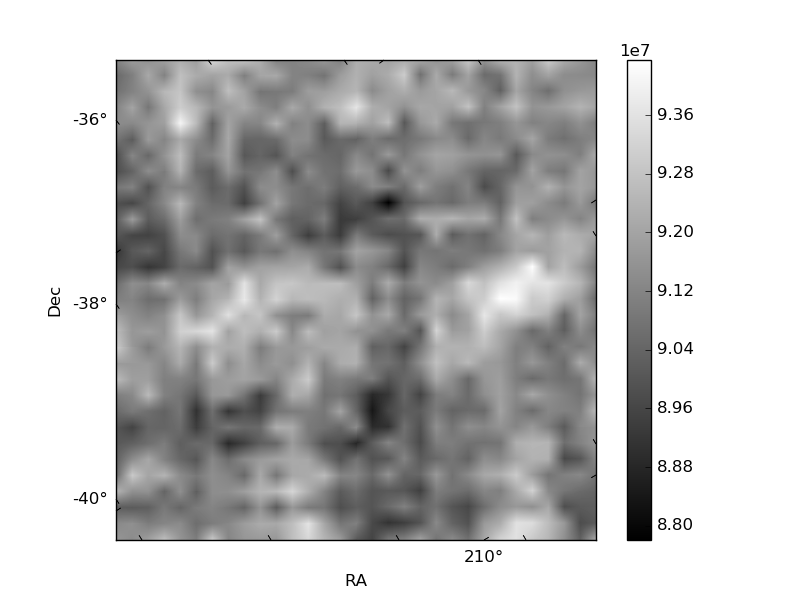
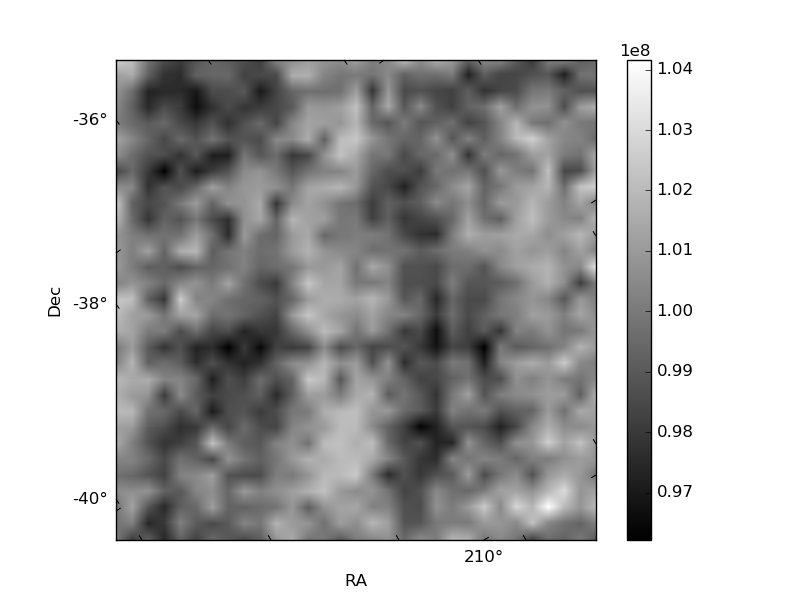
Histogram calculated using DETX and DETY for each event in the final _common_clean file
| Quadrant A | 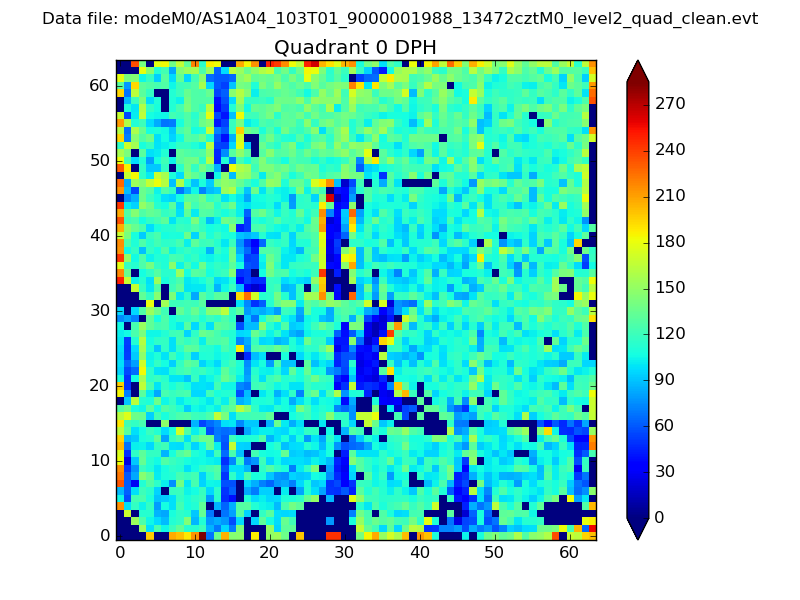 |
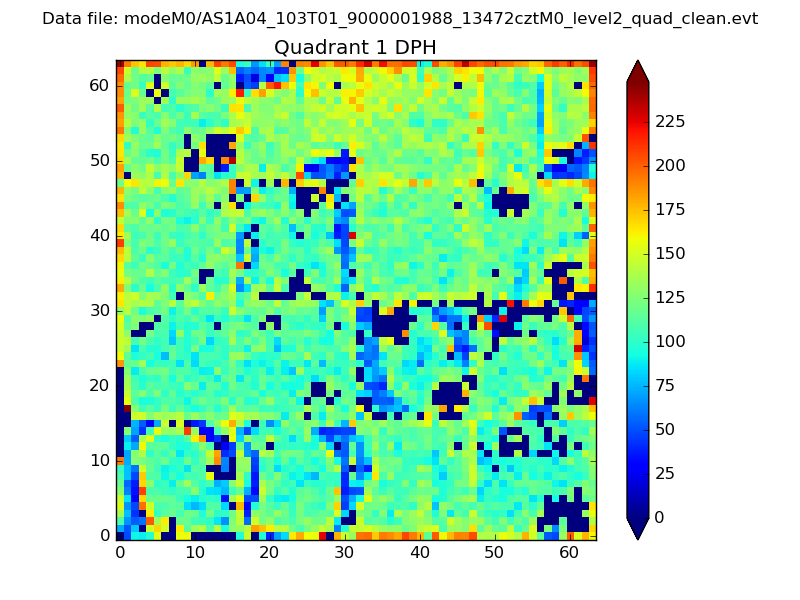 |
Quadrant B |
|---|---|---|---|
| Quadrant D | 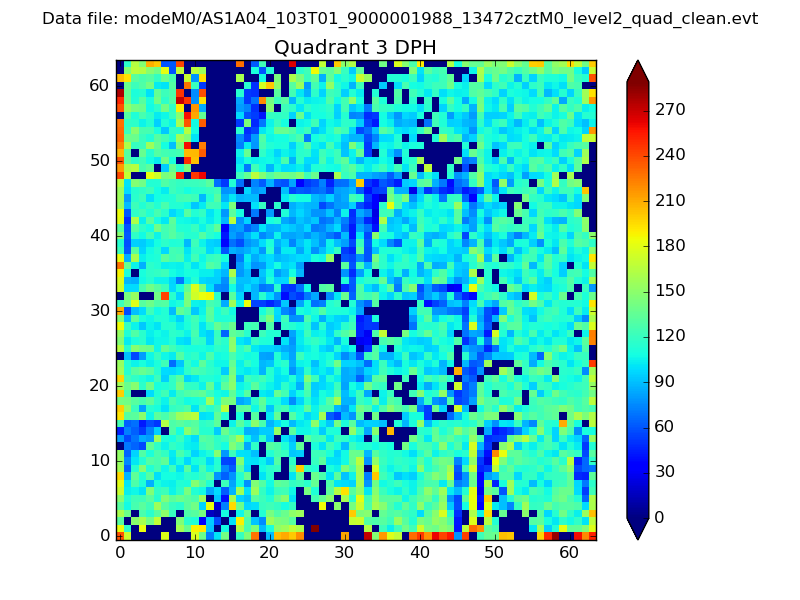 |
 |
Quadrant C |
| Plot type | Count rate plots | Images |
|---|---|---|
| Comparison with Poisson distribution Blue bars denote a histogram of data divided into 1 sec bins. Red curve is a Poisson curve with rate = median count rate of data. |
 |
 |
| Quadrant-wise count rates Data is divided into 100 sec bins |
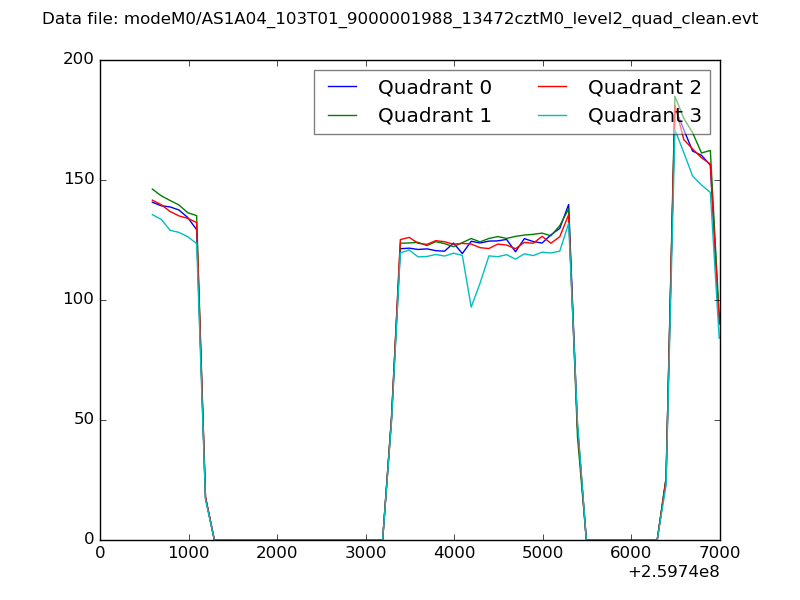 |
|
| Module-wise count rates for Quadrant A Data is divided into 100 sec bins |
 |
 |
| Module-wise count rates for Quadrant B Data is divided into 100 sec bins |
 |
 |
| Module-wise count rates for Quadrant C Data is divided into 100 sec bins |
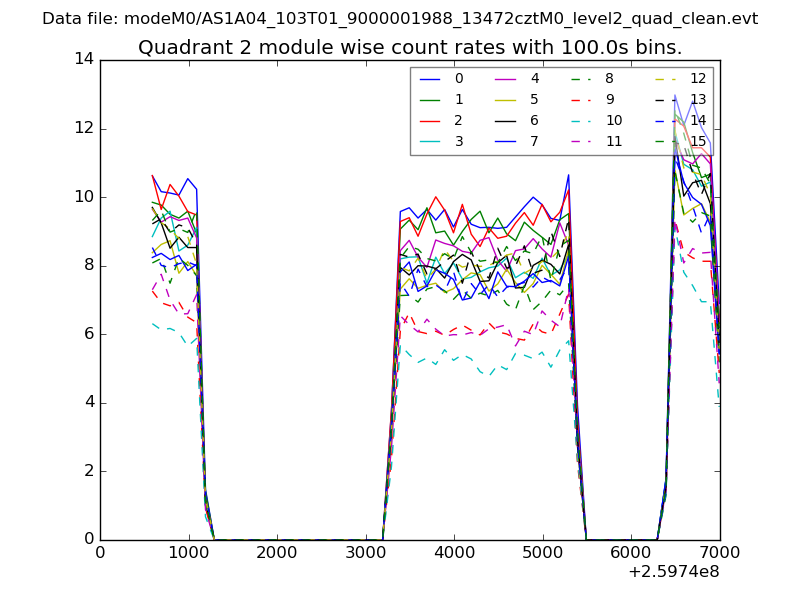 |
 |
| Module-wise count rates for Quadrant D Data is divided into 100 sec bins |
 |
 |
| Parameter | Plot |
|---|---|
| CZT HV Monitor | 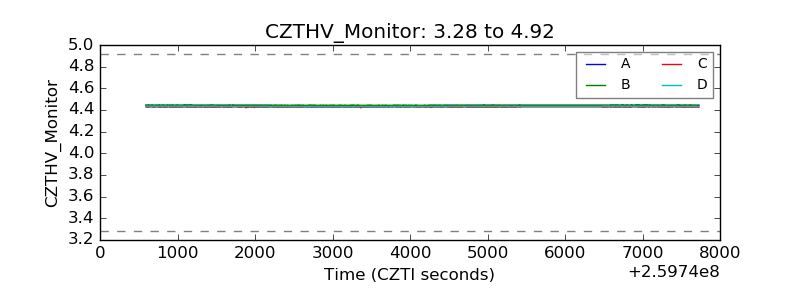 |
| D_VDD | 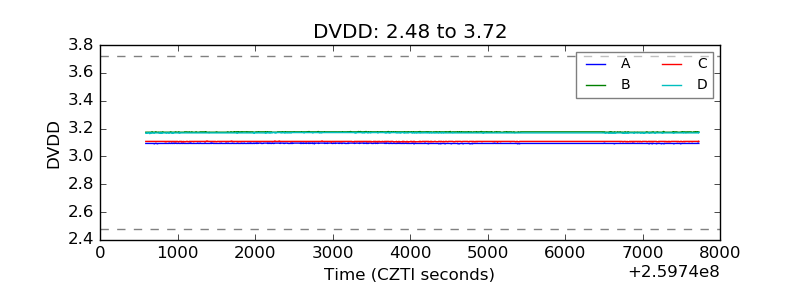 |
| Temperature 1 | 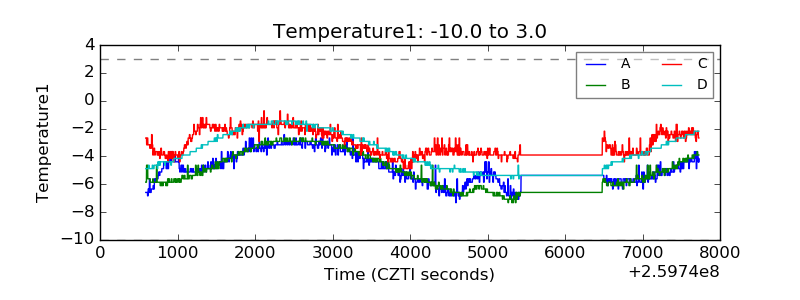 |
| Veto HV Monitor | 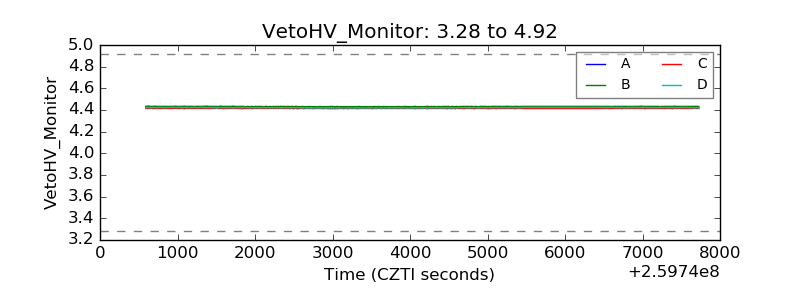 |
| Veto LLD | 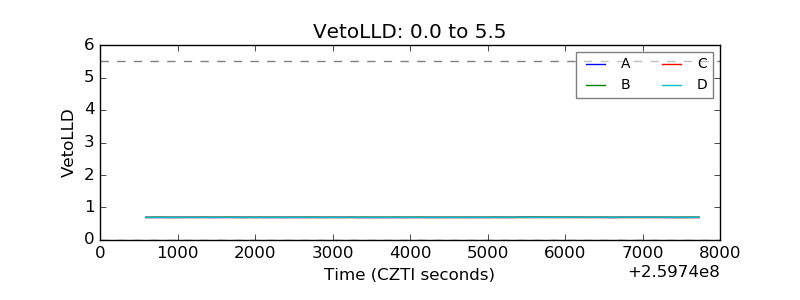 |
| Alpha Counter | 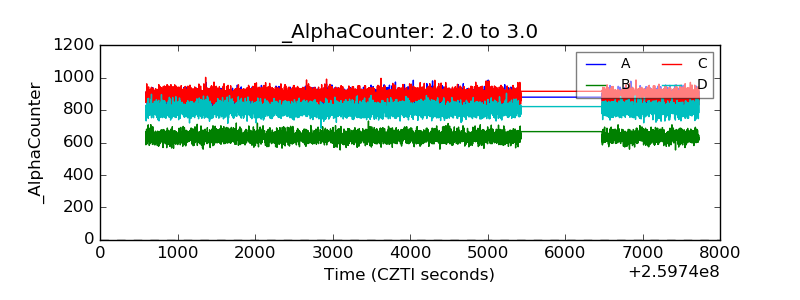 |
| _CPM_Rate | 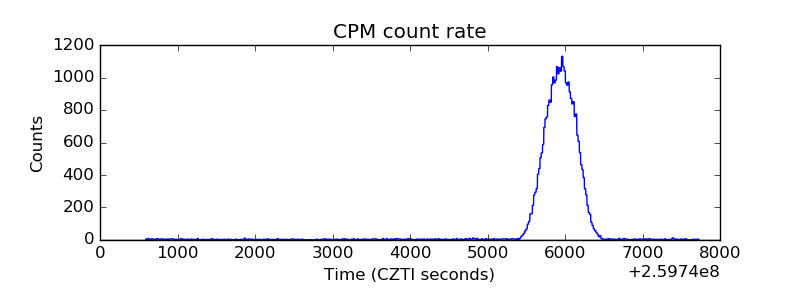 |
| CZT Counter | 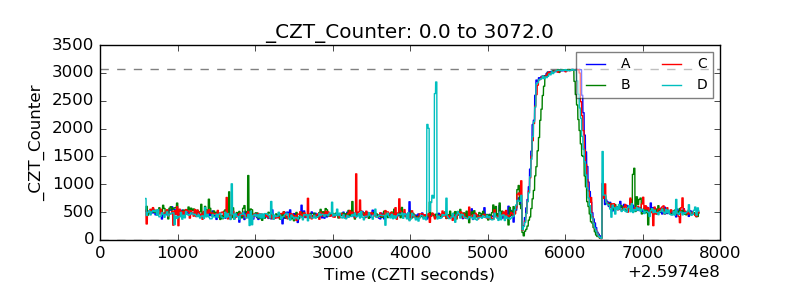 |
| +2.5 Volts monitor |  |
| +5 Volts monitor |  |
| _ROLL_ROT |  |
| _Roll_DEC |  |
| _Roll_RA | 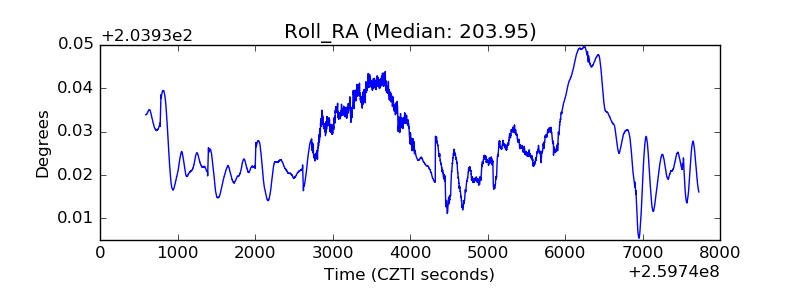 |
| Veto Counter | 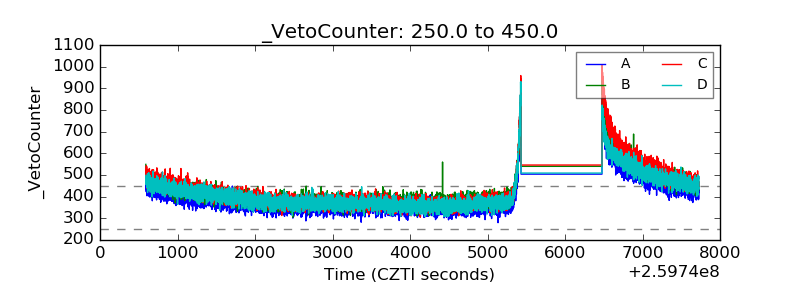 |