| Param | Original file | Final file |
|---|---|---|
| Filename | modeM0/AS1A04_103T01_9000001988_13473cztM0_level2.evt | modeM0/AS1A04_103T01_9000001988_13473cztM0_level2_quad_clean.evt |
| Size (bytes) | 438,373,440 | 71,562,240 |
| Size | 418.1 MB | 68.2 MB |
| Events in quadrant A | 3,175,170 | 433,386 |
| Events in quadrant B | 3,250,840 | 440,992 |
| Events in quadrant C | 3,230,890 | 434,336 |
| Events in quadrant D | 3,185,508 | 412,925 |
| Mode M0 | |||
|---|---|---|---|
| Quadrant | BADHDUFLAG | Total packets | Discarded packets |
| A | 0 | 13558 | 3 |
| B | 0 | 13725 | 2 |
| C | 0 | 13691 | 2 |
| D | 0 | 13601 | 2 |
| Mode SS | |||
|---|---|---|---|
| Quadrant | BADHDUFLAG | Total packets | Discarded packets |
| A | 0 | 130 | 0 |
| B | 0 | 130 | 0 |
| C | 0 | 130 | 0 |
| D | 0 | 130 | 0 |
| Mode M9 | |||
|---|---|---|---|
| Quadrant | BADHDUFLAG | Total packets | Discarded packets |
| A | 0 | 13 | 0 |
| B | 0 | 13 | 0 |
| C | 0 | 13 | 0 |
| D | 0 | 14 | 0 |
| Quadrant | Total seconds | Saturated seconds | Saturation percentage |
|---|---|---|---|
| A | 6378 | 73 | 1.144559% |
| B | 6378 | 85 | 1.332706% |
| C | 6378 | 67 | 1.050486% |
| D | 6378 | 63 | 0.987770% |
Noise dominated data is calculated using 1-second bins in cleaned event files. If a bin has >2000 counts, and if more than 50% of those come from <1% of pixels, then it is considered to be noise-dominated and hence unusable.
| Quadrant | # 1 sec bins | Bins with >0 counts | Bins with >2000 counts | High rate bins dominated by noise | Noise dominated (total time) | Noise dominated (detector-on time) | Marked lightcurve |
|---|---|---|---|---|---|---|---|
| A | 7519 | 6379 | 0 | 0 | 0.00% | 0.00% | 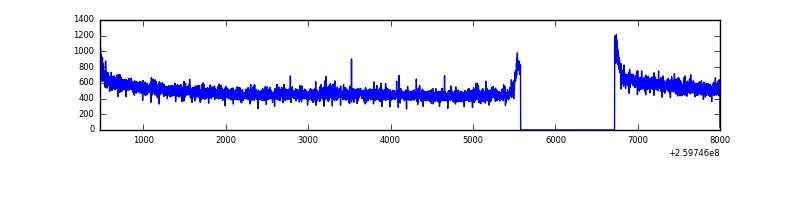 |
| B | 7519 | 6379 | 1 | 1 | 0.01% | 0.02% | 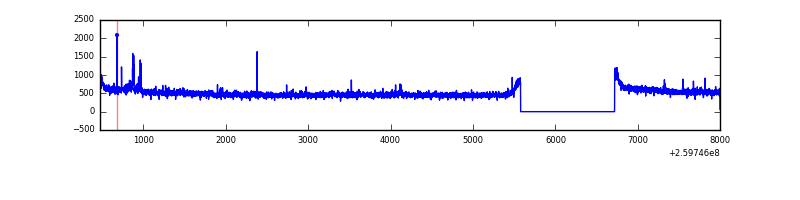 |
| C | 7519 | 6379 | 2 | 2 | 0.03% | 0.03% |  |
| D | 7519 | 6379 | 3 | 3 | 0.04% | 0.05% | 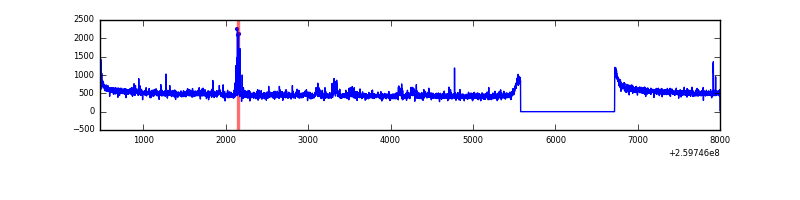 |
Top three noisy pixels from each quadrant. If the there are fewer than three noisy pixels in the level2.evt file, extra rows are filled as -1
| Pixel properties | Quadrant properties | ||||||
|---|---|---|---|---|---|---|---|
| Quadrant | DetID | PixID | Counts | Sigma | Mean | Median | Sigma |
| A | 0 | 226 | 7425 | 40.17 | 822 | 805 | 164.8 |
| A | 8 | 15 | 7376 | 39.88 | 822 | 805 | 164.8 |
| A | 12 | 194 | 6165 | 32.53 | 822 | 805 | 164.8 |
| B | 3 | 64 | 41895 | 268.17 | 818 | 798 | 153.3 |
| B | 12 | 111 | 17705 | 110.32 | 818 | 798 | 153.3 |
| B | 11 | 111 | 15246 | 94.28 | 818 | 798 | 153.3 |
| C | 3 | 233 | 57116 | 305.04 | 806 | 813 | 184.6 |
| C | 0 | 207 | 30516 | 160.92 | 806 | 813 | 184.6 |
| C | 13 | 61 | 5794 | 26.99 | 806 | 813 | 184.6 |
| D | 8 | 195 | 120062 | 623.73 | 799 | 778 | 191.2 |
| D | 13 | 249 | 28308 | 143.95 | 799 | 778 | 191.2 |
| D | 2 | 234 | 21264 | 107.12 | 799 | 778 | 191.2 |
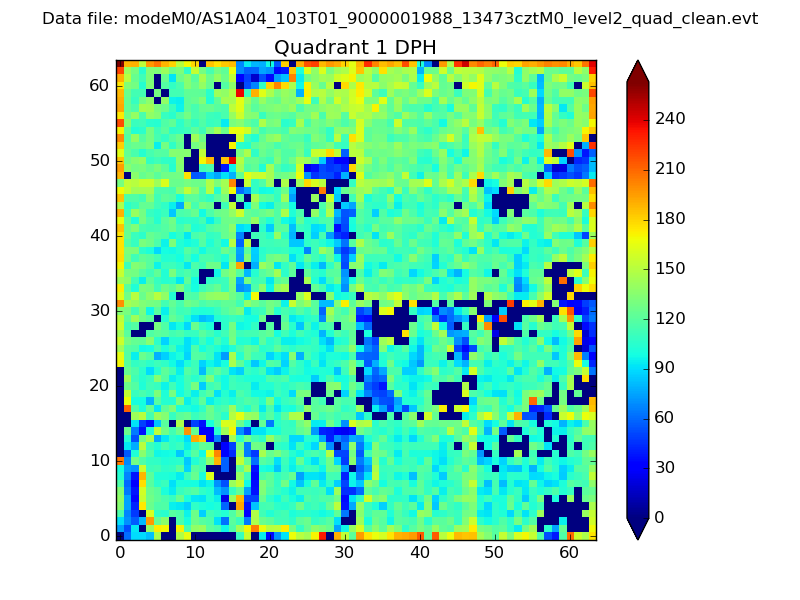
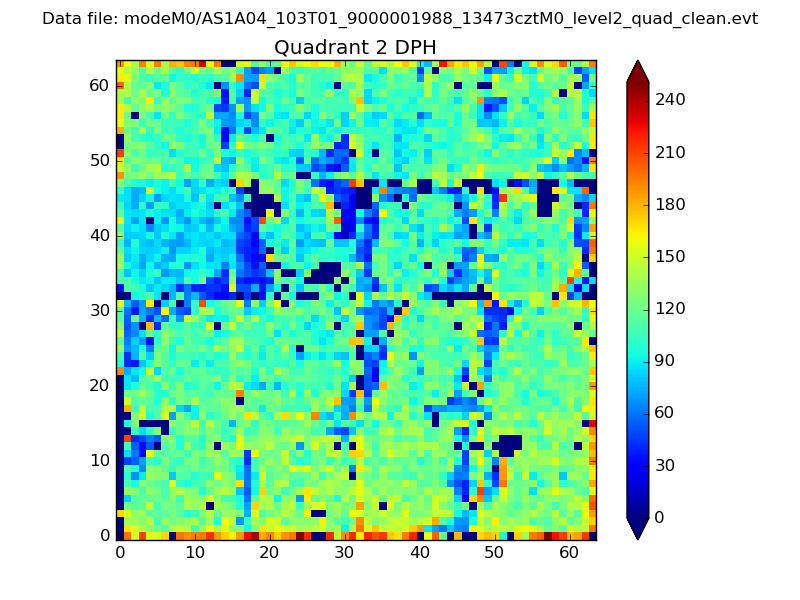
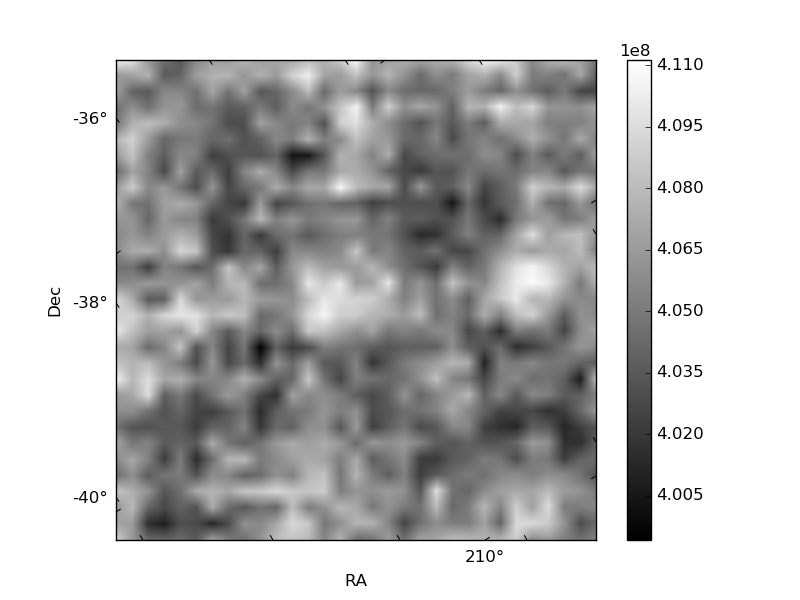
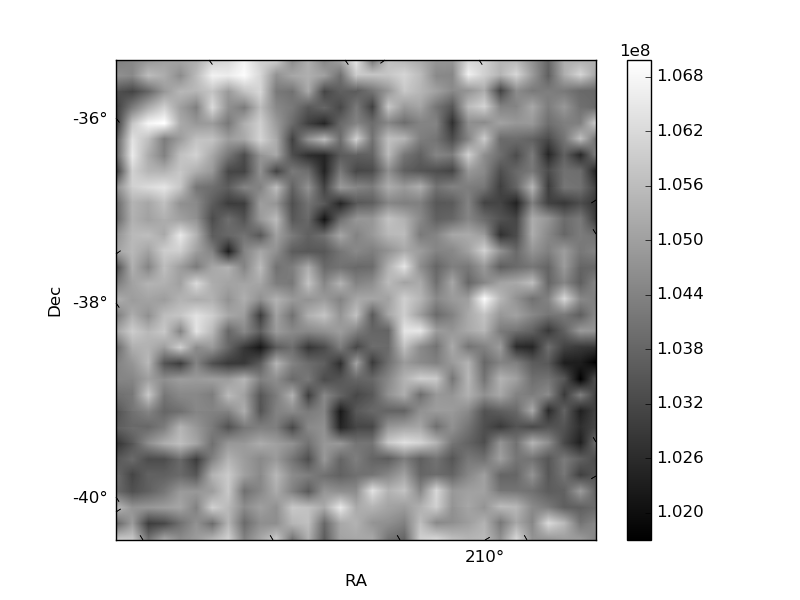
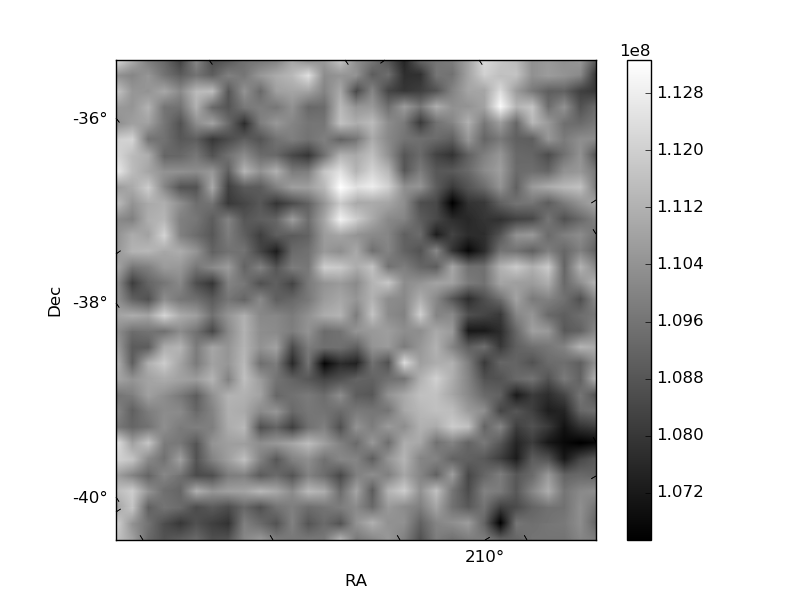
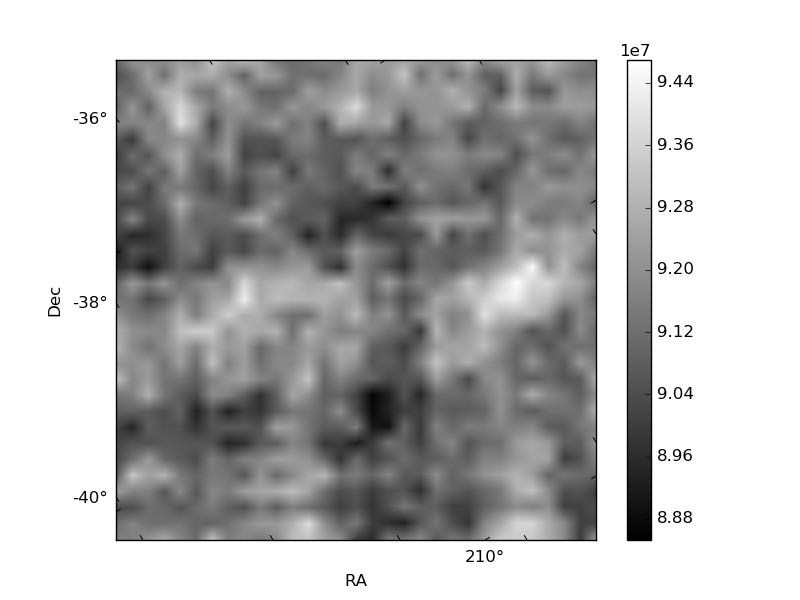
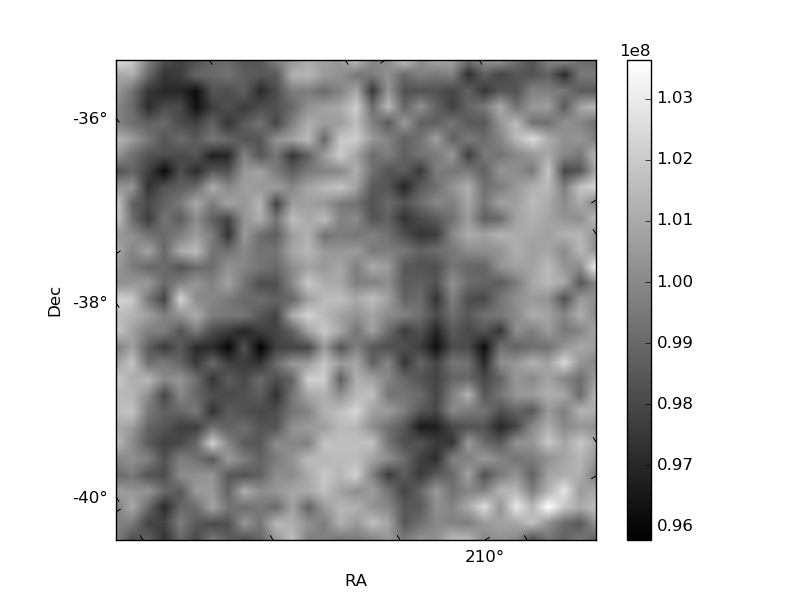
Histogram calculated using DETX and DETY for each event in the final _common_clean file
| Quadrant A | 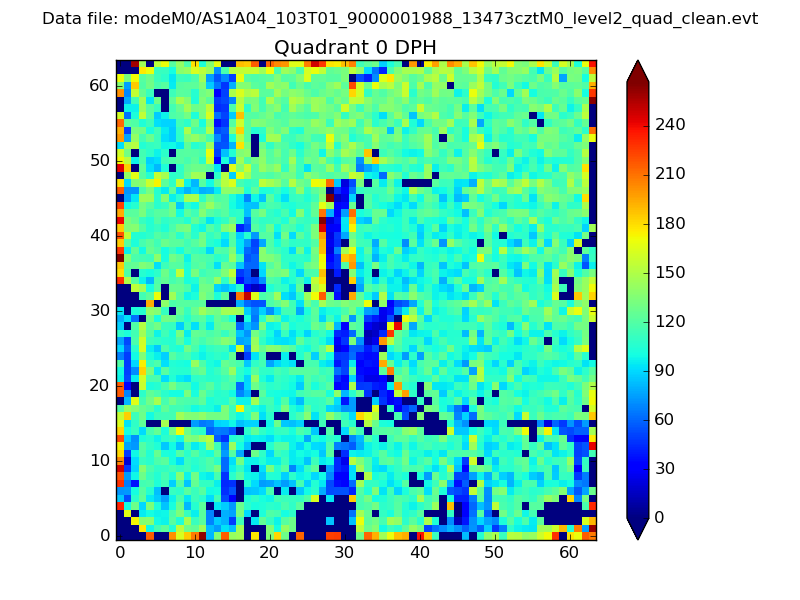 |
 |
Quadrant B |
|---|---|---|---|
| Quadrant D | 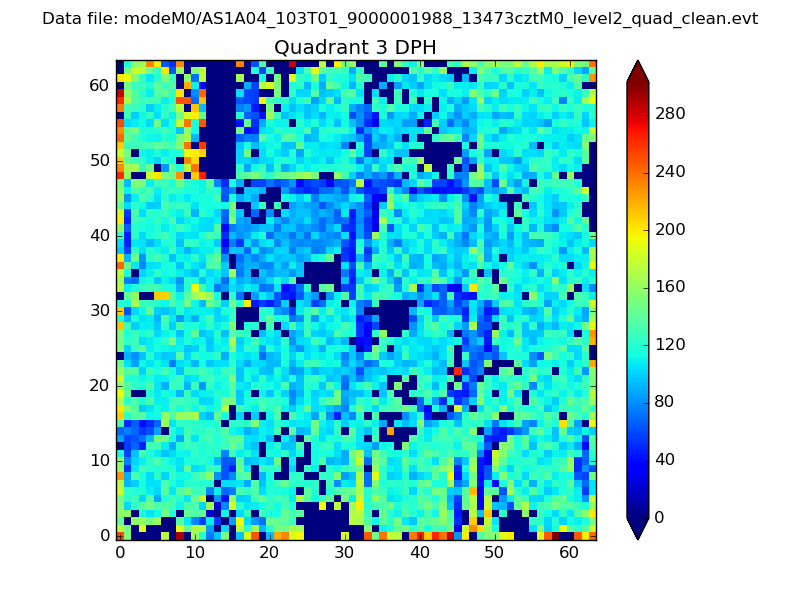 |
 |
Quadrant C |
| Plot type | Count rate plots | Images |
|---|---|---|
| Comparison with Poisson distribution Blue bars denote a histogram of data divided into 1 sec bins. Red curve is a Poisson curve with rate = median count rate of data. |
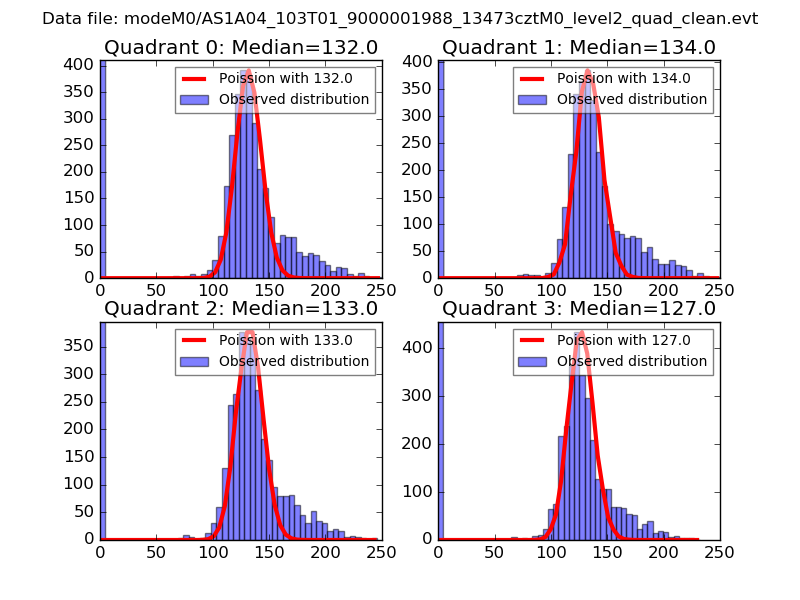 |
 |
| Quadrant-wise count rates Data is divided into 100 sec bins |
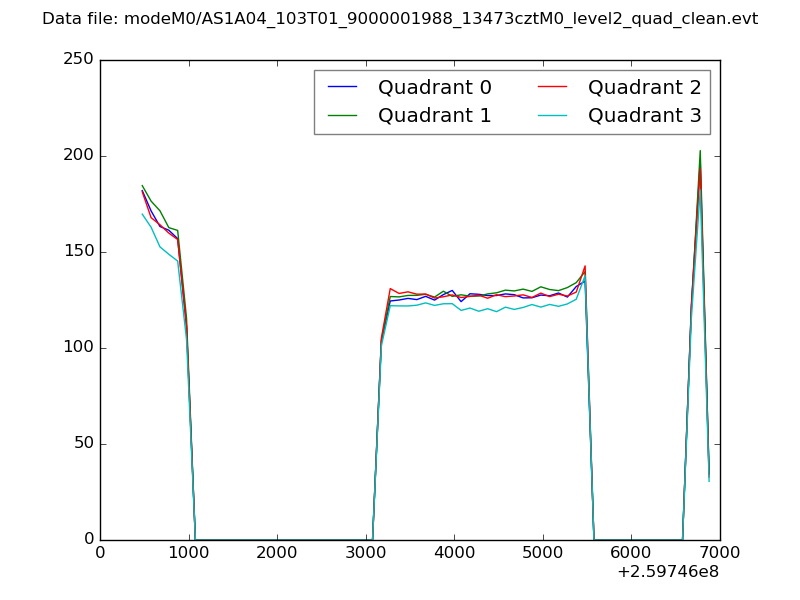 |
|
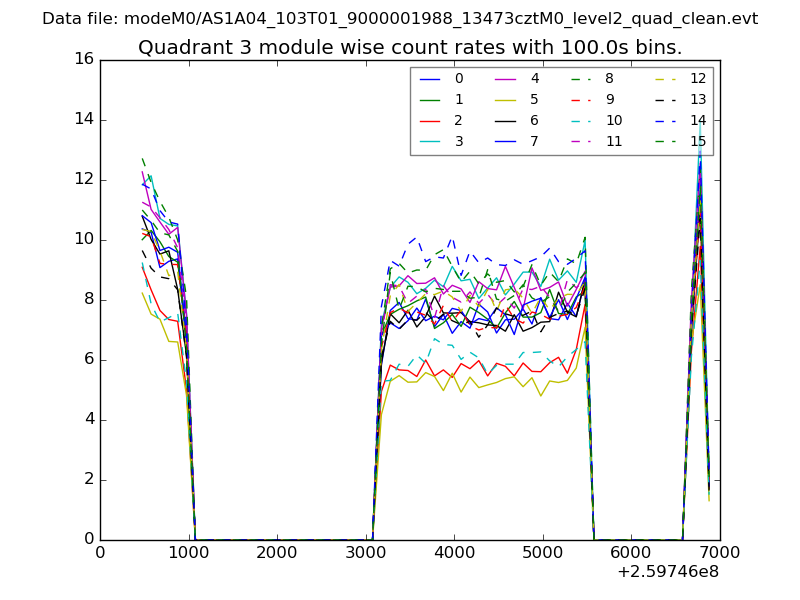
| Module-wise count rates for Quadrant A Data is divided into 100 sec bins |
 |
 |
| Module-wise count rates for Quadrant B Data is divided into 100 sec bins |
 |
 |
| Module-wise count rates for Quadrant C Data is divided into 100 sec bins |
 |
 |
| Module-wise count rates for Quadrant D Data is divided into 100 sec bins |
 |
 |
| Parameter | Plot |
|---|---|
| CZT HV Monitor | 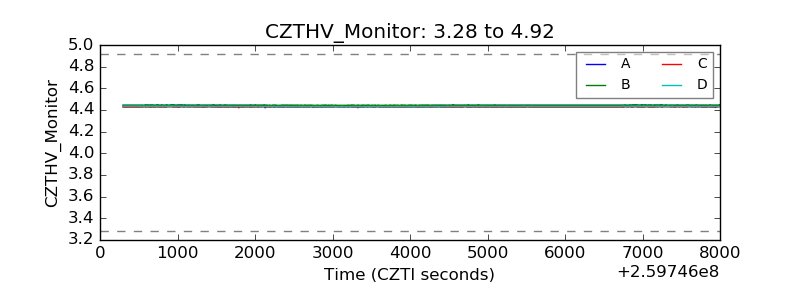 |
| D_VDD | 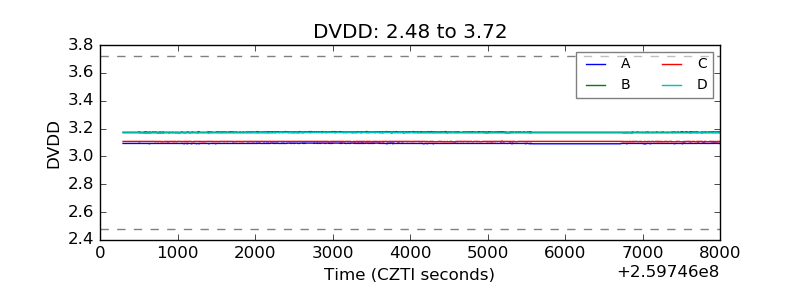 |
| Temperature 1 | 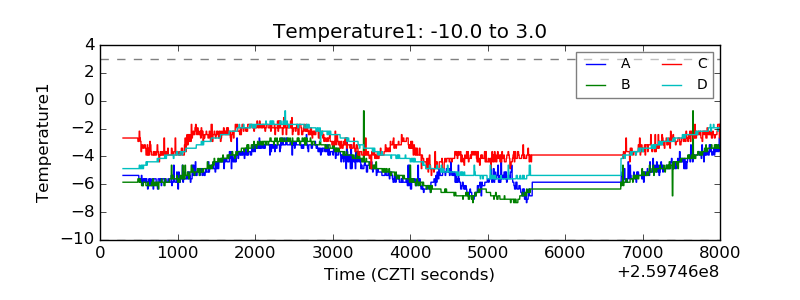 |
| Veto HV Monitor | 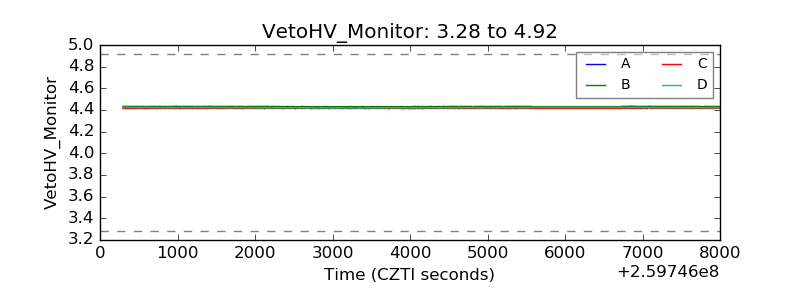 |
| Veto LLD | 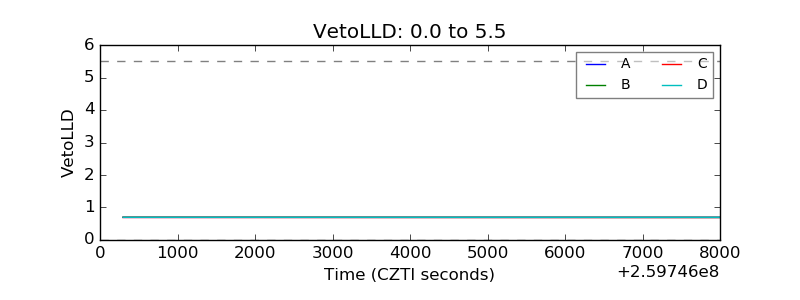 |
| Alpha Counter | 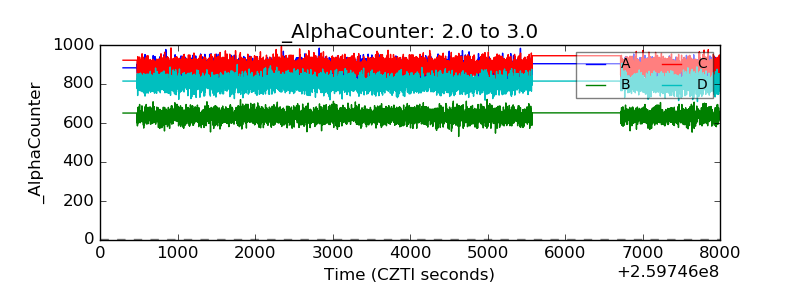 |
| _CPM_Rate | 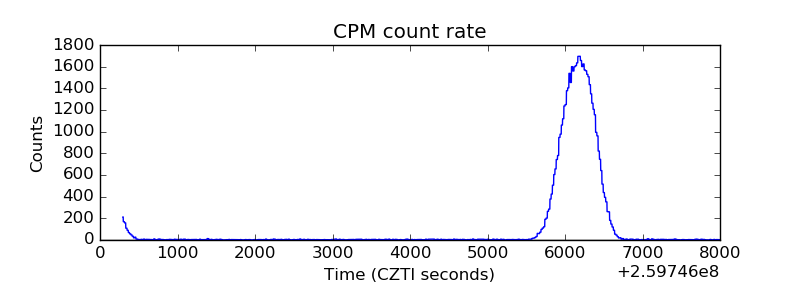 |
| CZT Counter | 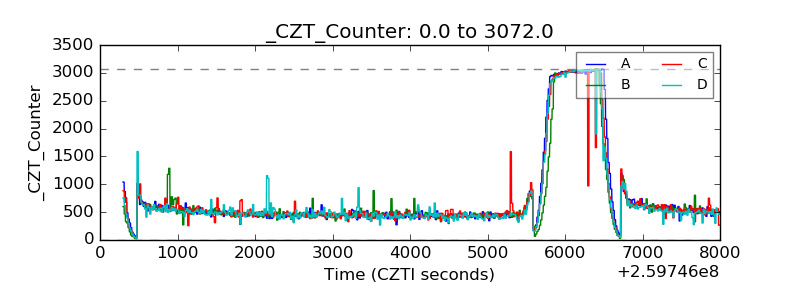 |
| +2.5 Volts monitor |  |
| +5 Volts monitor |  |
| _ROLL_ROT | 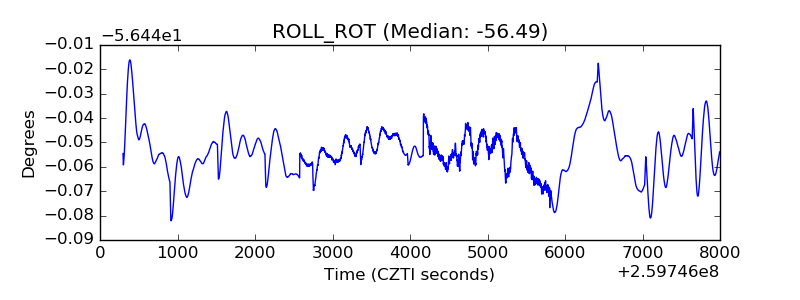 |
| _Roll_DEC | 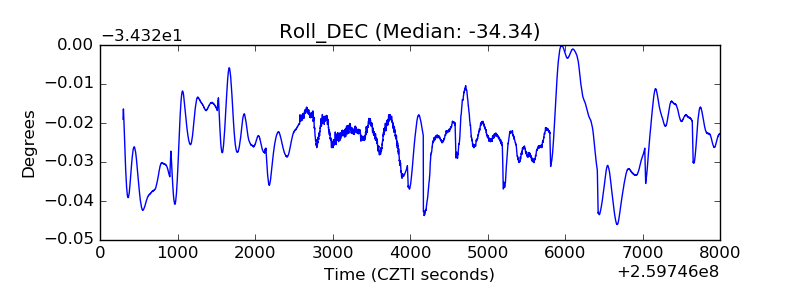 |
| _Roll_RA | 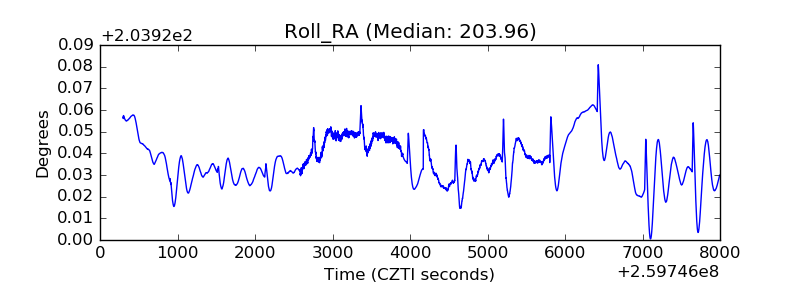 |
| Veto Counter |  |