| Param | Original file | Final file |
|---|---|---|
| Filename | modeM0/AS1A04_103T01_9000001988_13474cztM0_level2.evt | modeM0/AS1A04_103T01_9000001988_13474cztM0_level2_quad_clean.evt |
| Size (bytes) | 449,326,080 | 66,303,360 |
| Size | 428.5 MB | 63.2 MB |
| Events in quadrant A | 3,270,705 | 396,027 |
| Events in quadrant B | 3,388,085 | 401,132 |
| Events in quadrant C | 3,288,138 | 393,762 |
| Events in quadrant D | 3,233,153 | 377,142 |
| Mode M0 | |||
|---|---|---|---|
| Quadrant | BADHDUFLAG | Total packets | Discarded packets |
| A | 0 | 13709 | 3 |
| B | 0 | 13934 | 2 |
| C | 0 | 13806 | 2 |
| D | 0 | 13705 | 2 |
| Mode SS | |||
|---|---|---|---|
| Quadrant | BADHDUFLAG | Total packets | Discarded packets |
| A | 0 | 126 | 0 |
| B | 0 | 126 | 0 |
| C | 0 | 126 | 0 |
| D | 0 | 126 | 0 |
| Mode M9 | |||
|---|---|---|---|
| Quadrant | BADHDUFLAG | Total packets | Discarded packets |
| A | 0 | 20 | 0 |
| B | 0 | 20 | 0 |
| C | 0 | 20 | 0 |
| D | 0 | 21 | 0 |
| Quadrant | Total seconds | Saturated seconds | Saturation percentage |
|---|---|---|---|
| A | 6304 | 92 | 1.459391% |
| B | 6304 | 118 | 1.871827% |
| C | 6304 | 77 | 1.221447% |
| D | 6304 | 70 | 1.110406% |
Noise dominated data is calculated using 1-second bins in cleaned event files. If a bin has >2000 counts, and if more than 50% of those come from <1% of pixels, then it is considered to be noise-dominated and hence unusable.
| Quadrant | # 1 sec bins | Bins with >0 counts | Bins with >2000 counts | High rate bins dominated by noise | Noise dominated (total time) | Noise dominated (detector-on time) | Marked lightcurve |
|---|---|---|---|---|---|---|---|
| A | 7555 | 6305 | 0 | 0 | 0.00% | 0.00% | 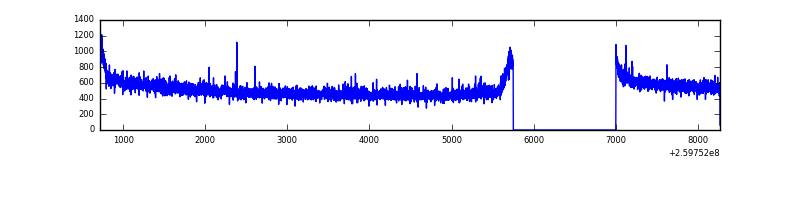 |
| B | 7555 | 6305 | 16 | 16 | 0.21% | 0.25% | 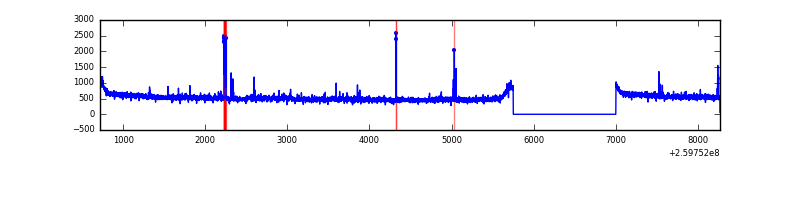 |
| C | 7555 | 6305 | 2 | 2 | 0.03% | 0.03% | 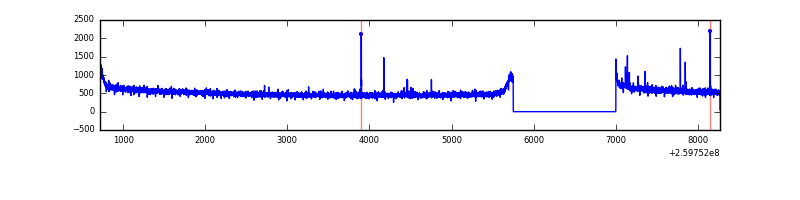 |
| D | 7555 | 6305 | 0 | 0 | 0.00% | 0.00% | 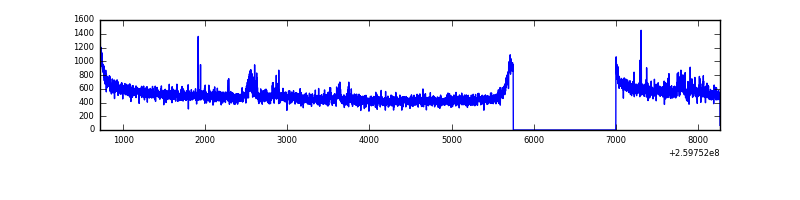 |
Top three noisy pixels from each quadrant. If the there are fewer than three noisy pixels in the level2.evt file, extra rows are filled as -1
| Pixel properties | Quadrant properties | ||||||
|---|---|---|---|---|---|---|---|
| Quadrant | DetID | PixID | Counts | Sigma | Mean | Median | Sigma |
| A | 1 | 162 | 13075 | 72.8 | 845 | 826 | 168.3 |
| A | 0 | 226 | 7700 | 40.85 | 845 | 826 | 168.3 |
| A | 12 | 194 | 6255 | 32.27 | 845 | 826 | 168.3 |
| B | 3 | 64 | 61272 | 387.58 | 836 | 818 | 156.0 |
| B | 10 | 244 | 23153 | 143.19 | 836 | 818 | 156.0 |
| B | 0 | 214 | 17890 | 109.45 | 836 | 818 | 156.0 |
| C | 3 | 233 | 68599 | 364.39 | 819 | 826 | 186.0 |
| C | 0 | 207 | 28164 | 146.98 | 819 | 826 | 186.0 |
| C | 13 | 61 | 5898 | 27.27 | 819 | 826 | 186.0 |
| D | 8 | 195 | 137333 | 716.54 | 812 | 791 | 190.6 |
| D | 2 | 234 | 21319 | 107.73 | 812 | 791 | 190.6 |
| D | 2 | 136 | 9722 | 46.87 | 812 | 791 | 190.6 |
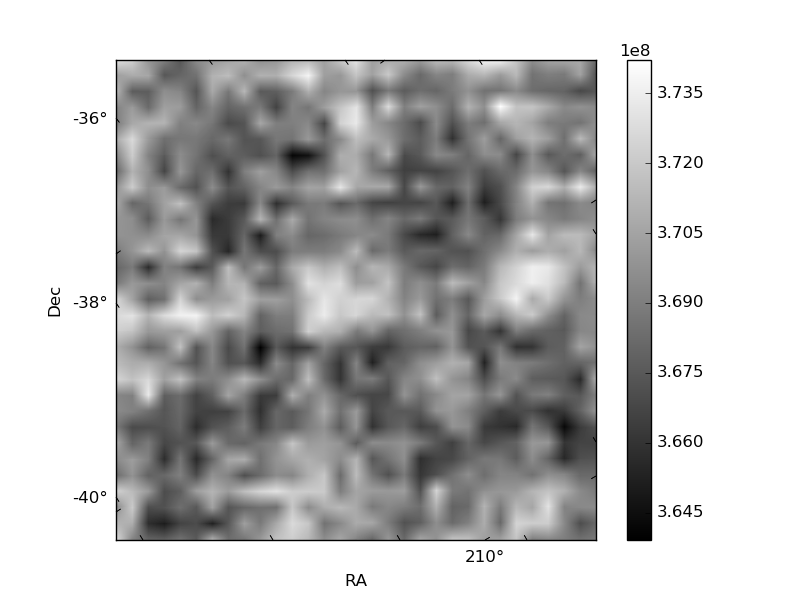
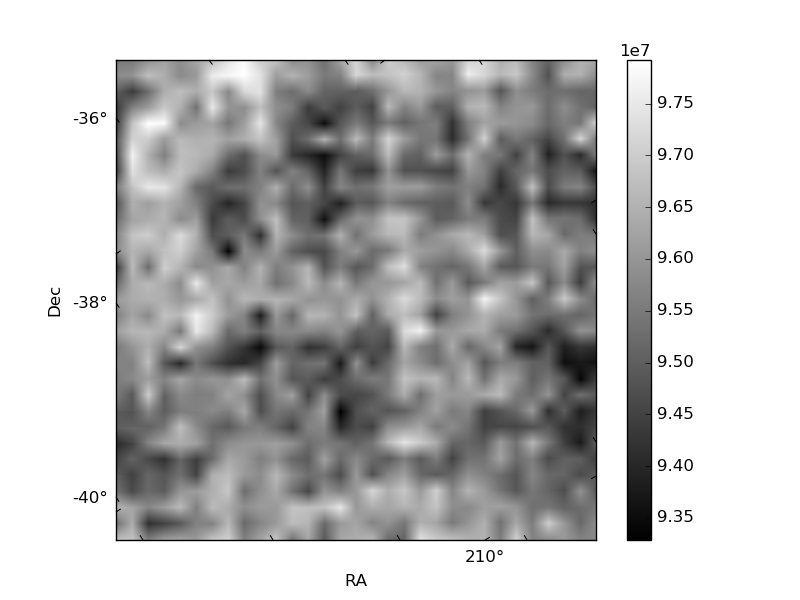
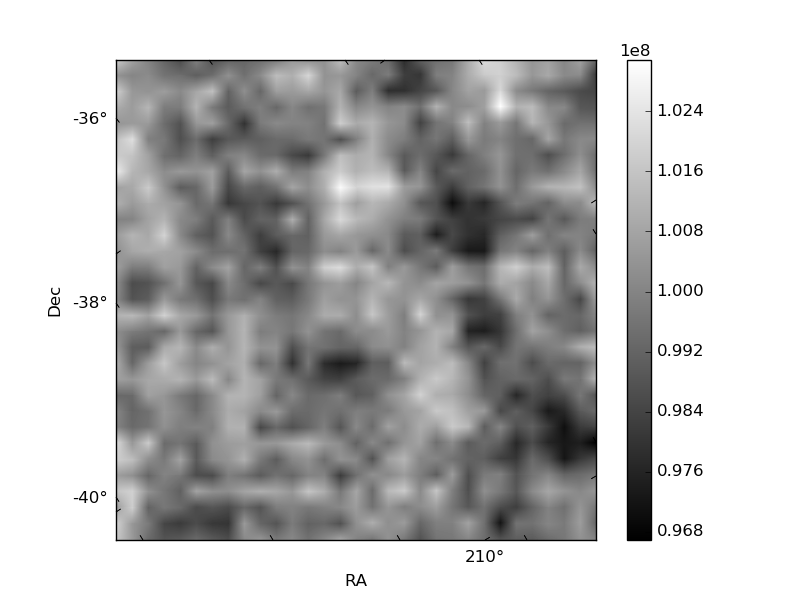
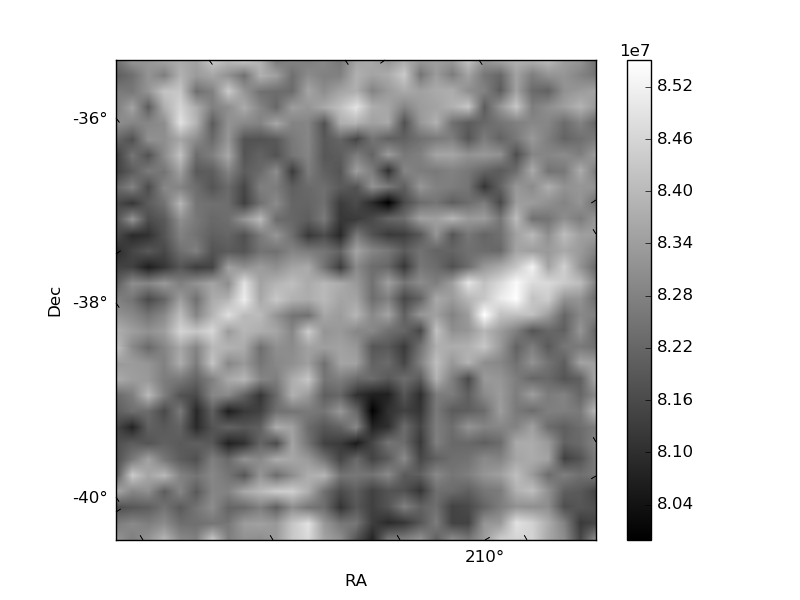
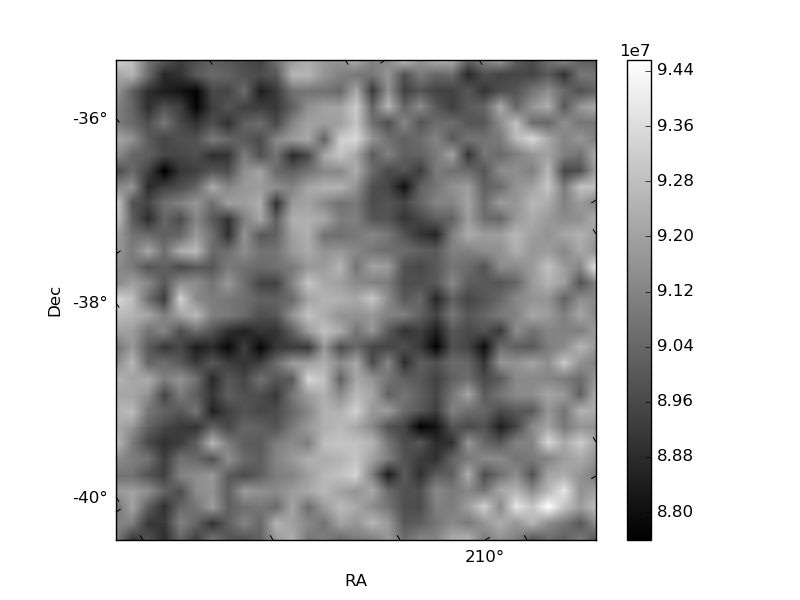
Histogram calculated using DETX and DETY for each event in the final _common_clean file
| Quadrant A | 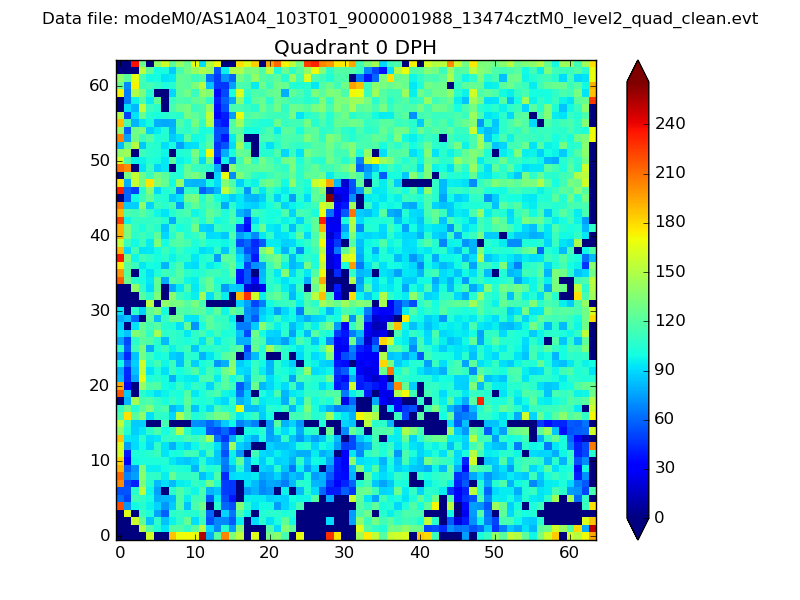 |
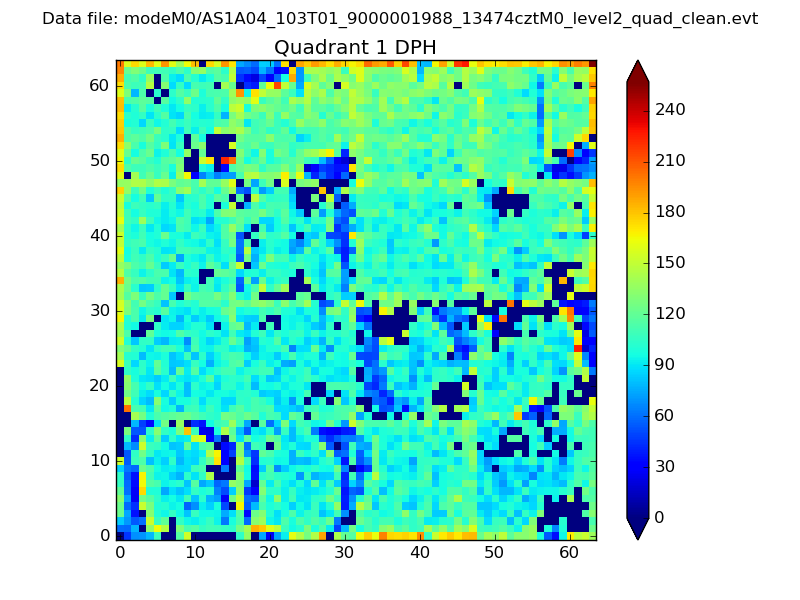 |
Quadrant B |
|---|---|---|---|
| Quadrant D | 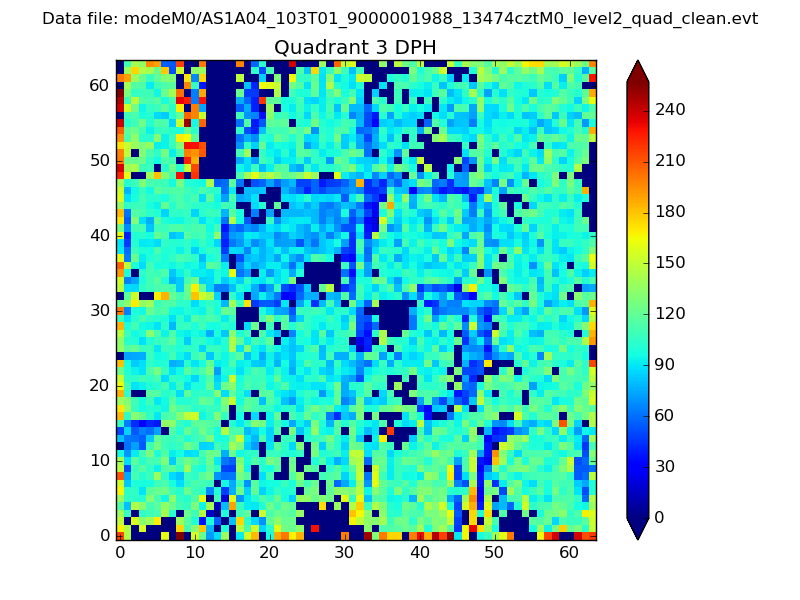 |
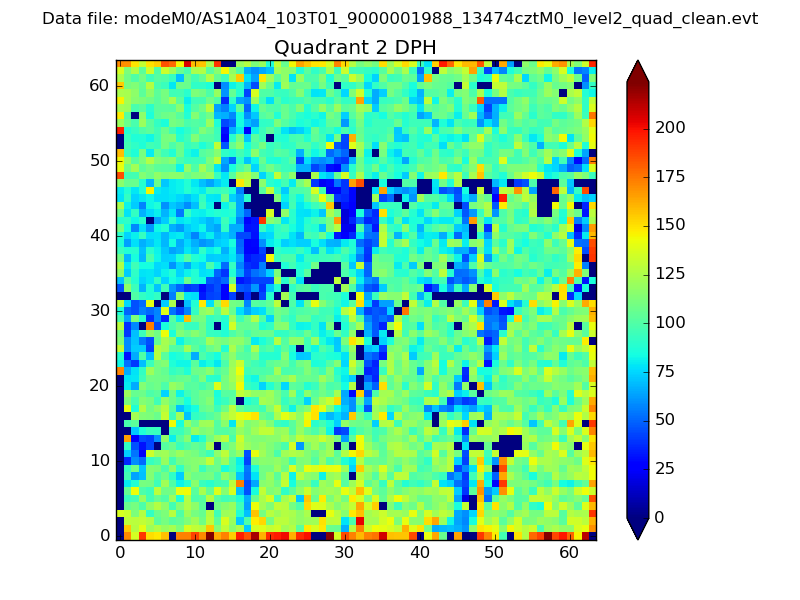 |
Quadrant C |
| Plot type | Count rate plots | Images |
|---|---|---|
| Comparison with Poisson distribution Blue bars denote a histogram of data divided into 1 sec bins. Red curve is a Poisson curve with rate = median count rate of data. |
 |
 |
| Quadrant-wise count rates Data is divided into 100 sec bins |
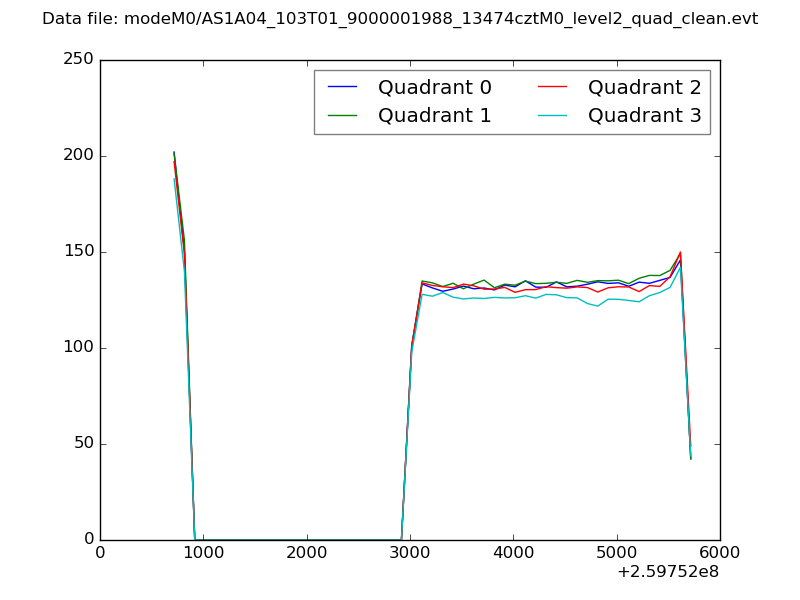 |
|
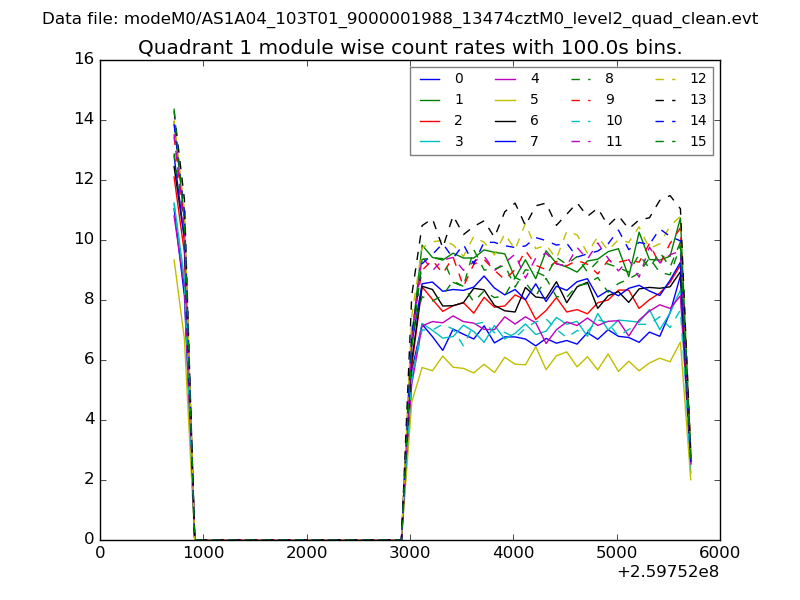
| Module-wise count rates for Quadrant A Data is divided into 100 sec bins |
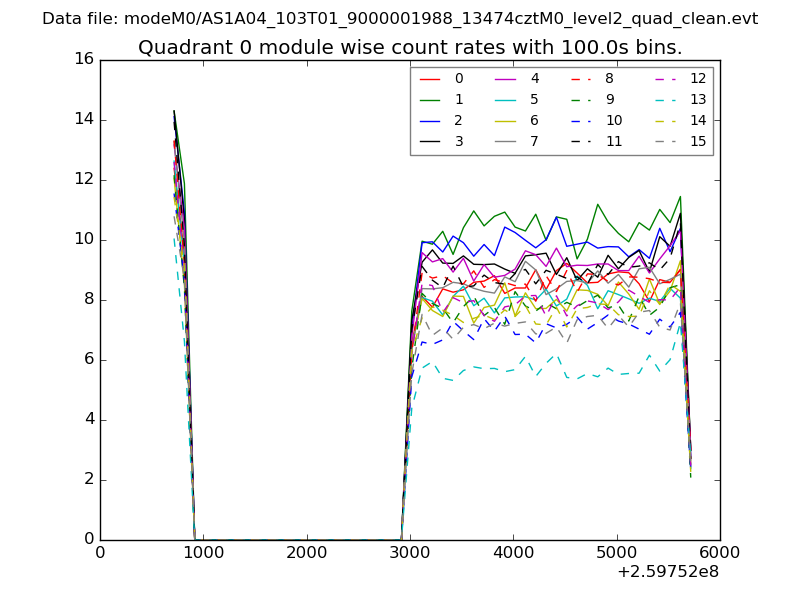 |
 |
| Module-wise count rates for Quadrant B Data is divided into 100 sec bins |
 |
 |
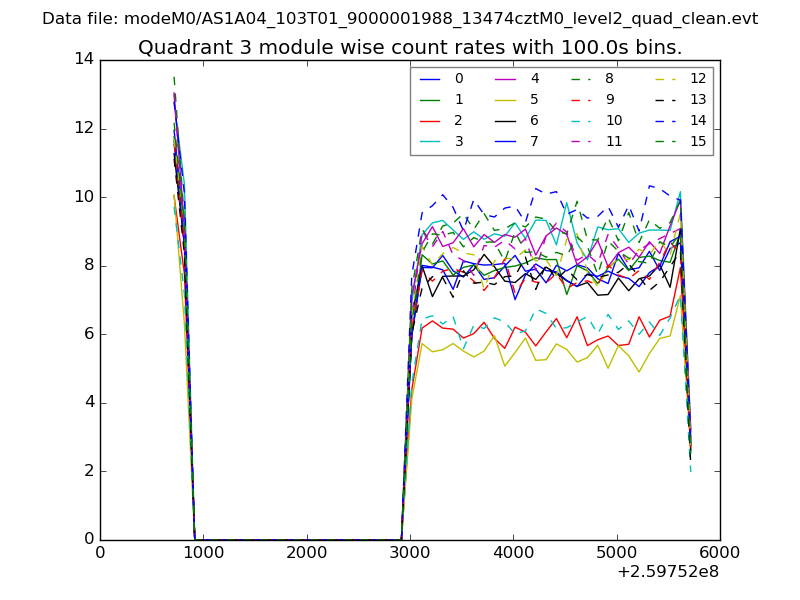
| Module-wise count rates for Quadrant C Data is divided into 100 sec bins |
 |
 |
| Module-wise count rates for Quadrant D Data is divided into 100 sec bins |
 |
 |
| Parameter | Plot |
|---|---|
| CZT HV Monitor |  |
| D_VDD | 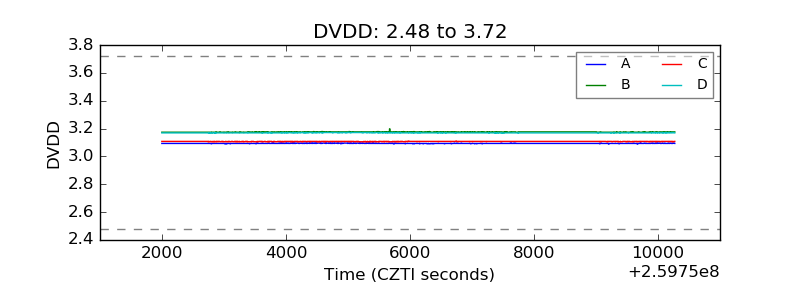 |
| Temperature 1 | 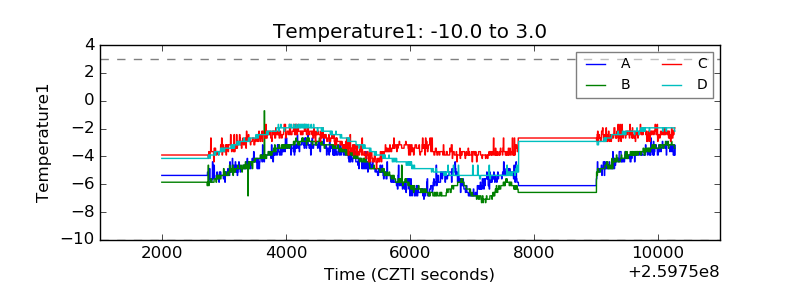 |
| Veto HV Monitor | 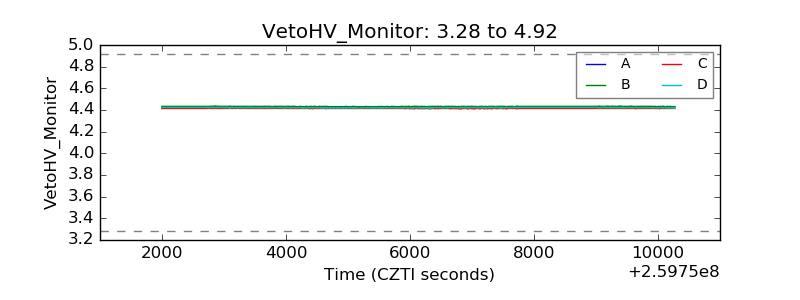 |
| Veto LLD | 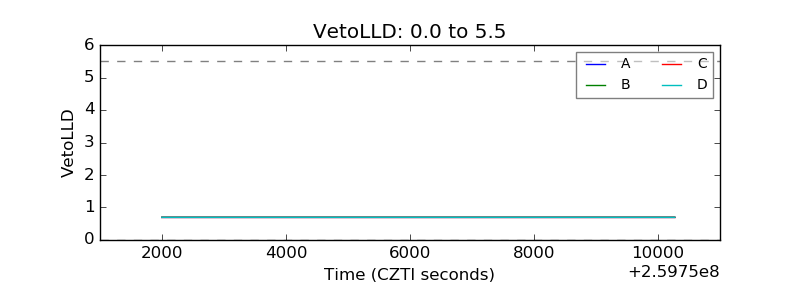 |
| Alpha Counter | 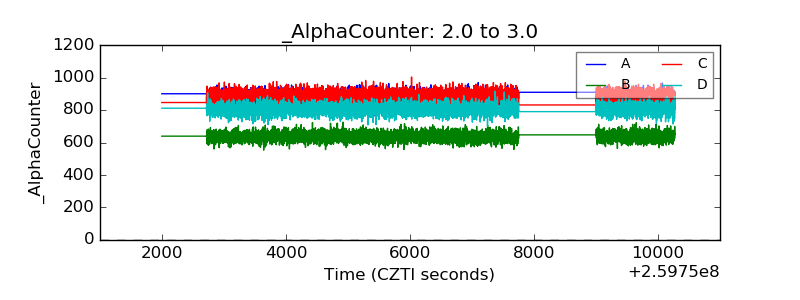 |
| _CPM_Rate | 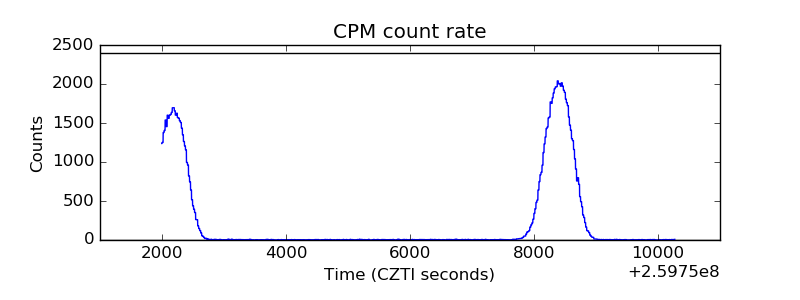 |
| CZT Counter | 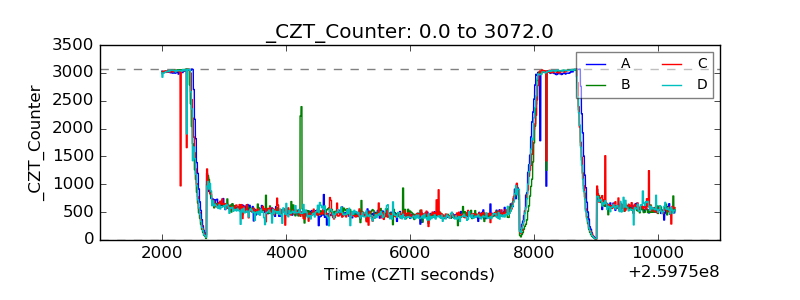 |
| +2.5 Volts monitor |  |
| +5 Volts monitor |  |
| _ROLL_ROT | 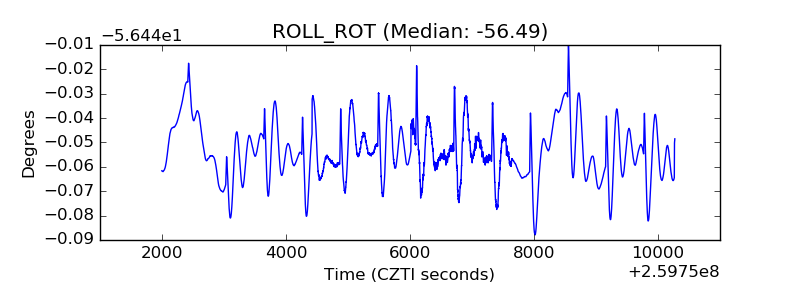 |
| _Roll_DEC | 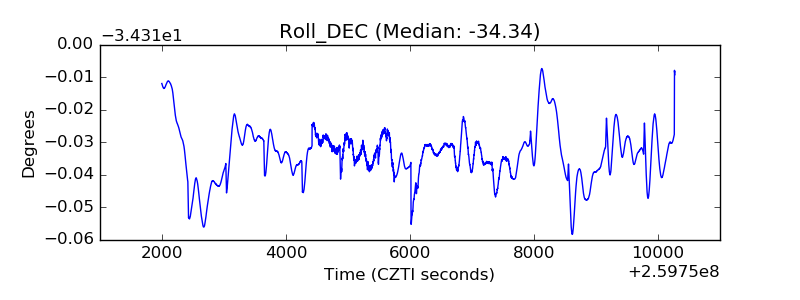 |
| _Roll_RA | 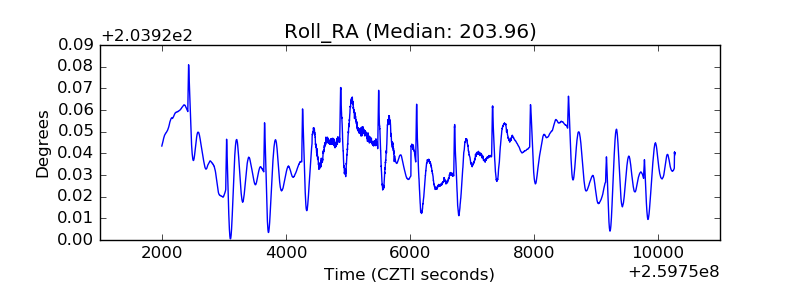 |
| Veto Counter | 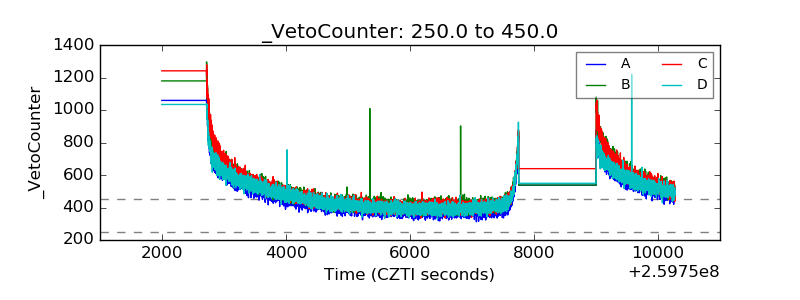 |