| Param | Original file | Final file |
|---|---|---|
| Filename | modeM0/AS1A04_103T01_9000001988_13475cztM0_level2.evt | modeM0/AS1A04_103T01_9000001988_13475cztM0_level2_quad_clean.evt |
| Size (bytes) | 518,797,440 | 72,682,560 |
| Size | 494.8 MB | 69.3 MB |
| Events in quadrant A | 3,417,964 | 443,358 |
| Events in quadrant B | 4,974,105 | 436,944 |
| Events in quadrant C | 3,481,832 | 438,823 |
| Events in quadrant D | 3,390,609 | 421,909 |
| Mode M0 | |||
|---|---|---|---|
| Quadrant | BADHDUFLAG | Total packets | Discarded packets |
| A | 0 | 14287 | 3 |
| B | 0 | 18913 | 2 |
| C | 0 | 14497 | 2 |
| D | 0 | 14412 | 2 |
| Mode SS | |||
|---|---|---|---|
| Quadrant | BADHDUFLAG | Total packets | Discarded packets |
| A | 0 | 132 | 0 |
| B | 0 | 132 | 0 |
| C | 0 | 132 | 0 |
| D | 0 | 132 | 0 |
| Mode M9 | |||
|---|---|---|---|
| Quadrant | BADHDUFLAG | Total packets | Discarded packets |
| A | 0 | 24 | 0 |
| B | 0 | 24 | 0 |
| C | 0 | 24 | 0 |
| D | 0 | 25 | 0 |
| Quadrant | Total seconds | Saturated seconds | Saturation percentage |
|---|---|---|---|
| A | 6596 | 119 | 1.804124% |
| B | 6596 | 668 | 10.127350% |
| C | 6596 | 104 | 1.576713% |
| D | 6596 | 100 | 1.516070% |
Noise dominated data is calculated using 1-second bins in cleaned event files. If a bin has >2000 counts, and if more than 50% of those come from <1% of pixels, then it is considered to be noise-dominated and hence unusable.
| Quadrant | # 1 sec bins | Bins with >0 counts | Bins with >2000 counts | High rate bins dominated by noise | Noise dominated (total time) | Noise dominated (detector-on time) | Marked lightcurve |
|---|---|---|---|---|---|---|---|
| A | 7867 | 6597 | 0 | 0 | 0.00% | 0.00% | 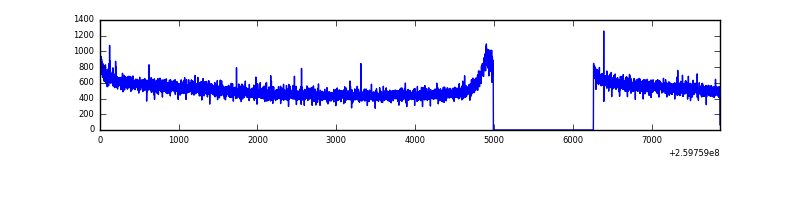 |
| B | 7867 | 6597 | 455 | 455 | 5.78% | 6.90% | 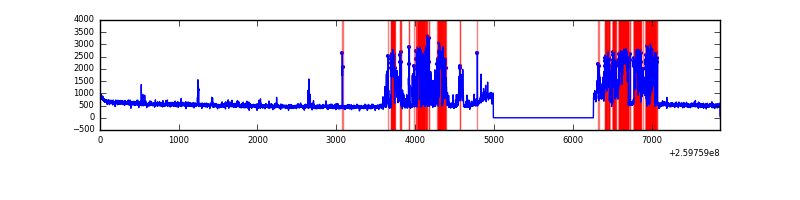 |
| C | 7867 | 6597 | 3 | 3 | 0.04% | 0.05% |  |
| D | 7867 | 6597 | 1 | 1 | 0.01% | 0.02% | 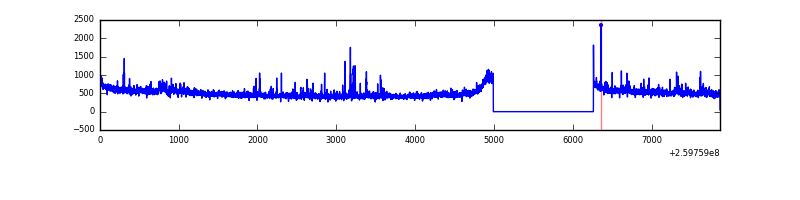 |
Top three noisy pixels from each quadrant. If the there are fewer than three noisy pixels in the level2.evt file, extra rows are filled as -1
| Pixel properties | Quadrant properties | ||||||
|---|---|---|---|---|---|---|---|
| Quadrant | DetID | PixID | Counts | Sigma | Mean | Median | Sigma |
| A | 0 | 226 | 7931 | 39.84 | 887 | 870 | 177.2 |
| A | 12 | 194 | 6536 | 31.97 | 887 | 870 | 177.2 |
| A | 1 | 162 | 5382 | 25.46 | 887 | 870 | 177.2 |
| B | 3 | 64 | 1595384 | 10068.17 | 854 | 835 | 158.4 |
| B | 0 | 214 | 34606 | 213.23 | 854 | 835 | 158.4 |
| B | 12 | 111 | 18103 | 109.03 | 854 | 835 | 158.4 |
| C | 3 | 233 | 91223 | 461.9 | 857 | 862 | 195.6 |
| C | 0 | 207 | 38296 | 191.35 | 857 | 862 | 195.6 |
| C | 10 | 9 | 9098 | 42.1 | 857 | 862 | 195.6 |
| D | 8 | 195 | 89569 | 442.17 | 851 | 830 | 200.7 |
| D | 14 | 35 | 48678 | 238.42 | 851 | 830 | 200.7 |
| D | 2 | 234 | 21575 | 103.37 | 851 | 830 | 200.7 |
Histogram calculated using DETX and DETY for each event in the final _common_clean file
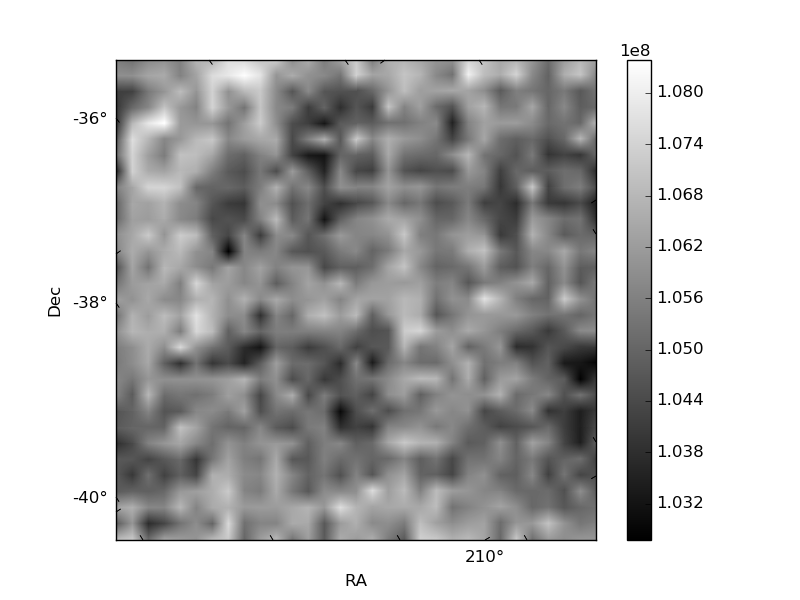
| Quadrant A |  |
 |
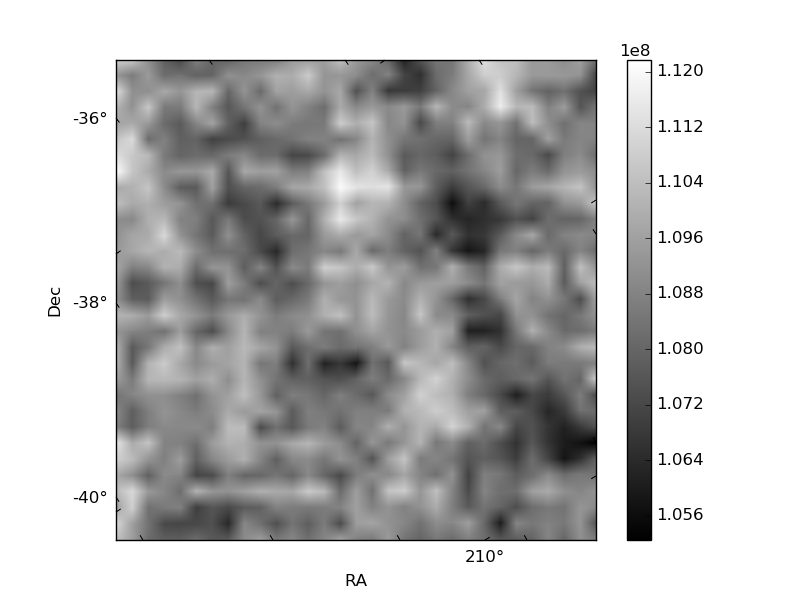
Quadrant B |
|---|---|---|---|
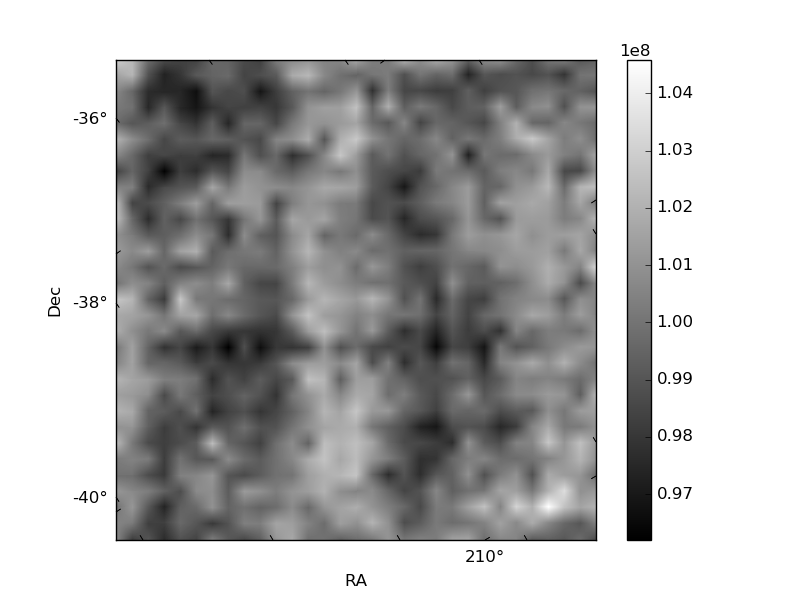
| Quadrant D | 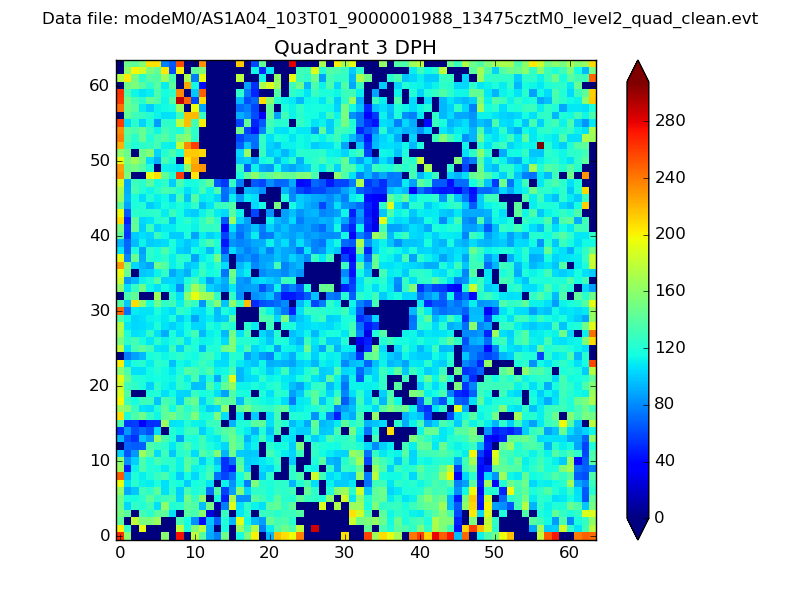 |
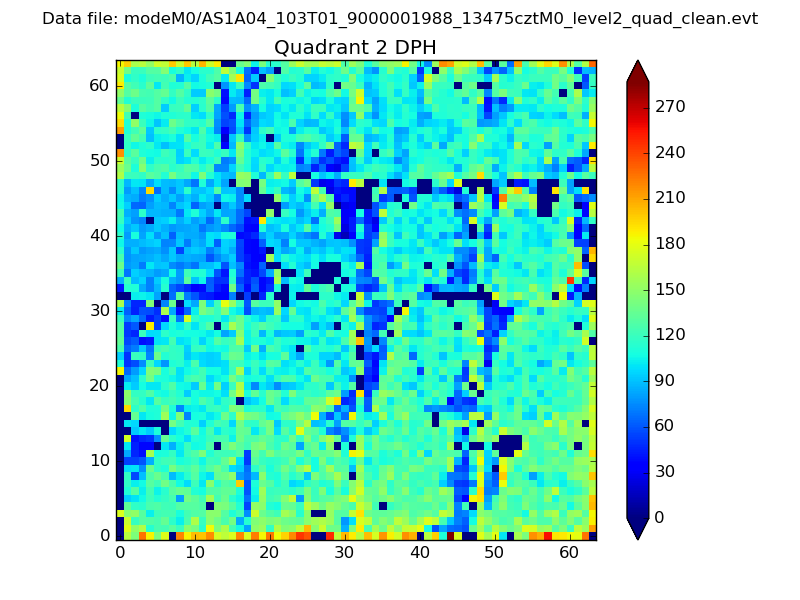 |
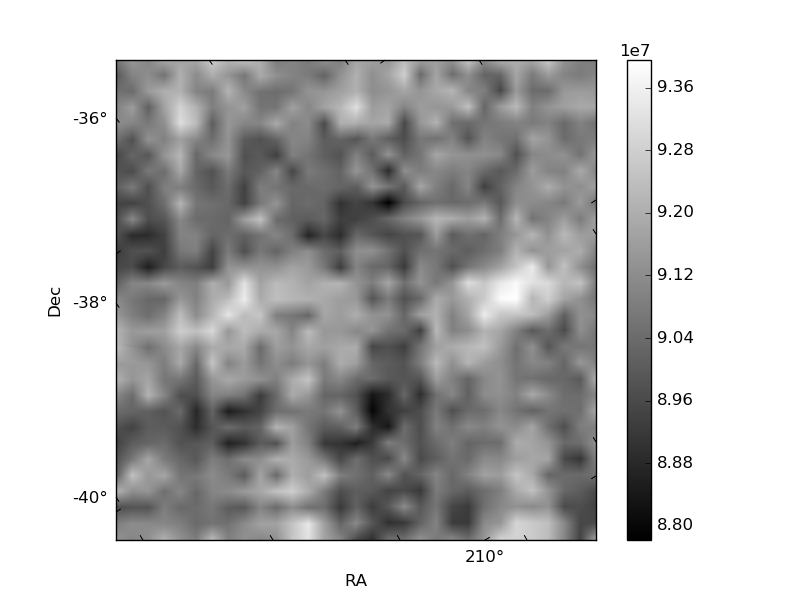
Quadrant C |
| Plot type | Count rate plots | Images |
|---|---|---|
| Comparison with Poisson distribution Blue bars denote a histogram of data divided into 1 sec bins. Red curve is a Poisson curve with rate = median count rate of data. |
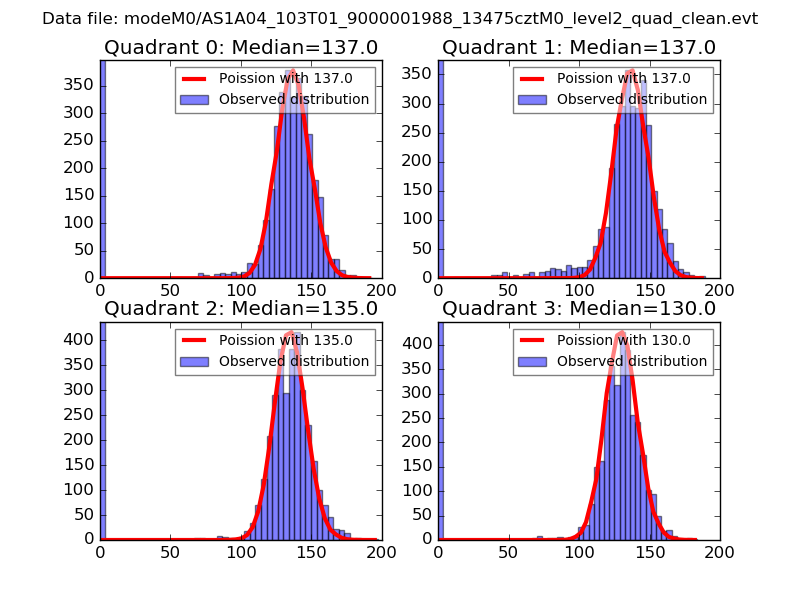 |
 |
| Quadrant-wise count rates Data is divided into 100 sec bins |
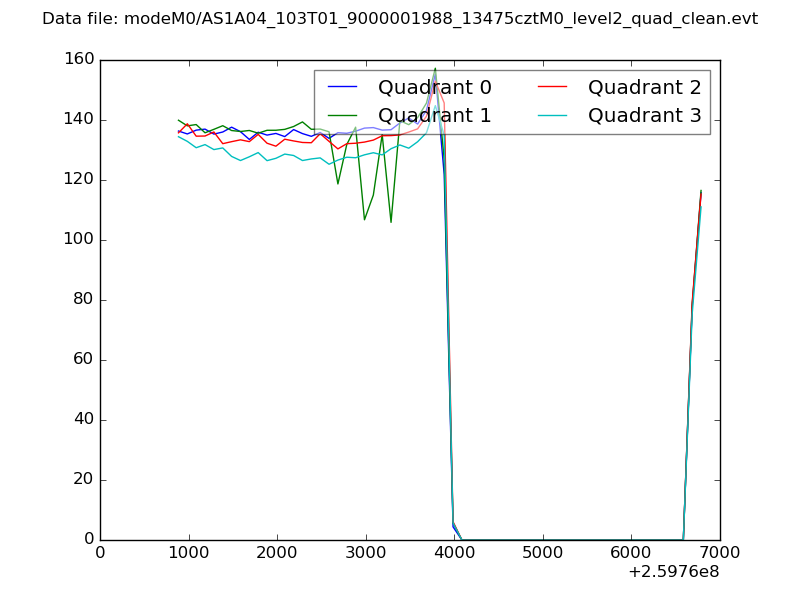 |
|
| Module-wise count rates for Quadrant A Data is divided into 100 sec bins |
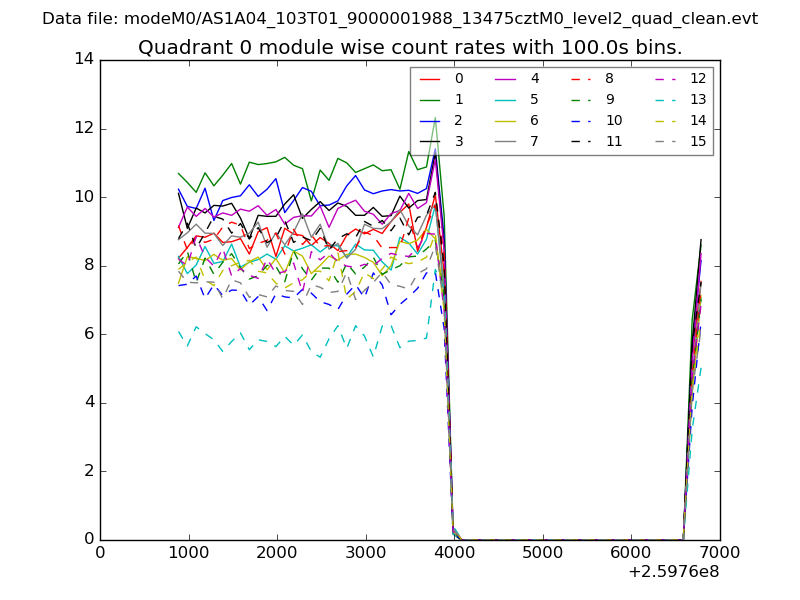 |
 |
| Module-wise count rates for Quadrant B Data is divided into 100 sec bins |
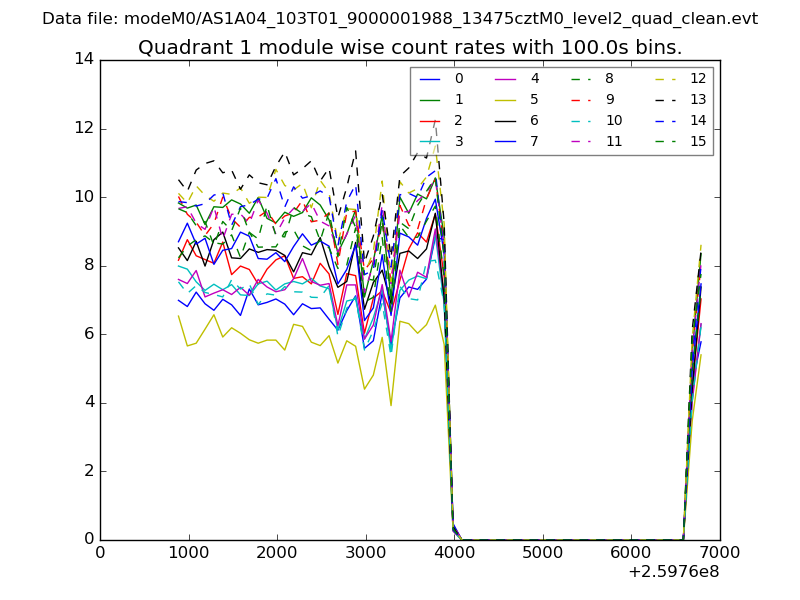 |
 |
| Module-wise count rates for Quadrant C Data is divided into 100 sec bins |
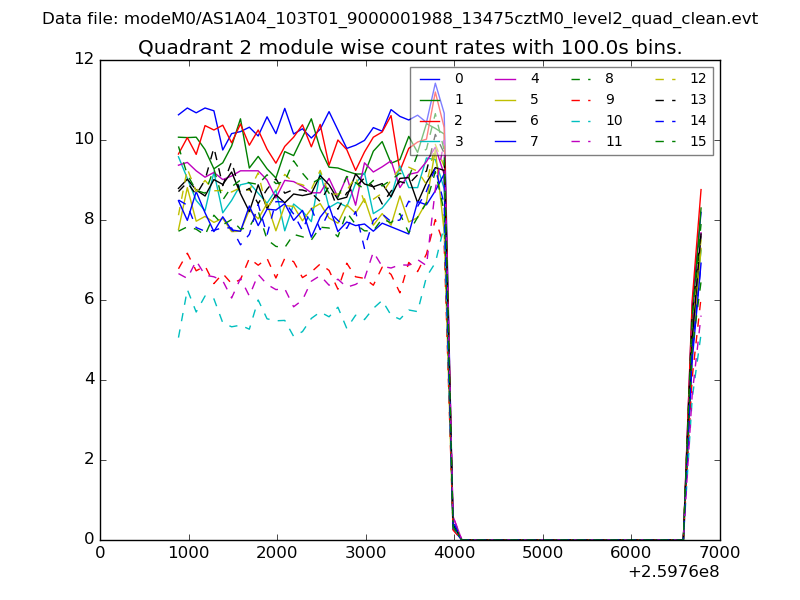 |
 |
| Module-wise count rates for Quadrant D Data is divided into 100 sec bins |
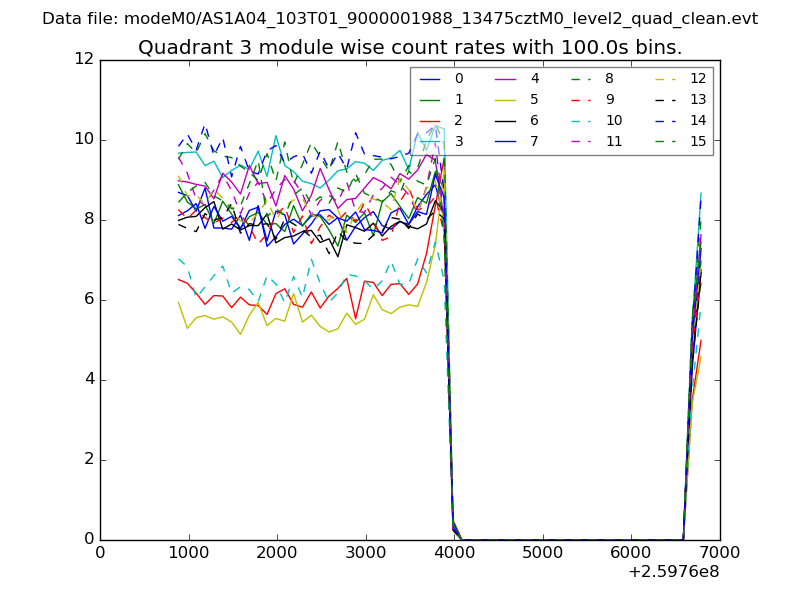 |
 |
| Parameter | Plot |
|---|---|
| CZT HV Monitor |  |
| D_VDD | 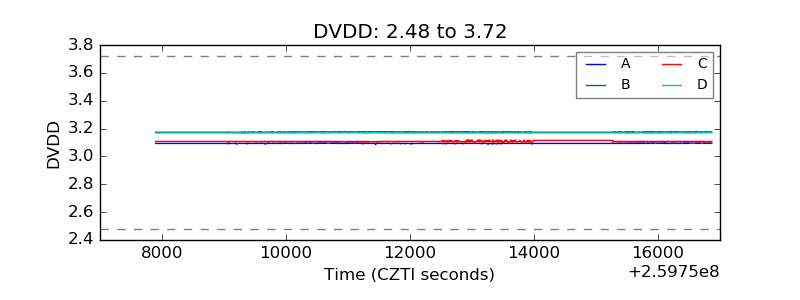 |
| Temperature 1 | 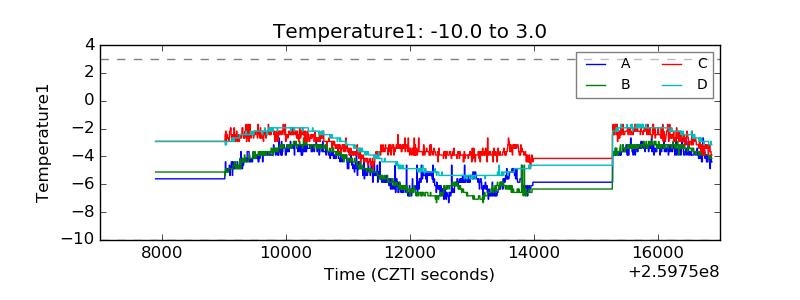 |
| Veto HV Monitor | 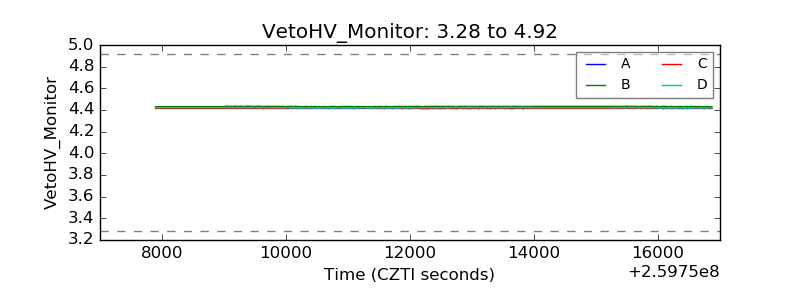 |
| Veto LLD | 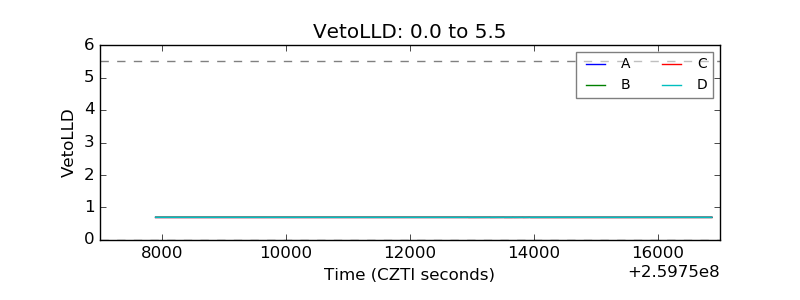 |
| Alpha Counter | 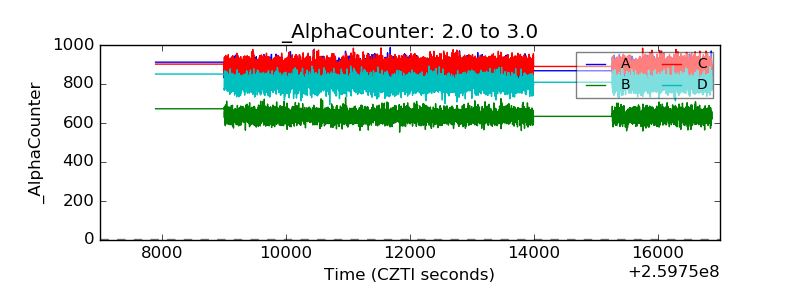 |
| _CPM_Rate | 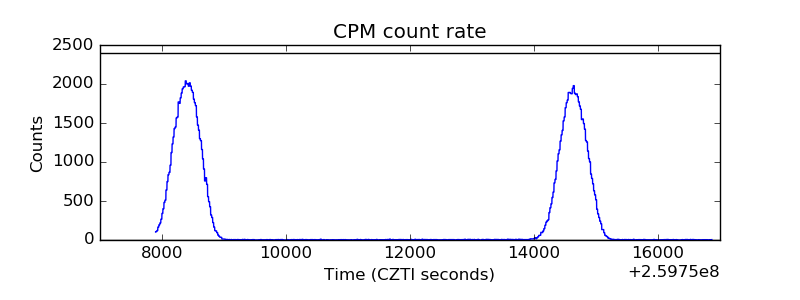 |
| CZT Counter | 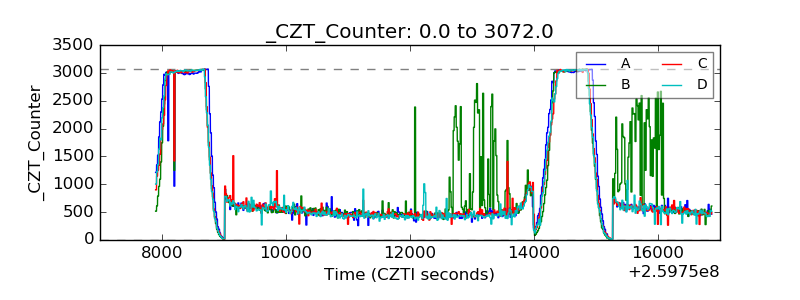 |
| +2.5 Volts monitor |  |
| +5 Volts monitor |  |
| _ROLL_ROT | 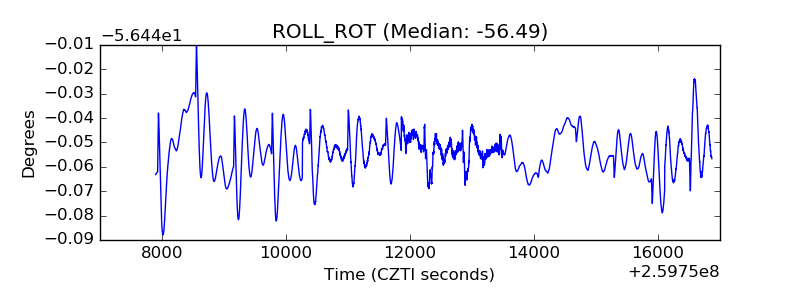 |
| _Roll_DEC | 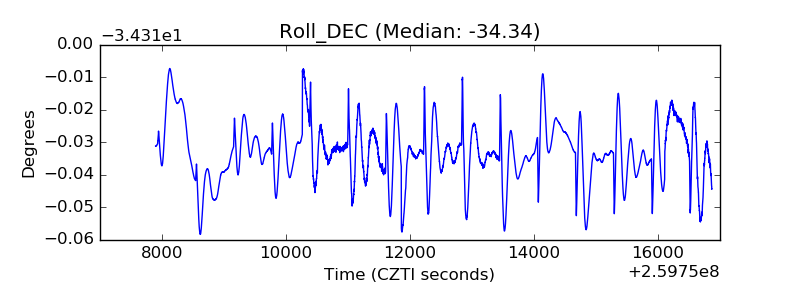 |
| _Roll_RA | 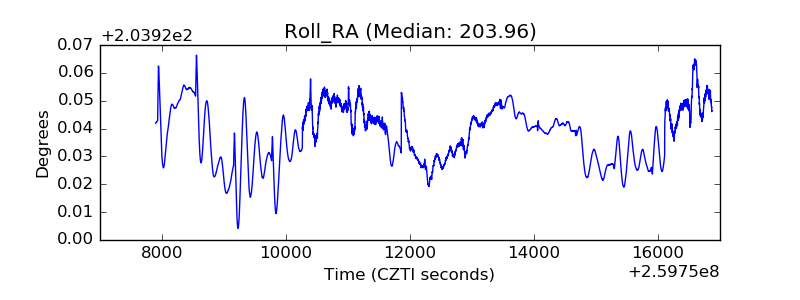 |
| Veto Counter | 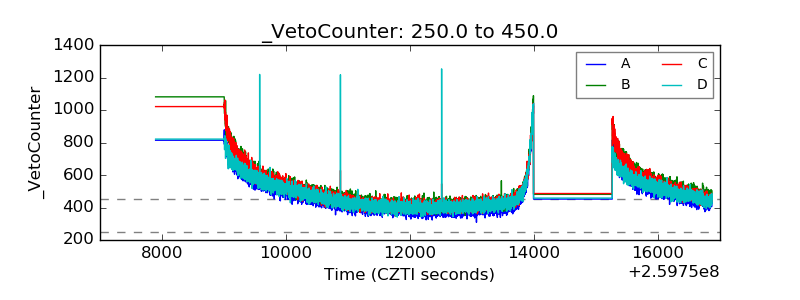 |