| Param | Original file | Final file |
|---|---|---|
| Filename | modeM0/AS1A04_103T01_9000001988_13477cztM0_level2.evt | modeM0/AS1A04_103T01_9000001988_13477cztM0_level2_quad_clean.evt |
| Size (bytes) | 347,855,040 | 73,992,960 |
| Size | 331.7 MB | 70.6 MB |
| Events in quadrant A | 2,422,350 | 478,928 |
| Events in quadrant B | 2,472,816 | 488,776 |
| Events in quadrant C | 2,414,152 | 471,993 |
| Events in quadrant D | 2,882,654 | 448,543 |
| Mode M0 | |||
|---|---|---|---|
| Quadrant | BADHDUFLAG | Total packets | Discarded packets |
| A | 0 | 13443 | 2927 |
| B | 0 | 13803 | 3236 |
| C | 0 | 13424 | 3002 |
| D | 0 | 15117 | 3094 |
| Mode SS | |||
|---|---|---|---|
| Quadrant | BADHDUFLAG | Total packets | Discarded packets |
| A | 0 | 130 | 30 |
| B | 0 | 129 | 27 |
| C | 0 | 129 | 27 |
| D | 0 | 130 | 28 |
| Mode M9 | |||
|---|---|---|---|
| Quadrant | BADHDUFLAG | Total packets | Discarded packets |
| A | 0 | 12 | 0 |
| B | 0 | 13 | 5 |
| C | 0 | 12 | 2 |
| D | 0 | 12 | 3 |
| Quadrant | Total seconds | Saturated seconds | Saturation percentage |
|---|---|---|---|
| A | 5055 | 47 | 0.929773% |
| B | 5023 | 57 | 1.134780% |
| C | 5025 | 26 | 0.517413% |
| D | 5028 | 74 | 1.471758% |
Noise dominated data is calculated using 1-second bins in cleaned event files. If a bin has >2000 counts, and if more than 50% of those come from <1% of pixels, then it is considered to be noise-dominated and hence unusable.
| Quadrant | # 1 sec bins | Bins with >0 counts | Bins with >2000 counts | High rate bins dominated by noise | Noise dominated (total time) | Noise dominated (detector-on time) | Marked lightcurve |
|---|---|---|---|---|---|---|---|
| A | 7178 | 5204 | 0 | 0 | 0.00% | 0.00% | 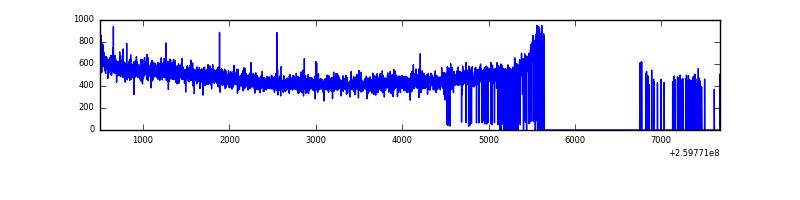 |
| B | 7155 | 5177 | 1 | 1 | 0.01% | 0.02% | 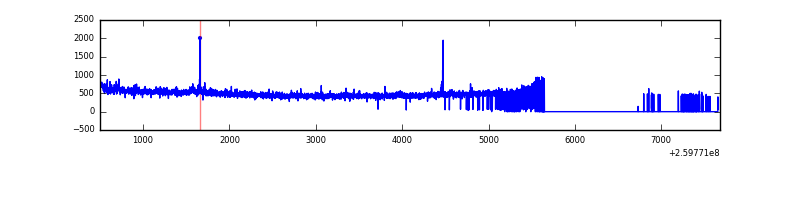 |
| C | 7130 | 5177 | 0 | 0 | 0.00% | 0.00% | 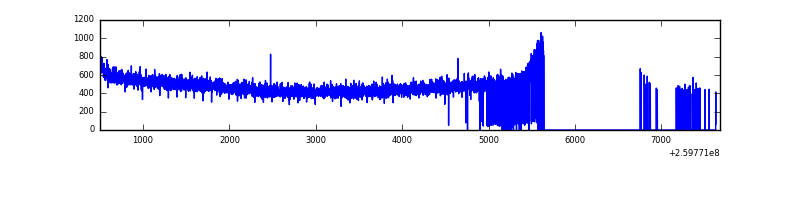 |
| D | 7119 | 5174 | 71 | 71 | 1.00% | 1.37% | 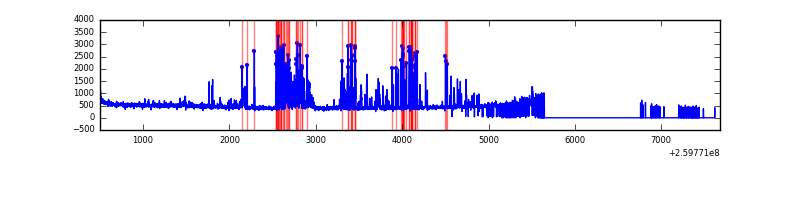 |
Top three noisy pixels from each quadrant. If the there are fewer than three noisy pixels in the level2.evt file, extra rows are filled as -1
| Pixel properties | Quadrant properties | ||||||
|---|---|---|---|---|---|---|---|
| Quadrant | DetID | PixID | Counts | Sigma | Mean | Median | Sigma |
| A | 1 | 162 | 12077 | 90.81 | 625 | 613 | 126.2 |
| A | 0 | 226 | 5584 | 39.38 | 625 | 613 | 126.2 |
| A | 12 | 194 | 4756 | 32.82 | 625 | 613 | 126.2 |
| B | 0 | 214 | 30892 | 256.63 | 621 | 605 | 118.0 |
| B | 12 | 111 | 13248 | 107.13 | 621 | 605 | 118.0 |
| B | 0 | 230 | 12307 | 99.15 | 621 | 605 | 118.0 |
| C | 3 | 233 | 68362 | 487.59 | 601 | 604 | 139.0 |
| C | 13 | 61 | 4394 | 27.27 | 601 | 604 | 139.0 |
| C | 14 | 220 | 2221 | 11.64 | 601 | 604 | 139.0 |
| D | 12 | 110 | 423852 | 3028.51 | 591 | 576 | 139.8 |
| D | 13 | 249 | 145068 | 1033.83 | 591 | 576 | 139.8 |
| D | 13 | 122 | 55987 | 396.46 | 591 | 576 | 139.8 |
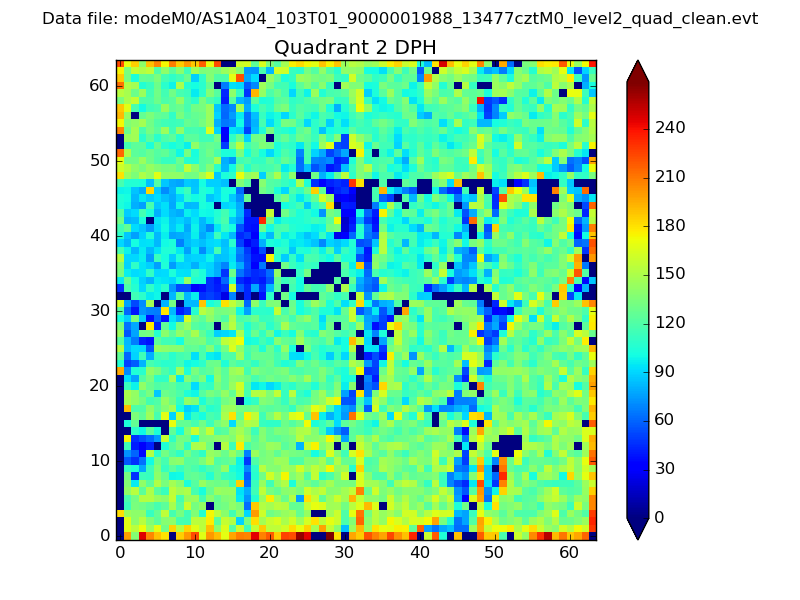
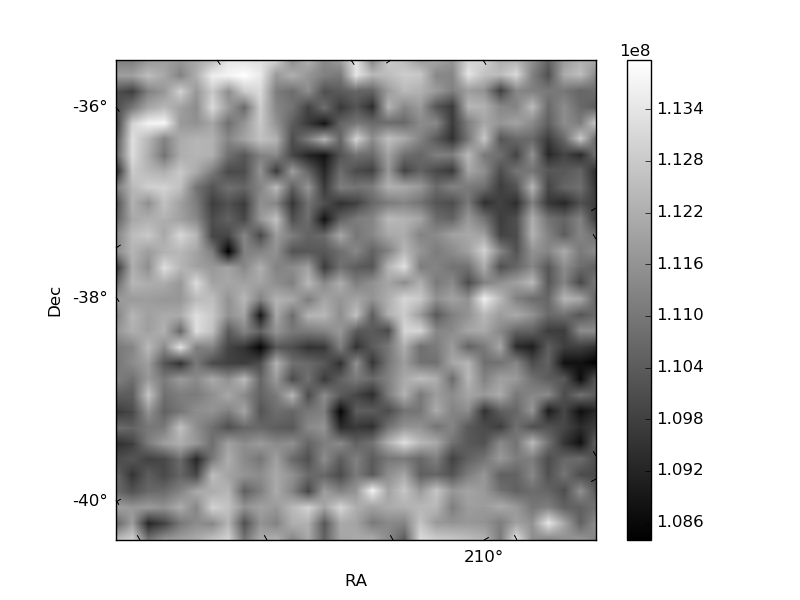
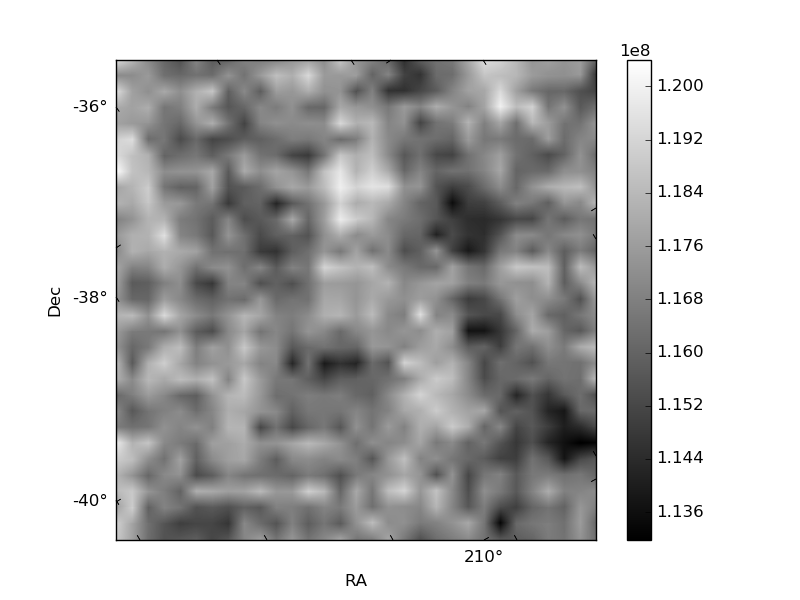
Histogram calculated using DETX and DETY for each event in the final _common_clean file
| Quadrant A | 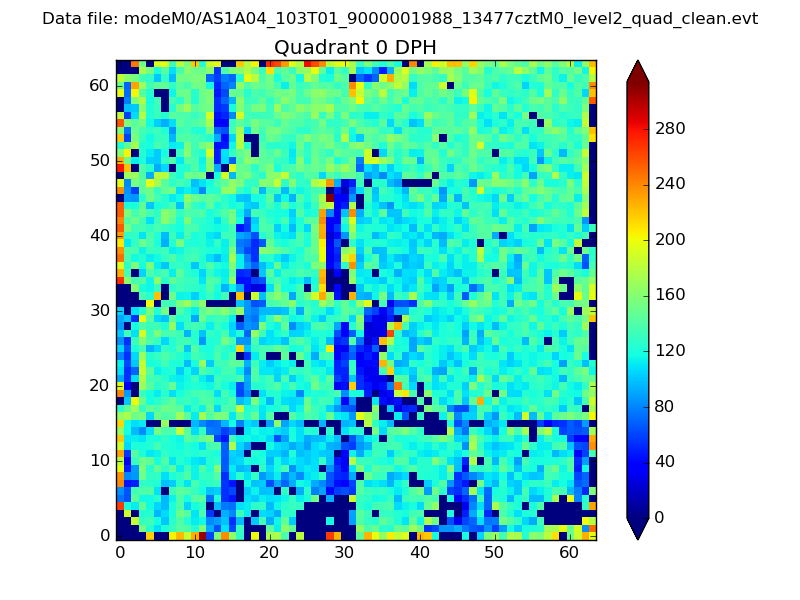 |
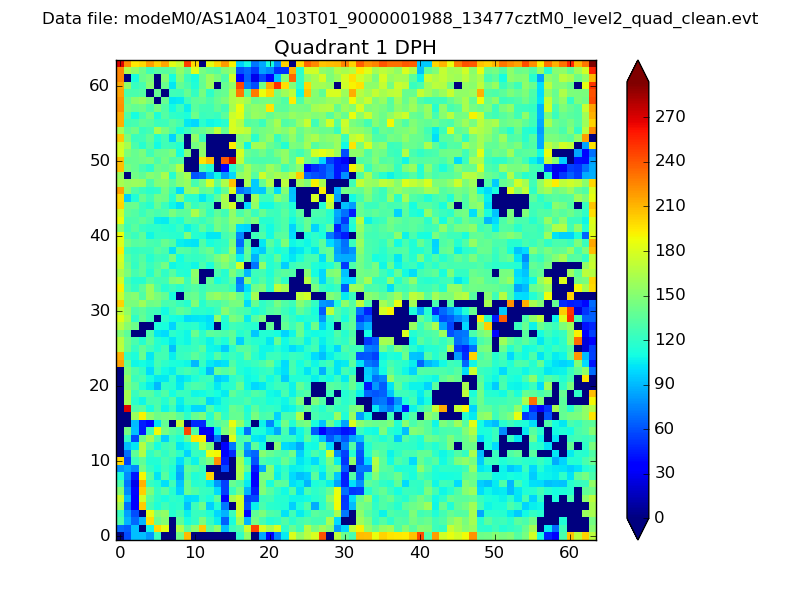 |
Quadrant B |
|---|---|---|---|
| Quadrant D | 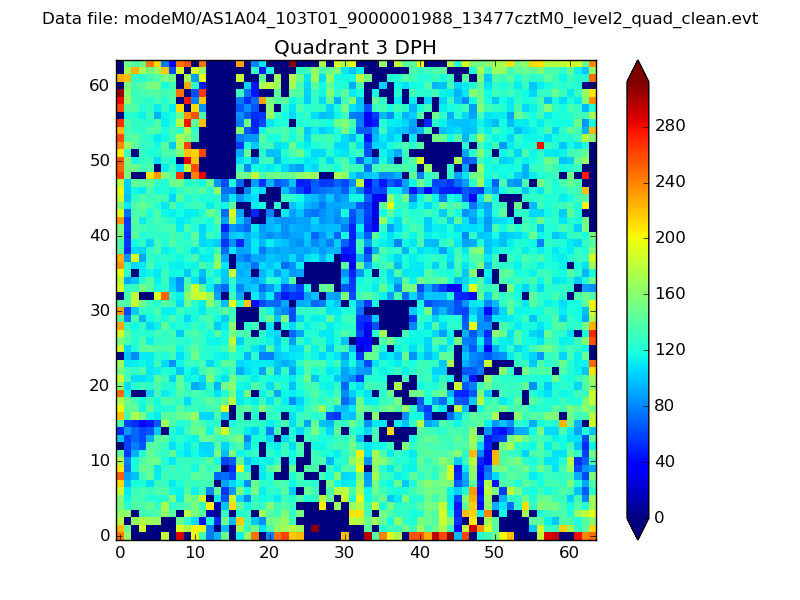 |
 |
Quadrant C |
| Plot type | Count rate plots | Images |
|---|---|---|
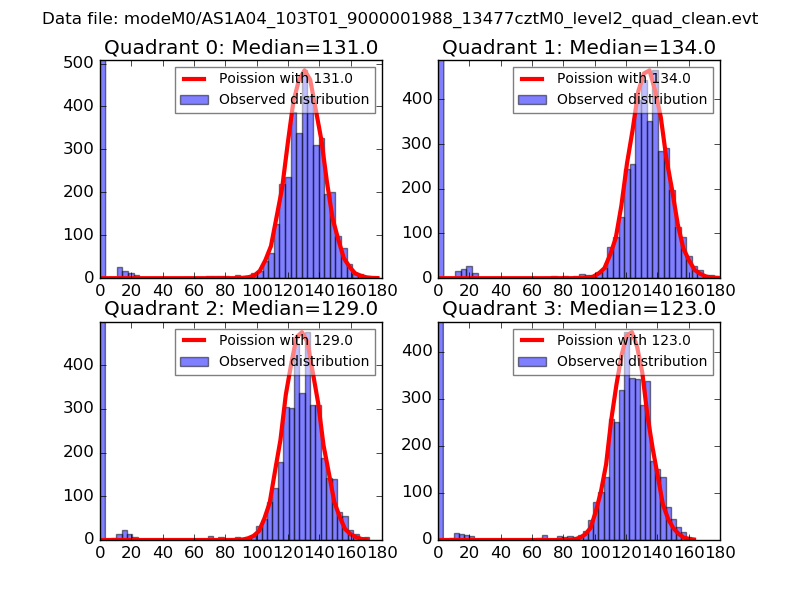
| Comparison with Poisson distribution Blue bars denote a histogram of data divided into 1 sec bins. Red curve is a Poisson curve with rate = median count rate of data. |
 |
 |
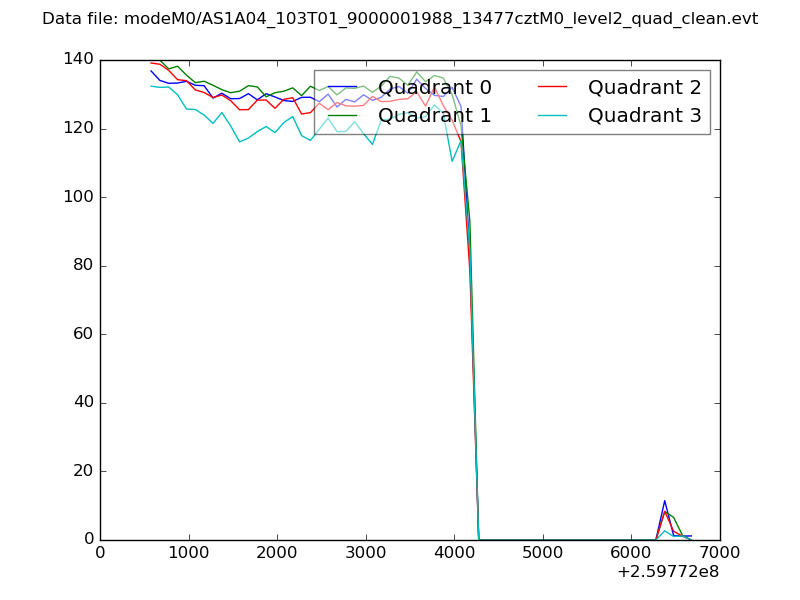
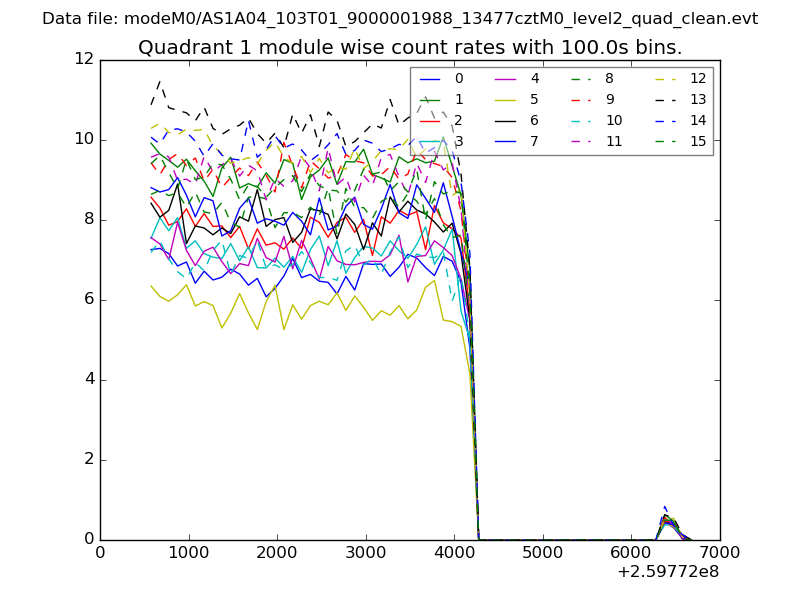
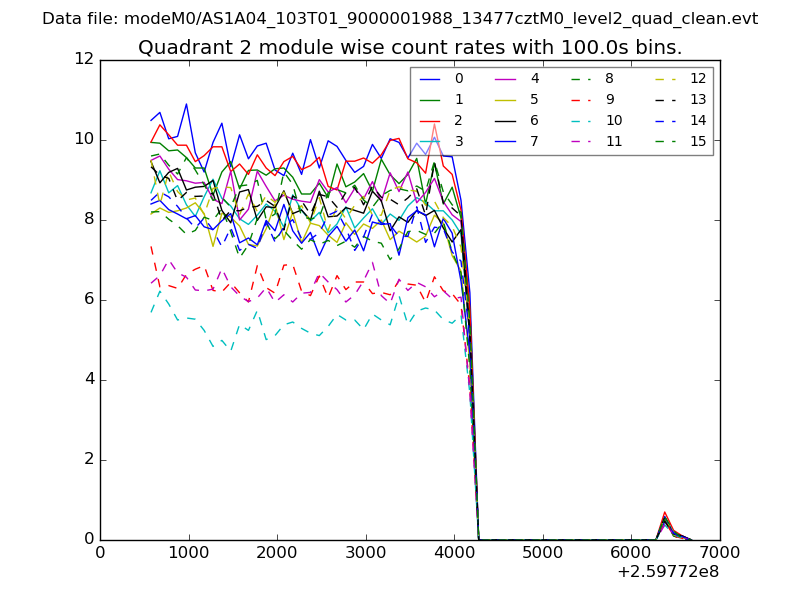
| Quadrant-wise count rates Data is divided into 100 sec bins |
 |
|
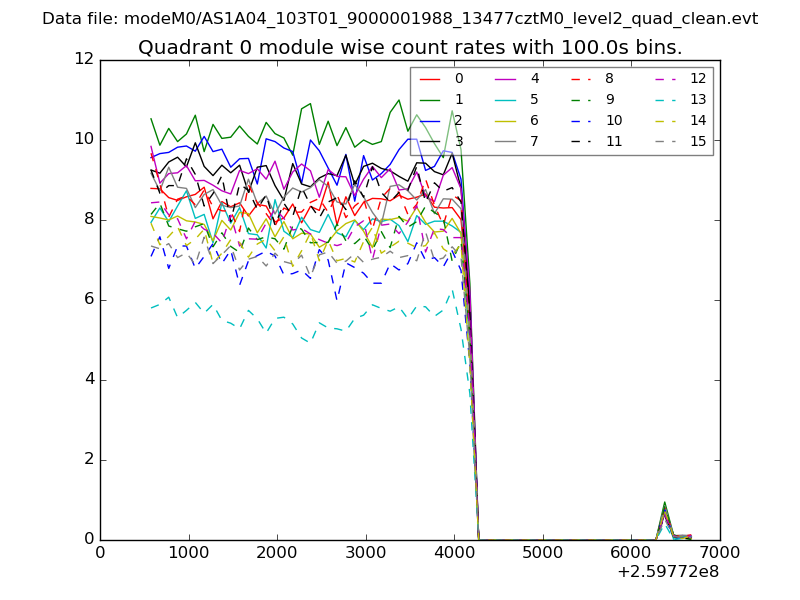
| Module-wise count rates for Quadrant A Data is divided into 100 sec bins |
 |
 |
| Module-wise count rates for Quadrant B Data is divided into 100 sec bins |
 |
 |
| Module-wise count rates for Quadrant C Data is divided into 100 sec bins |
 |
 |
| Module-wise count rates for Quadrant D Data is divided into 100 sec bins |
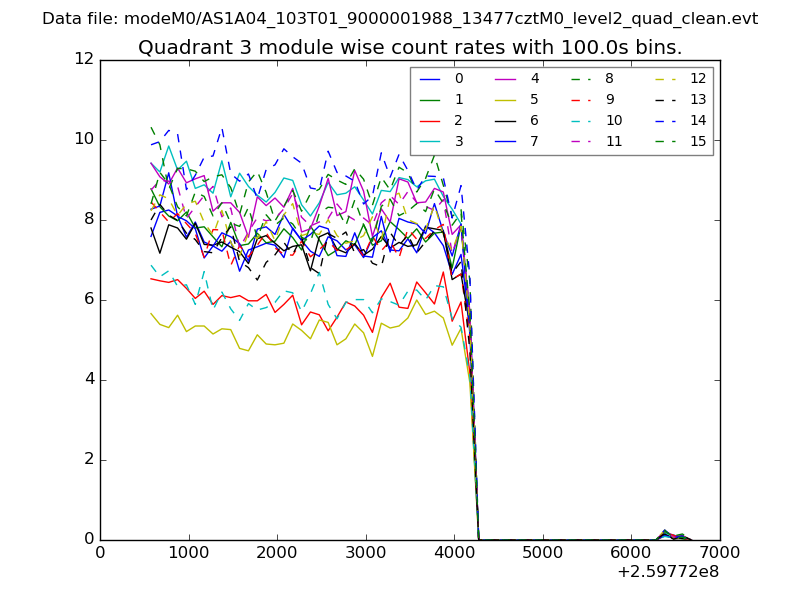 |
 |
| Parameter | Plot |
|---|---|
| CZT HV Monitor | 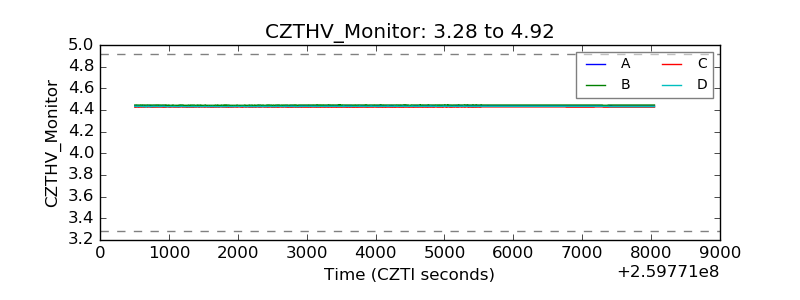 |
| D_VDD | 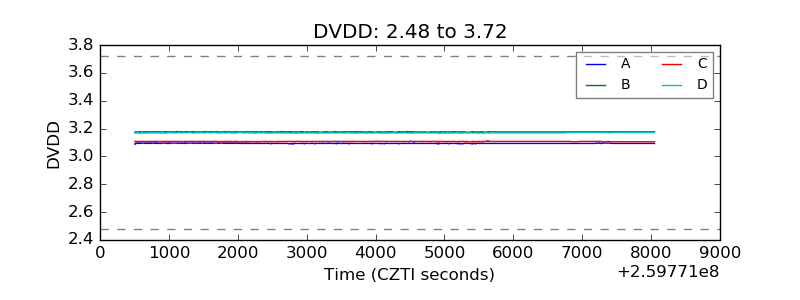 |
| Temperature 1 | 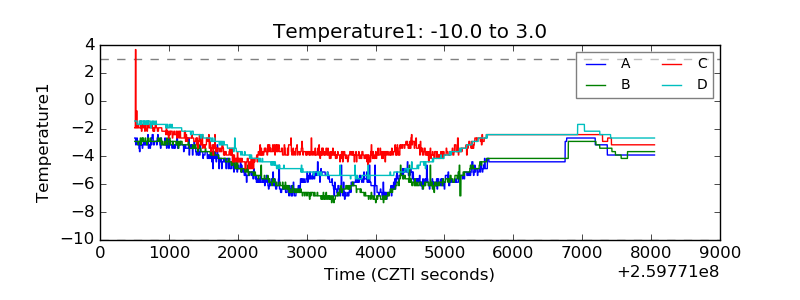 |
| Veto HV Monitor | 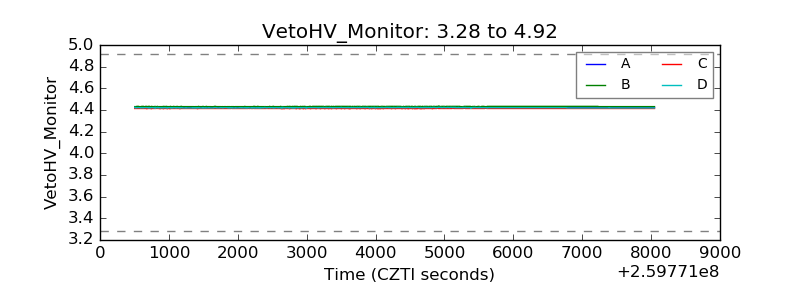 |
| Veto LLD | 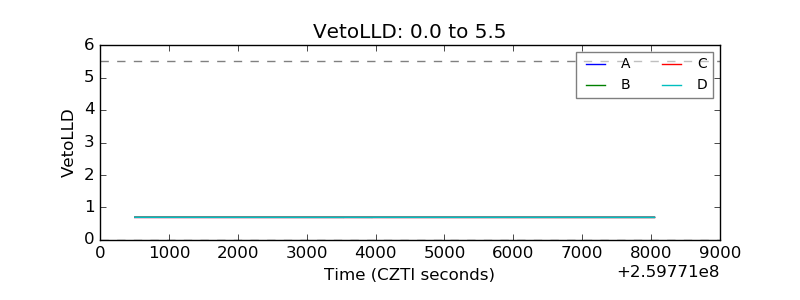 |
| Alpha Counter | 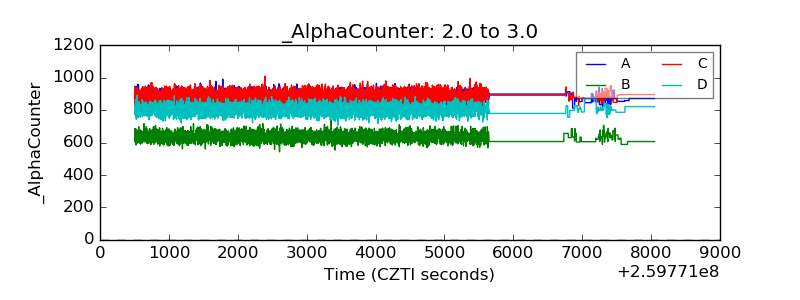 |
| _CPM_Rate | 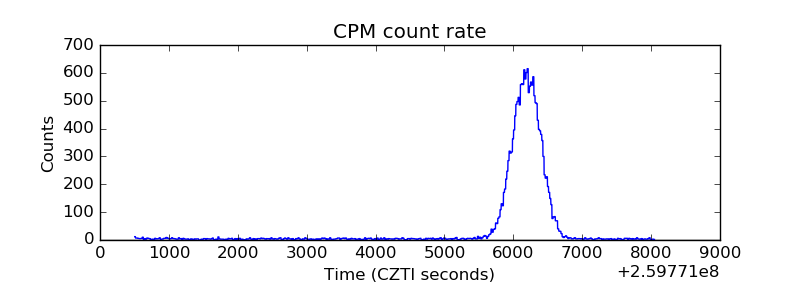 |
| CZT Counter | 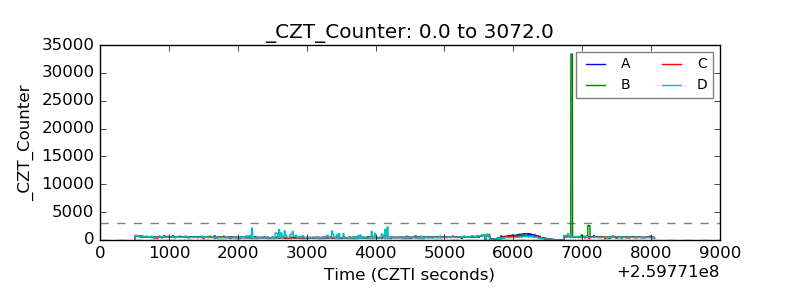 |
| +2.5 Volts monitor |  |
| +5 Volts monitor |  |
| _ROLL_ROT | 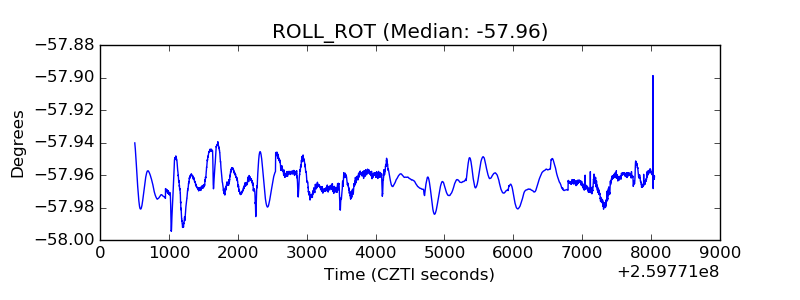 |
| _Roll_DEC | 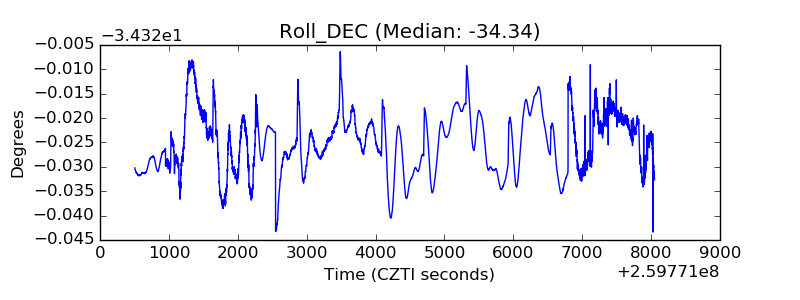 |
| _Roll_RA | 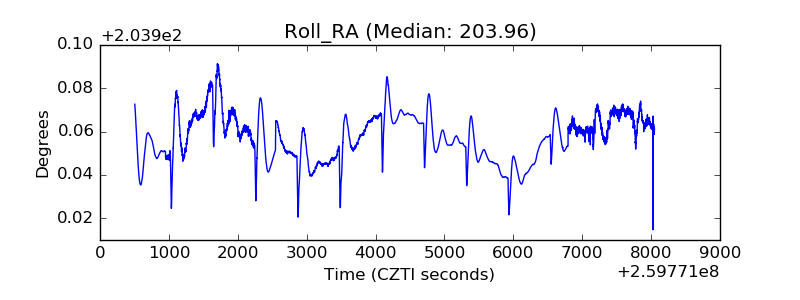 |
| Veto Counter | 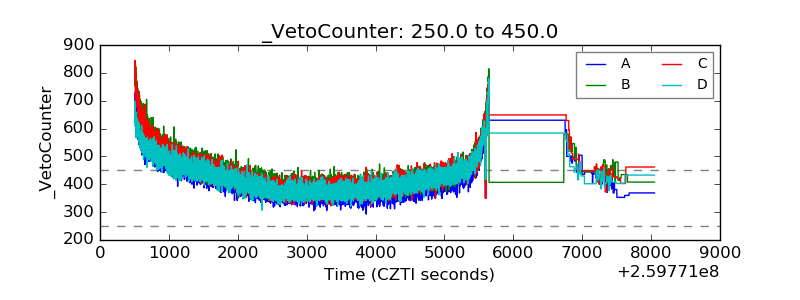 |