| Param | Original file | Final file |
|---|---|---|
| Filename | modeM0/AS1A04_103T01_9000001988_13478cztM0_level2.evt | modeM0/AS1A04_103T01_9000001988_13478cztM0_level2_quad_clean.evt |
| Size (bytes) | 700,611,840 | 160,159,680 |
| Size | 668.2 MB | 152.7 MB |
| Events in quadrant A | 4,964,230 | 1,042,950 |
| Events in quadrant B | 5,182,028 | 1,061,947 |
| Events in quadrant C | 4,952,111 | 1,032,095 |
| Events in quadrant D | 5,404,092 | 983,071 |
| Mode M0 | |||
|---|---|---|---|
| Quadrant | BADHDUFLAG | Total packets | Discarded packets |
| A | 0 | 21890 | 3 |
| B | 0 | 22297 | 2 |
| C | 0 | 21833 | 2 |
| D | 0 | 23788 | 2 |
| Mode SS | |||
|---|---|---|---|
| Quadrant | BADHDUFLAG | Total packets | Discarded packets |
| A | 0 | 214 | 0 |
| B | 0 | 214 | 0 |
| C | 0 | 214 | 0 |
| D | 0 | 214 | 0 |
| Mode M9 | |||
|---|---|---|---|
| Quadrant | BADHDUFLAG | Total packets | Discarded packets |
| A | 0 | 20 | 0 |
| B | 0 | 20 | 0 |
| C | 0 | 20 | 0 |
| D | 0 | 20 | 0 |
| Quadrant | Total seconds | Saturated seconds | Saturation percentage |
|---|---|---|---|
| A | 10565 | 115 | 1.088500% |
| B | 10565 | 180 | 1.703739% |
| C | 10565 | 74 | 0.700426% |
| D | 10565 | 149 | 1.410317% |
Noise dominated data is calculated using 1-second bins in cleaned event files. If a bin has >2000 counts, and if more than 50% of those come from <1% of pixels, then it is considered to be noise-dominated and hence unusable.
| Quadrant | # 1 sec bins | Bins with >0 counts | Bins with >2000 counts | High rate bins dominated by noise | Noise dominated (total time) | Noise dominated (detector-on time) | Marked lightcurve |
|---|---|---|---|---|---|---|---|
| A | 12471 | 10568 | 0 | 0 | 0.00% | 0.00% | 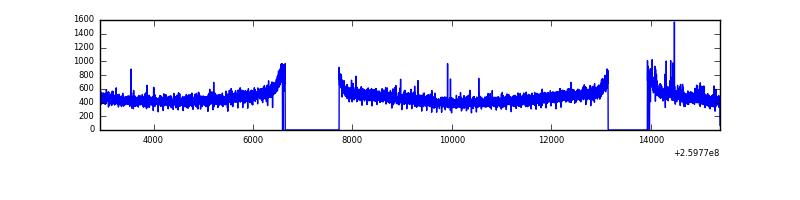 |
| B | 12471 | 10567 | 30 | 30 | 0.24% | 0.28% | 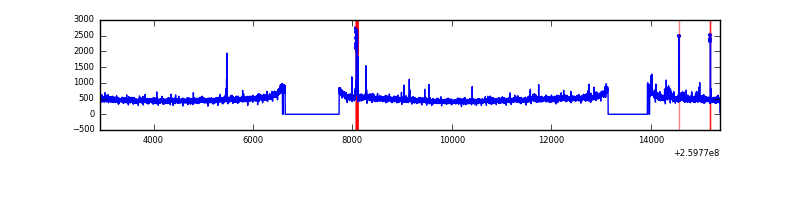 |
| C | 12471 | 10569 | 1 | 1 | 0.01% | 0.01% | 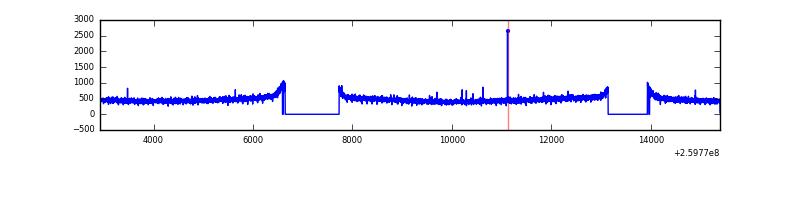 |
| D | 12471 | 10569 | 99 | 99 | 0.79% | 0.94% | 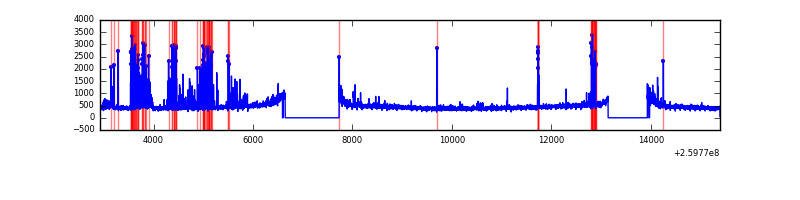 |
Top three noisy pixels from each quadrant. If the there are fewer than three noisy pixels in the level2.evt file, extra rows are filled as -1
| Pixel properties | Quadrant properties | ||||||
|---|---|---|---|---|---|---|---|
| Quadrant | DetID | PixID | Counts | Sigma | Mean | Median | Sigma |
| A | 1 | 162 | 27439 | 102.02 | 1273 | 1247 | 256.7 |
| A | 11 | 29 | 15029 | 53.68 | 1273 | 1247 | 256.7 |
| A | 8 | 15 | 13251 | 46.75 | 1273 | 1247 | 256.7 |
| B | 3 | 64 | 94136 | 383.92 | 1277 | 1247 | 241.9 |
| B | 0 | 214 | 59336 | 240.09 | 1277 | 1247 | 241.9 |
| B | 0 | 230 | 37232 | 148.73 | 1277 | 1247 | 241.9 |
| C | 3 | 233 | 114628 | 397.77 | 1239 | 1245 | 285.0 |
| C | 13 | 61 | 9113 | 27.6 | 1239 | 1245 | 285.0 |
| C | 14 | 234 | 6221 | 17.46 | 1239 | 1245 | 285.0 |
| D | 12 | 110 | 523409 | 1814.74 | 1218 | 1187 | 287.8 |
| D | 13 | 249 | 175924 | 607.22 | 1218 | 1187 | 287.8 |
| D | 13 | 122 | 64770 | 220.95 | 1218 | 1187 | 287.8 |
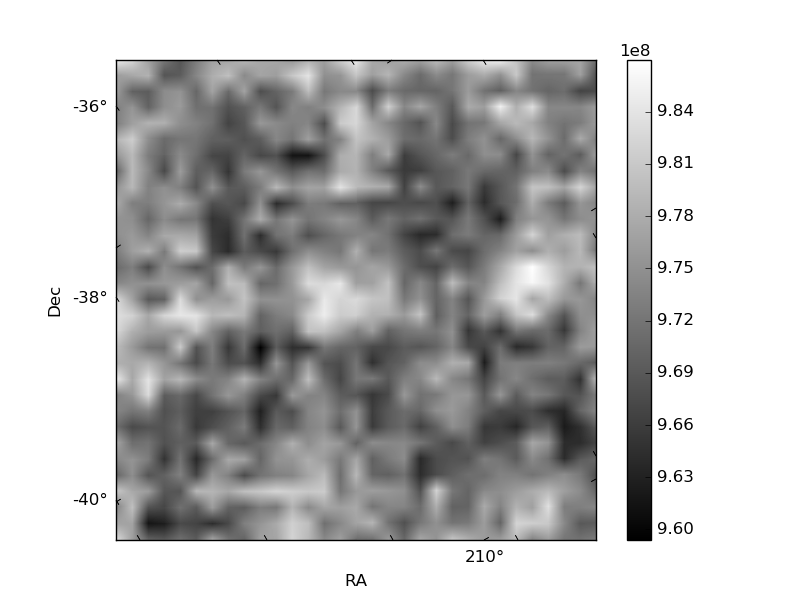
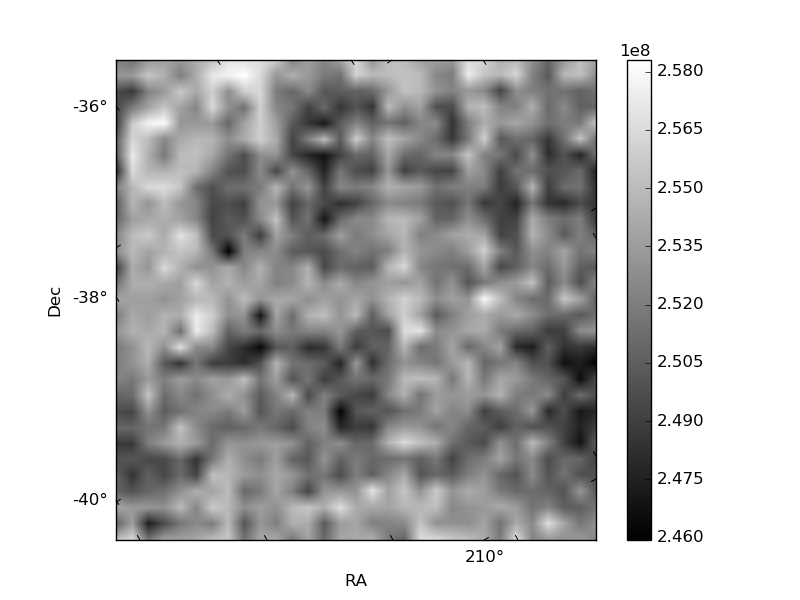
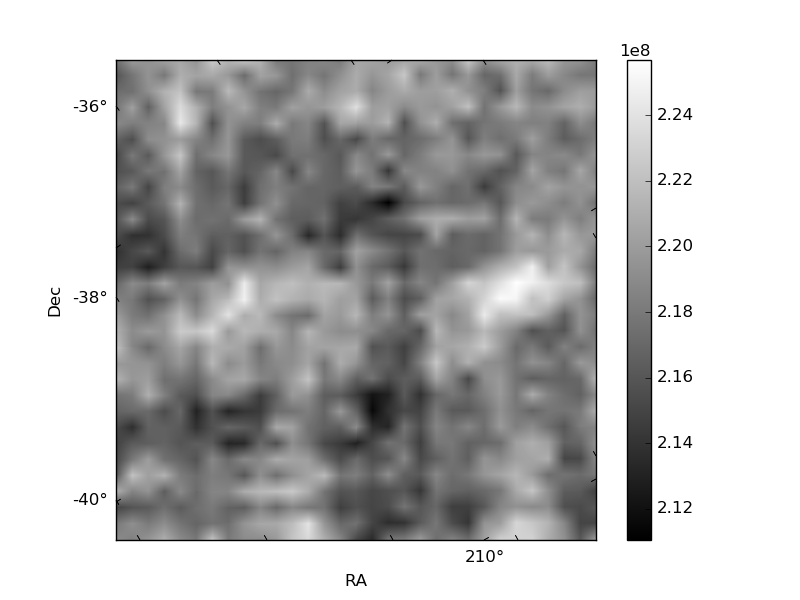
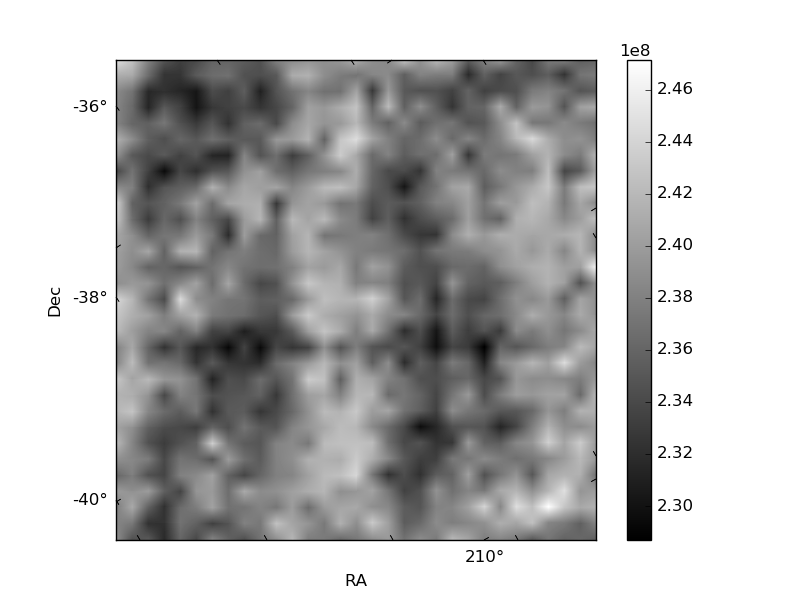
Histogram calculated using DETX and DETY for each event in the final _common_clean file
| Quadrant A | 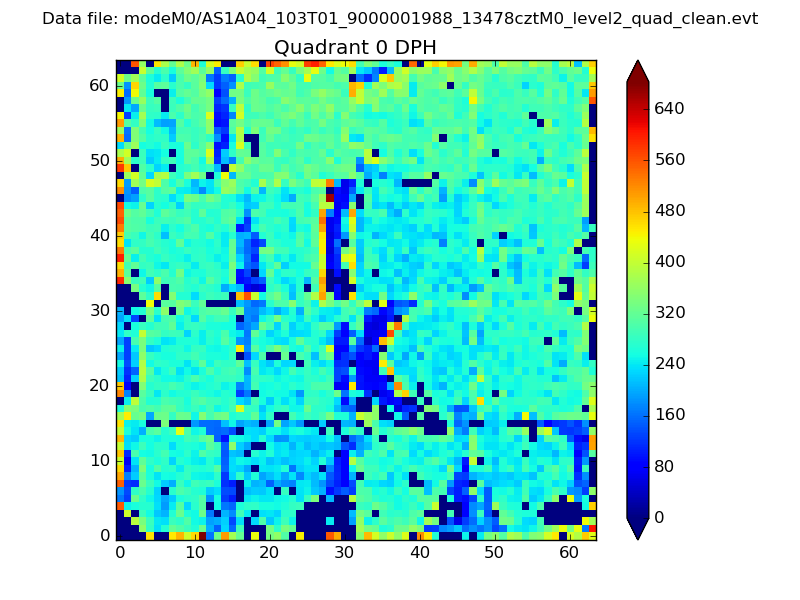 |
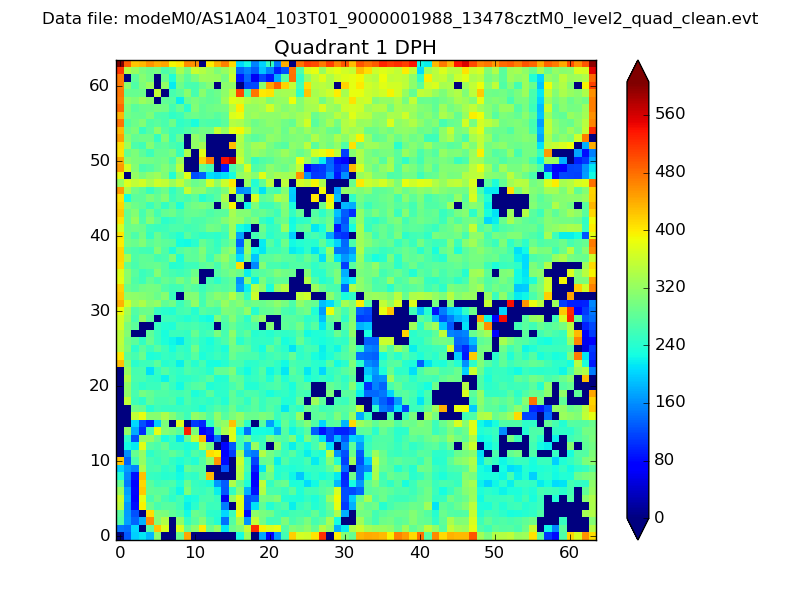 |
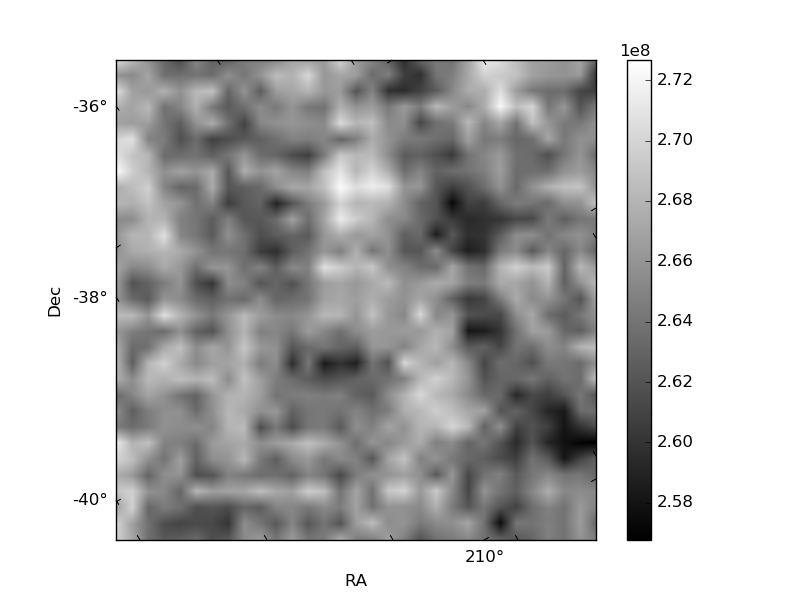
Quadrant B |
|---|---|---|---|
| Quadrant D | 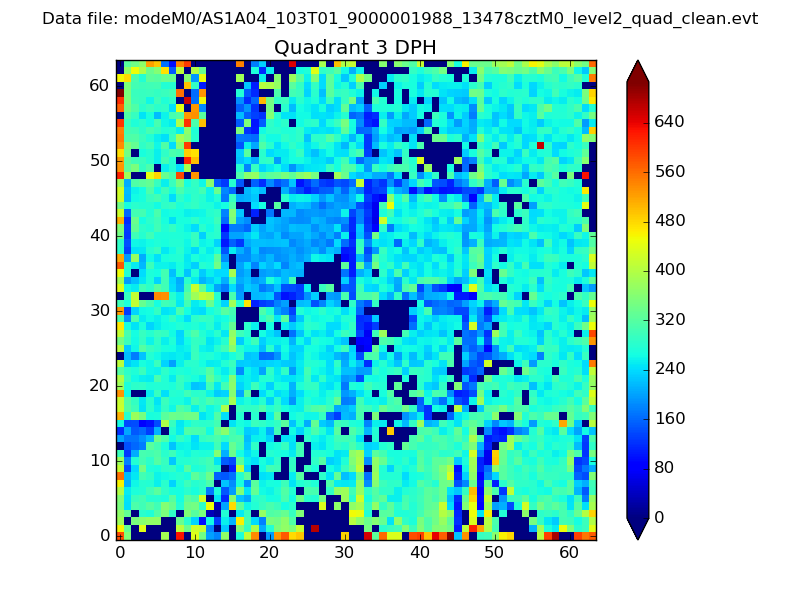 |
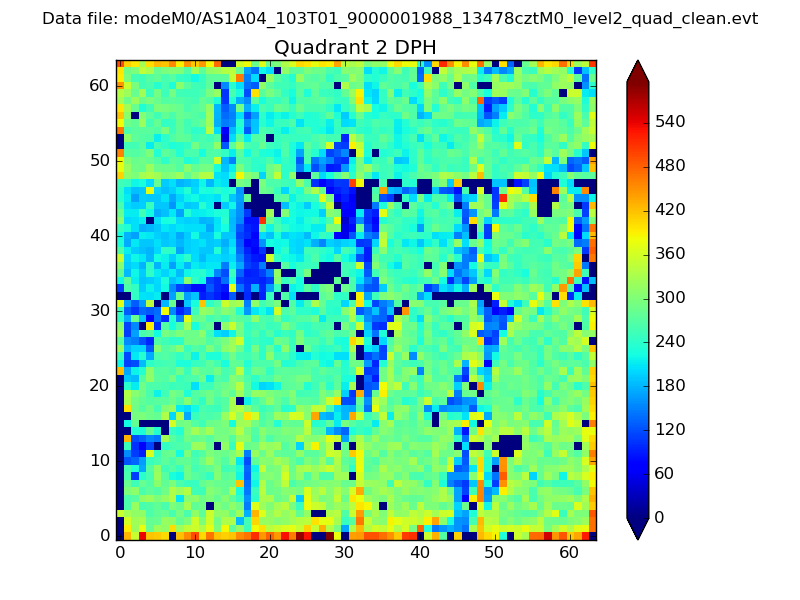 |
Quadrant C |
| Plot type | Count rate plots | Images |
|---|---|---|
| Comparison with Poisson distribution Blue bars denote a histogram of data divided into 1 sec bins. Red curve is a Poisson curve with rate = median count rate of data. |
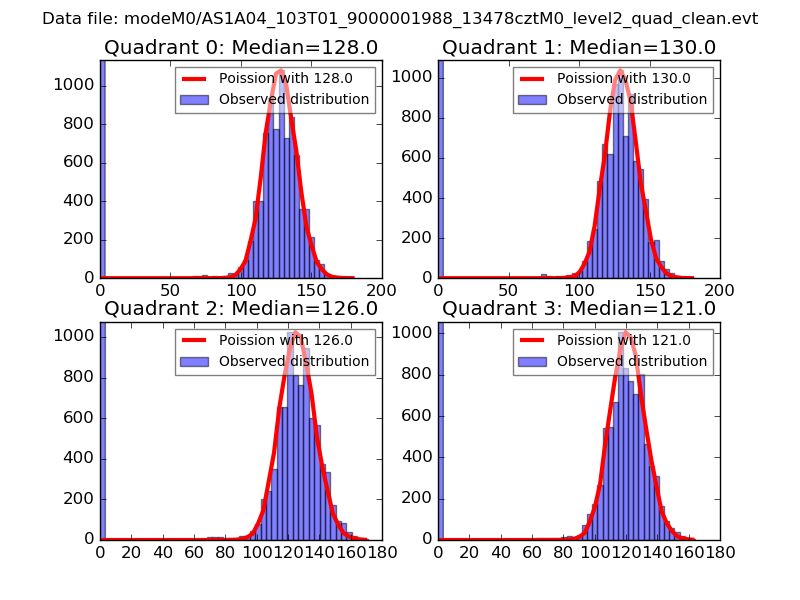 |
 |
| Quadrant-wise count rates Data is divided into 100 sec bins |
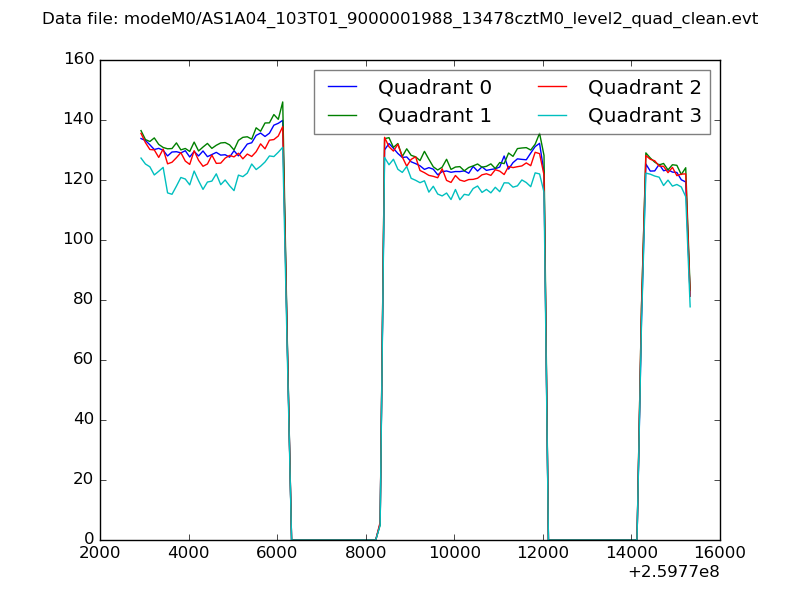 |
|
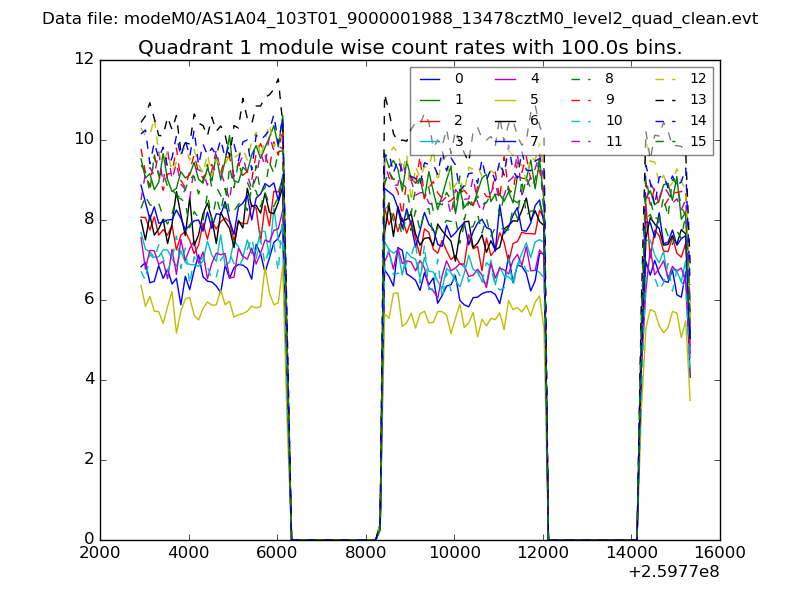
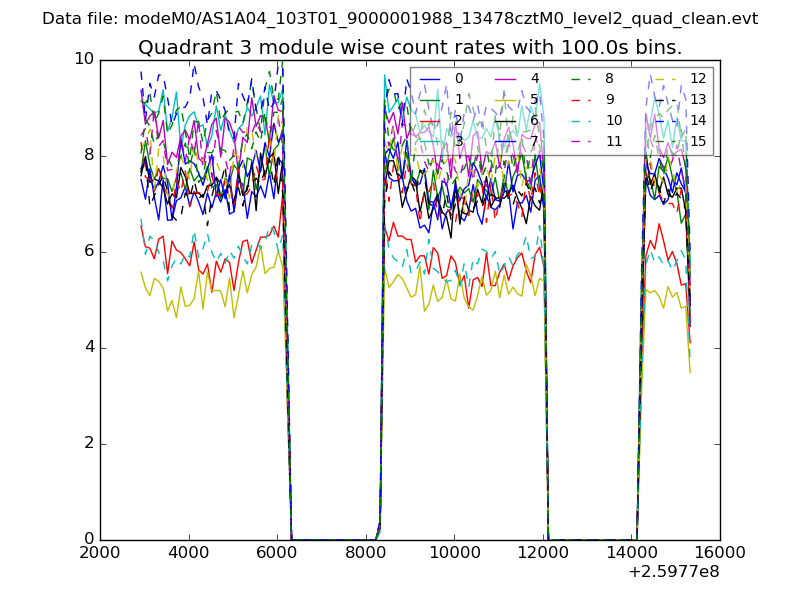
| Module-wise count rates for Quadrant A Data is divided into 100 sec bins |
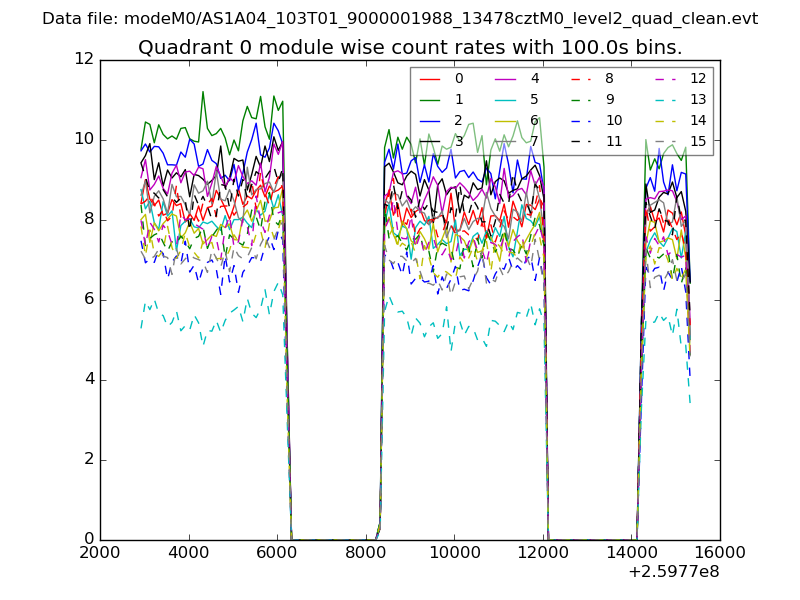 |
 |
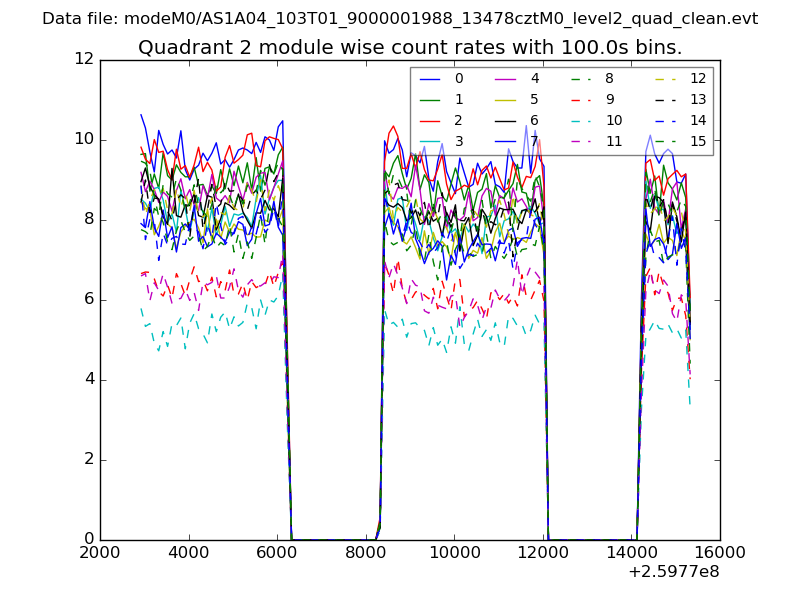
| Module-wise count rates for Quadrant B Data is divided into 100 sec bins |
 |
 |
| Module-wise count rates for Quadrant C Data is divided into 100 sec bins |
 |
 |
| Module-wise count rates for Quadrant D Data is divided into 100 sec bins |
 |
 |
| Parameter | Plot |
|---|---|
| CZT HV Monitor | 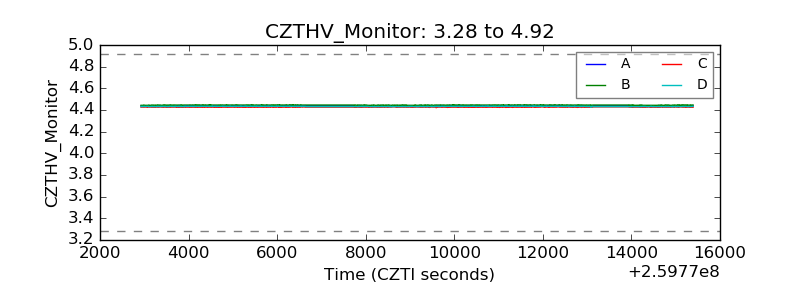 |
| D_VDD | 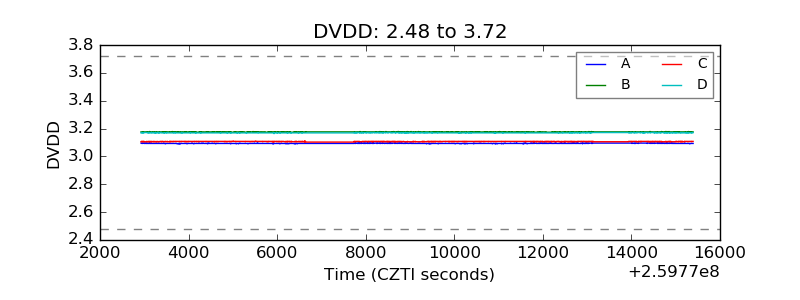 |
| Temperature 1 |  |
| Veto HV Monitor |  |
| Veto LLD | 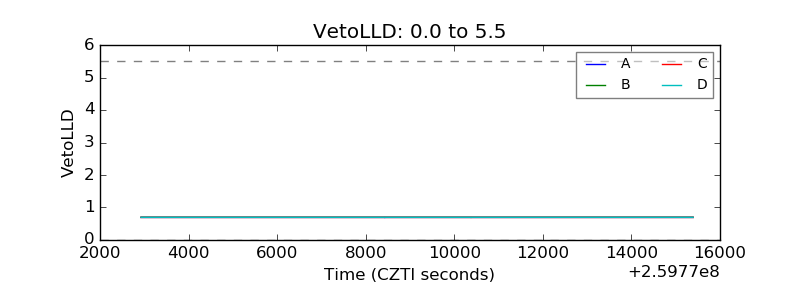 |
| Alpha Counter | 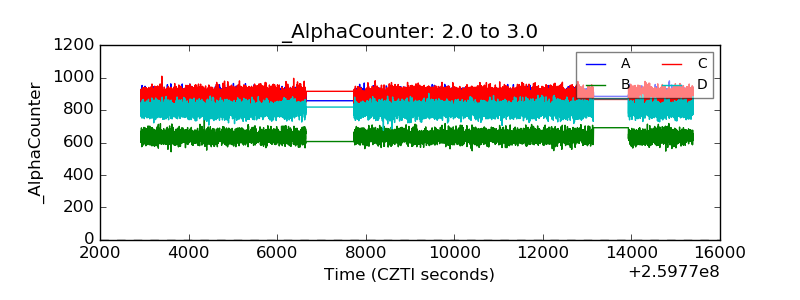 |
| _CPM_Rate | 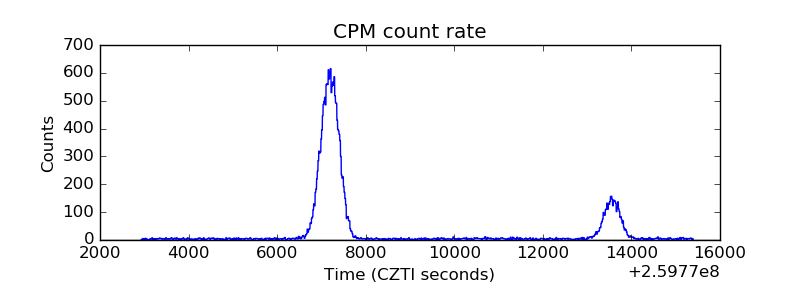 |
| CZT Counter | 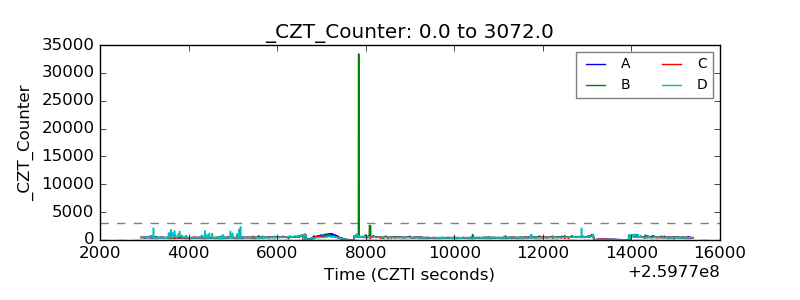 |
| +2.5 Volts monitor |  |
| +5 Volts monitor |  |
| _ROLL_ROT |  |
| _Roll_DEC |  |
| _Roll_RA | 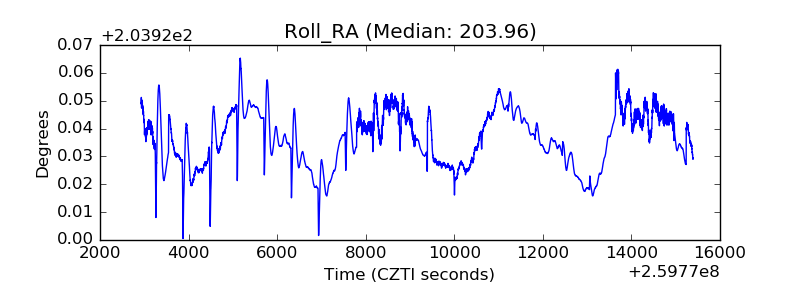 |
| Veto Counter | 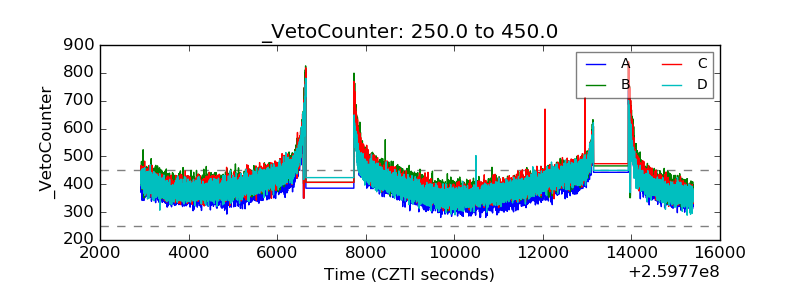 |