| Param | Original file | Final file |
|---|---|---|
| Filename | modeM0/AS1A04_103T01_9000001988_13479cztM0_level2.evt | modeM0/AS1A04_103T01_9000001988_13479cztM0_level2_quad_clean.evt |
| Size (bytes) | 494,043,840 | 105,935,040 |
| Size | 471.2 MB | 101.0 MB |
| Events in quadrant A | 3,582,134 | 674,779 |
| Events in quadrant B | 3,755,856 | 687,179 |
| Events in quadrant C | 3,551,547 | 672,029 |
| Events in quadrant D | 3,553,038 | 642,454 |
| Mode M0 | |||
|---|---|---|---|
| Quadrant | BADHDUFLAG | Total packets | Discarded packets |
| A | 0 | 15889 | 3 |
| B | 0 | 16221 | 2 |
| C | 0 | 15804 | 2 |
| D | 0 | 16312 | 2 |
| Mode SS | |||
|---|---|---|---|
| Quadrant | BADHDUFLAG | Total packets | Discarded packets |
| A | 0 | 154 | 0 |
| B | 0 | 154 | 0 |
| C | 0 | 154 | 0 |
| D | 0 | 154 | 0 |
| Mode M9 | |||
|---|---|---|---|
| Quadrant | BADHDUFLAG | Total packets | Discarded packets |
| A | 0 | 7 | 0 |
| B | 0 | 7 | 0 |
| C | 0 | 7 | 0 |
| D | 0 | 8 | 0 |
| Quadrant | Total seconds | Saturated seconds | Saturation percentage |
|---|---|---|---|
| A | 7650 | 63 | 0.823529% |
| B | 7650 | 115 | 1.503268% |
| C | 7650 | 35 | 0.457516% |
| D | 7650 | 44 | 0.575163% |
Noise dominated data is calculated using 1-second bins in cleaned event files. If a bin has >2000 counts, and if more than 50% of those come from <1% of pixels, then it is considered to be noise-dominated and hence unusable.
| Quadrant | # 1 sec bins | Bins with >0 counts | Bins with >2000 counts | High rate bins dominated by noise | Noise dominated (total time) | Noise dominated (detector-on time) | Marked lightcurve |
|---|---|---|---|---|---|---|---|
| A | 8061 | 7652 | 0 | 0 | 0.00% | 0.00% | 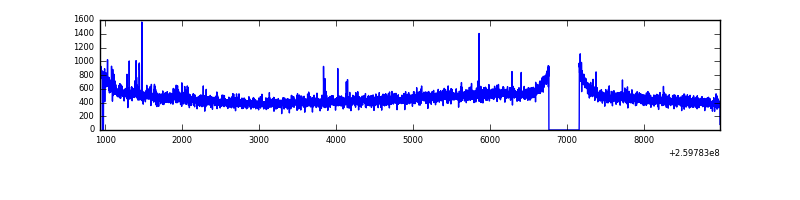 |
| B | 8061 | 7651 | 6 | 6 | 0.07% | 0.08% | 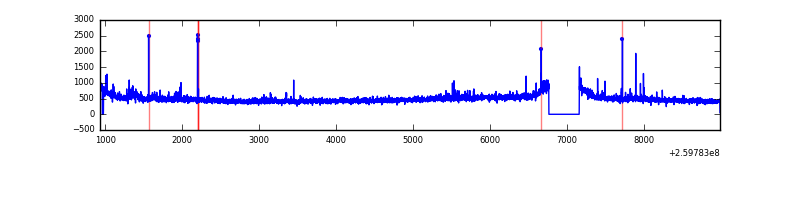 |
| C | 8061 | 7653 | 5 | 5 | 0.06% | 0.07% | 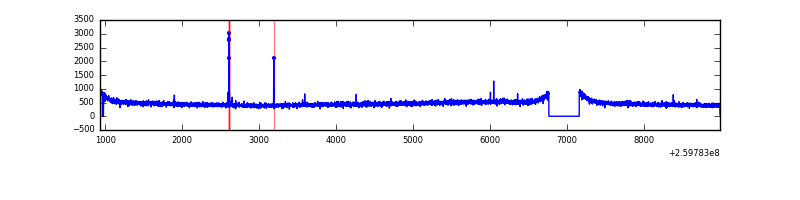 |
| D | 8061 | 7653 | 16 | 16 | 0.20% | 0.21% | 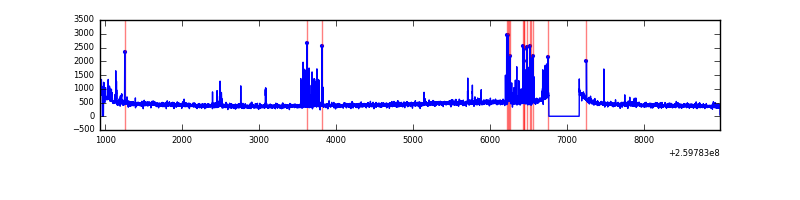 |
Top three noisy pixels from each quadrant. If the there are fewer than three noisy pixels in the level2.evt file, extra rows are filled as -1
| Pixel properties | Quadrant properties | ||||||
|---|---|---|---|---|---|---|---|
| Quadrant | DetID | PixID | Counts | Sigma | Mean | Median | Sigma |
| A | 8 | 15 | 24650 | 126.95 | 915 | 893 | 187.1 |
| A | 11 | 29 | 15773 | 79.51 | 915 | 893 | 187.1 |
| A | 1 | 162 | 15467 | 77.88 | 915 | 893 | 187.1 |
| B | 3 | 64 | 66344 | 371.28 | 920 | 897 | 176.3 |
| B | 4 | 142 | 32737 | 180.63 | 920 | 897 | 176.3 |
| B | 0 | 230 | 32041 | 176.68 | 920 | 897 | 176.3 |
| C | 3 | 233 | 56765 | 269.08 | 889 | 894 | 207.6 |
| C | 2 | 1 | 19440 | 89.32 | 889 | 894 | 207.6 |
| C | 0 | 207 | 11535 | 51.25 | 889 | 894 | 207.6 |
| D | 12 | 110 | 178898 | 843.87 | 875 | 850 | 211.0 |
| D | 2 | 234 | 26224 | 120.26 | 875 | 850 | 211.0 |
| D | 13 | 249 | 14918 | 66.67 | 875 | 850 | 211.0 |
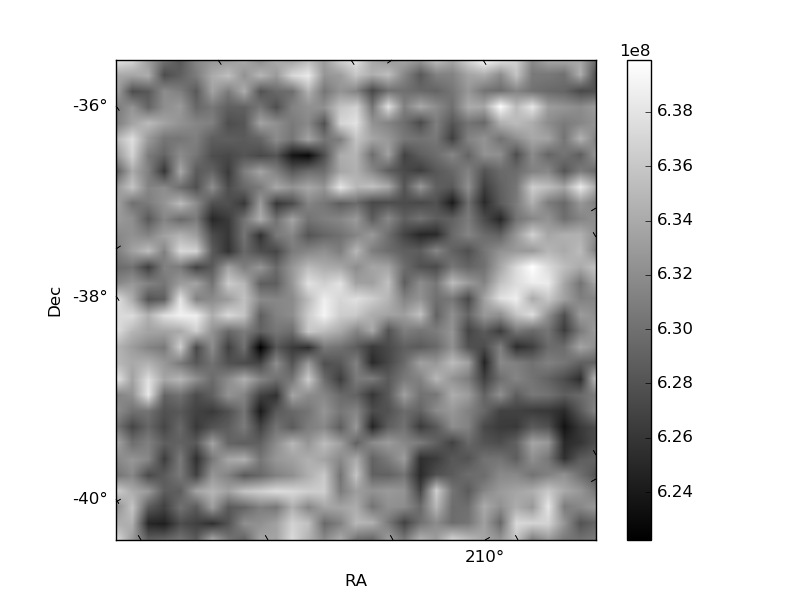
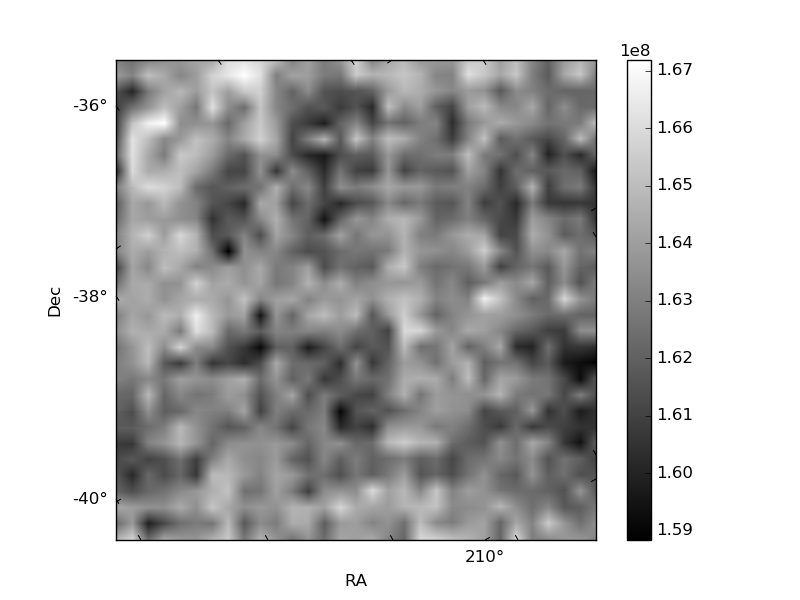
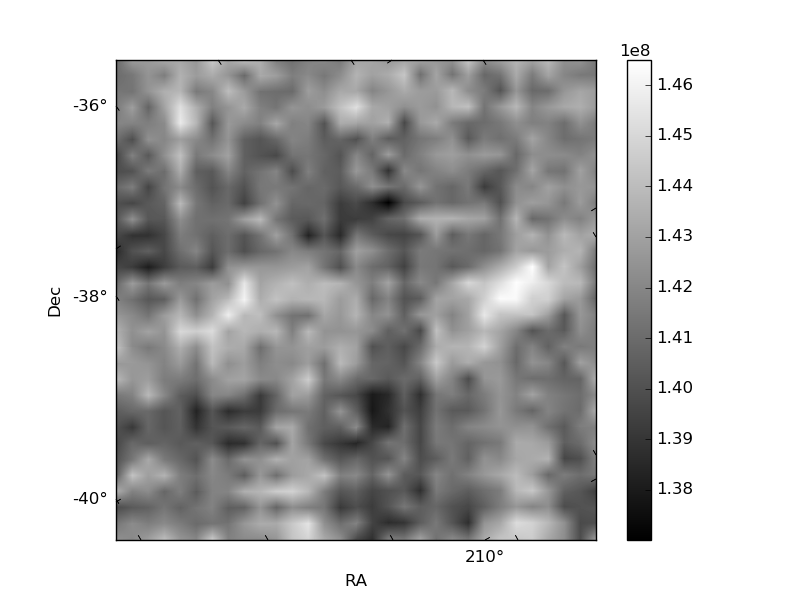
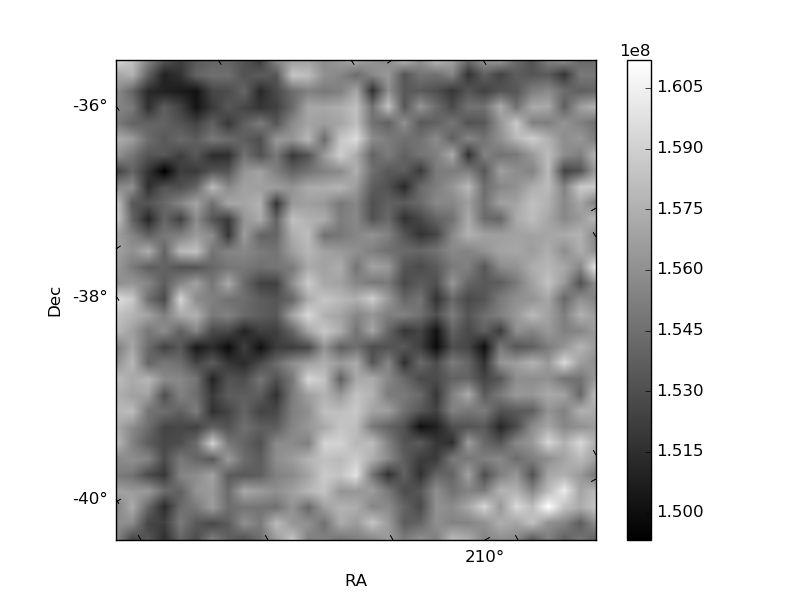
Histogram calculated using DETX and DETY for each event in the final _common_clean file
| Quadrant A | 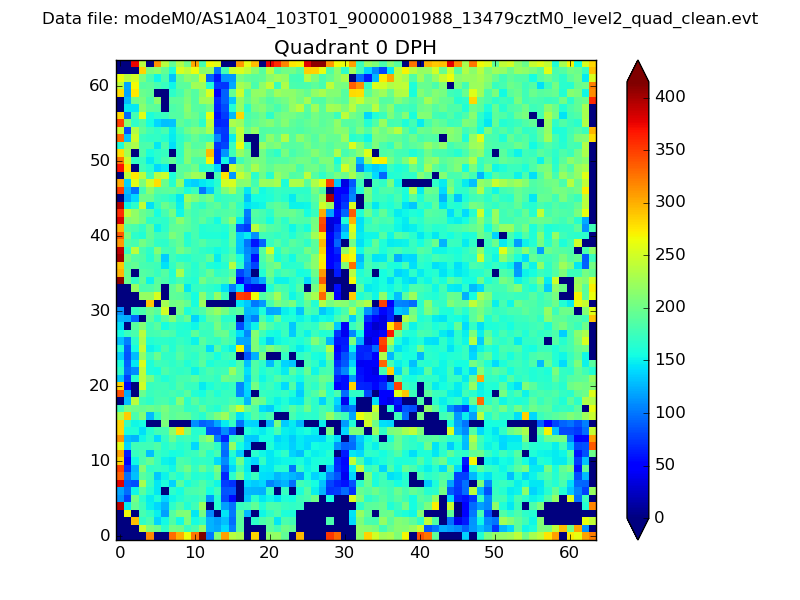 |
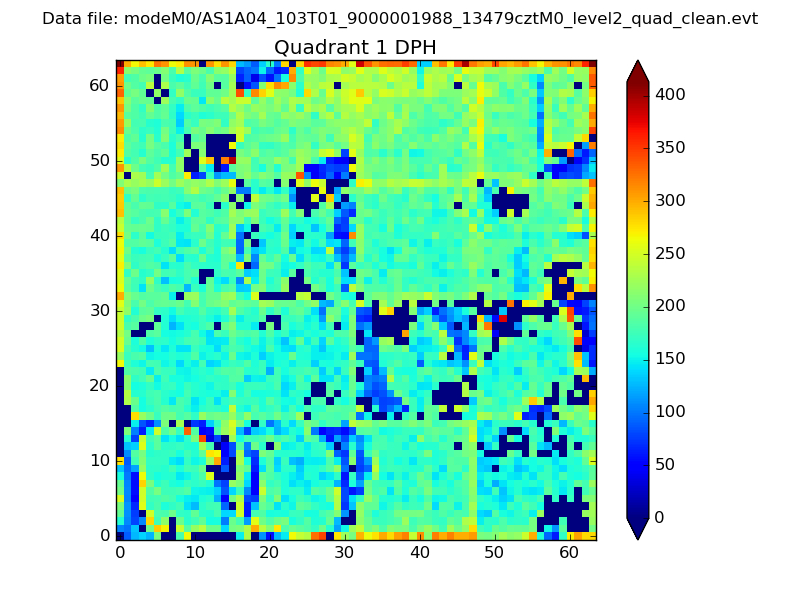 |
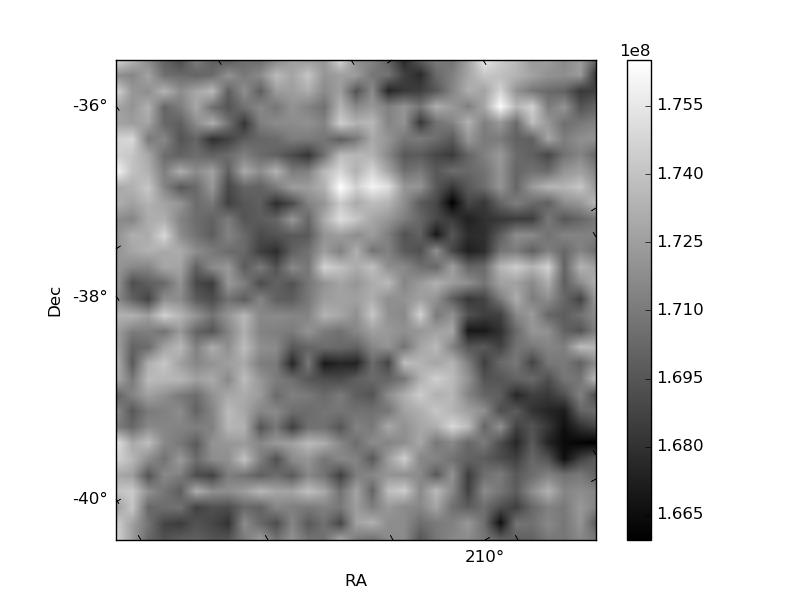
Quadrant B |
|---|---|---|---|
| Quadrant D | 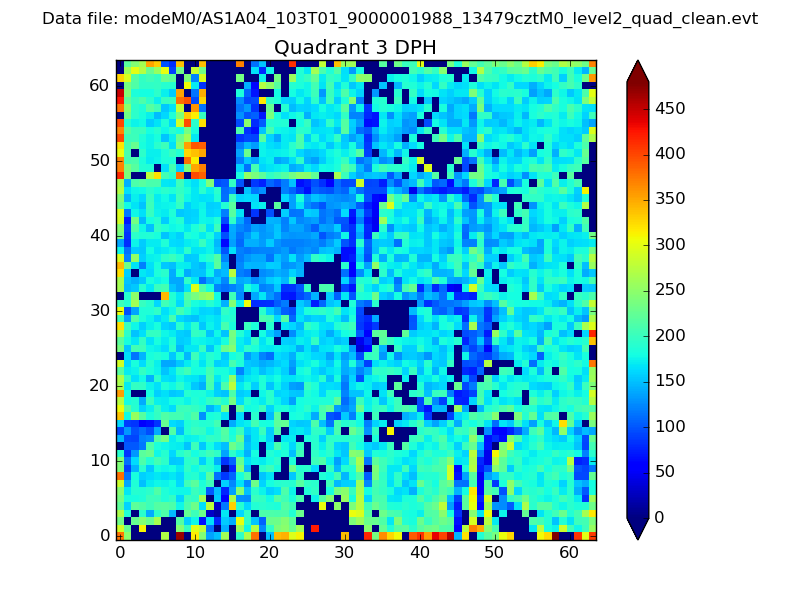 |
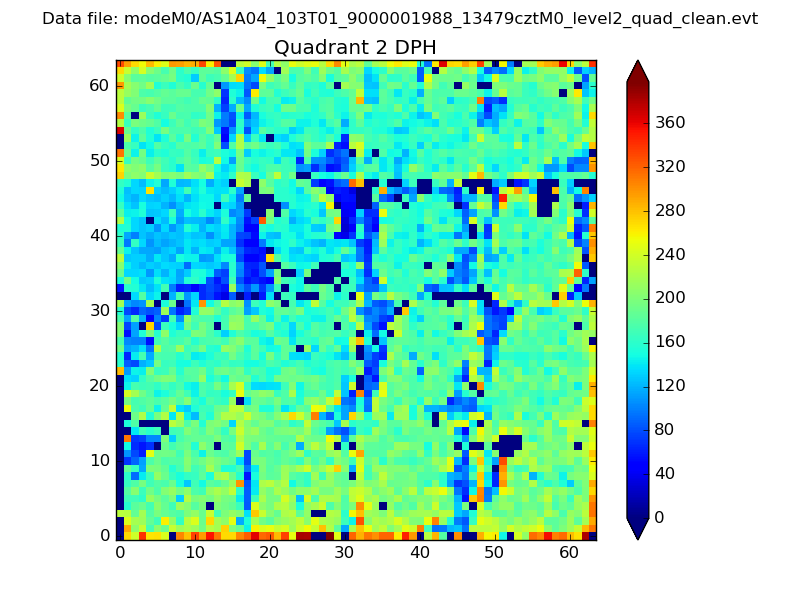 |
Quadrant C |
| Plot type | Count rate plots | Images |
|---|---|---|
| Comparison with Poisson distribution Blue bars denote a histogram of data divided into 1 sec bins. Red curve is a Poisson curve with rate = median count rate of data. |
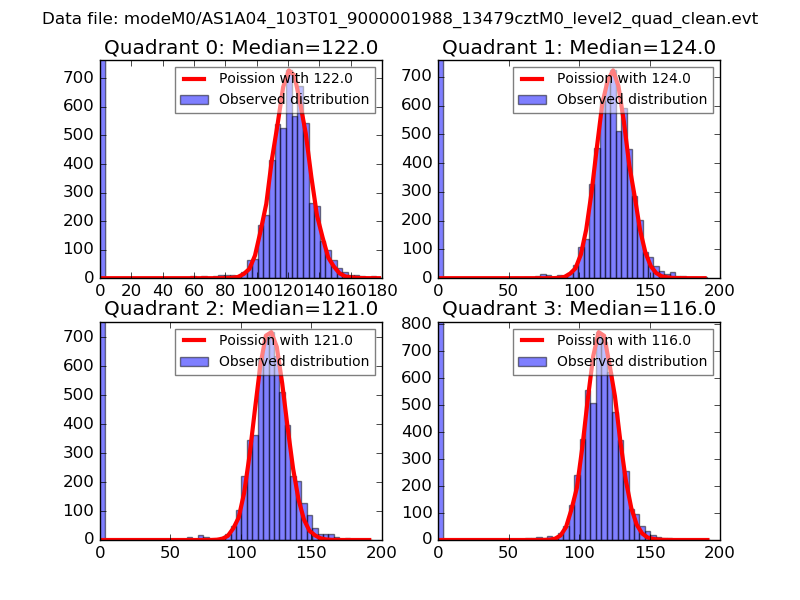 |
 |
| Quadrant-wise count rates Data is divided into 100 sec bins |
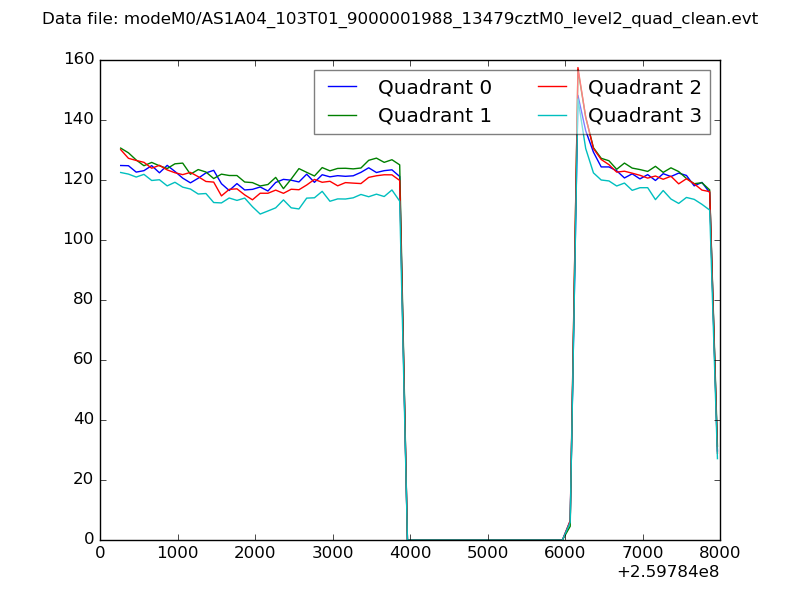 |
|
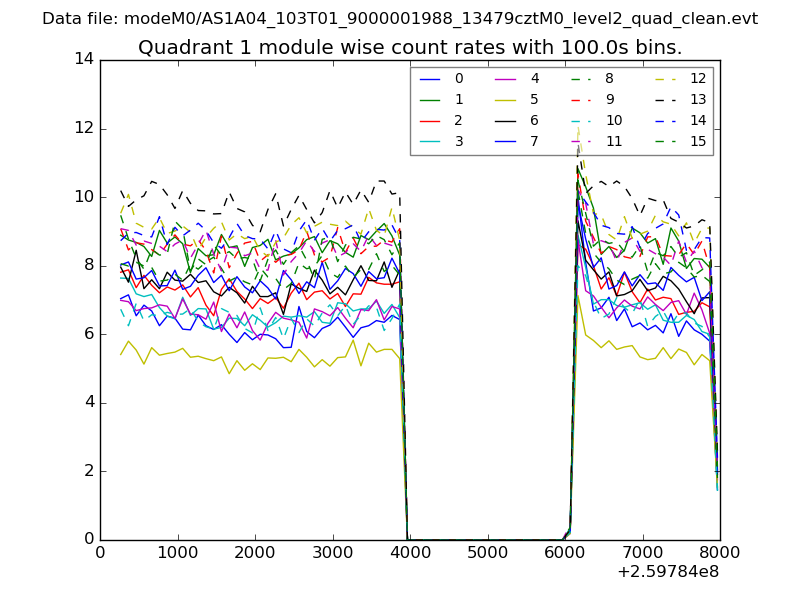
| Module-wise count rates for Quadrant A Data is divided into 100 sec bins |
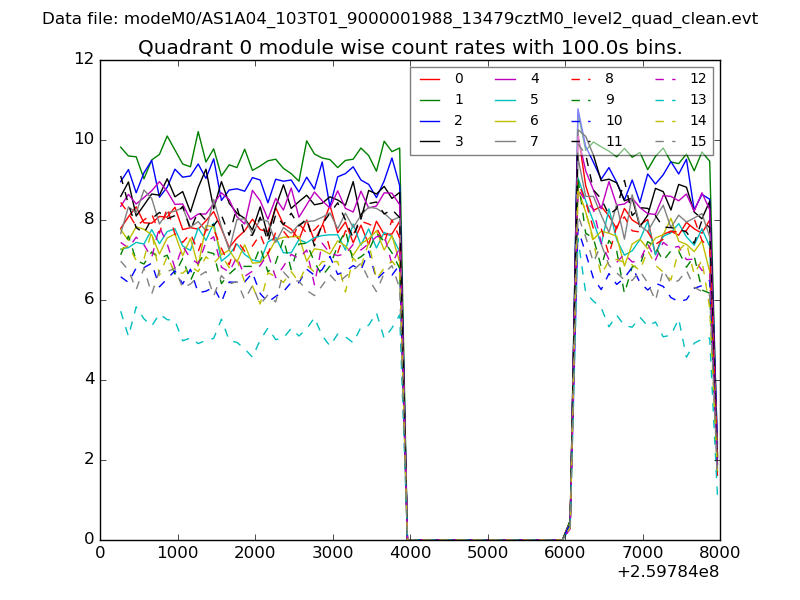 |
 |
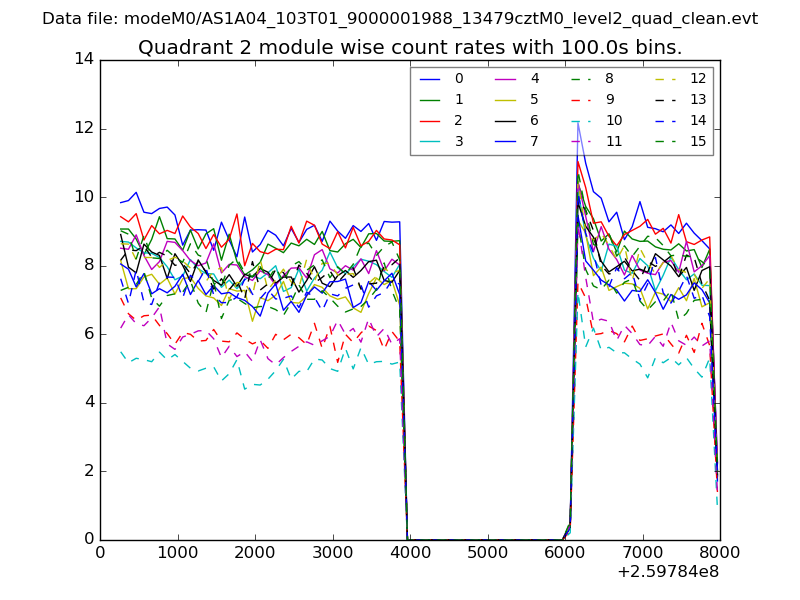
| Module-wise count rates for Quadrant B Data is divided into 100 sec bins |
 |
 |
| Module-wise count rates for Quadrant C Data is divided into 100 sec bins |
 |
 |
| Module-wise count rates for Quadrant D Data is divided into 100 sec bins |
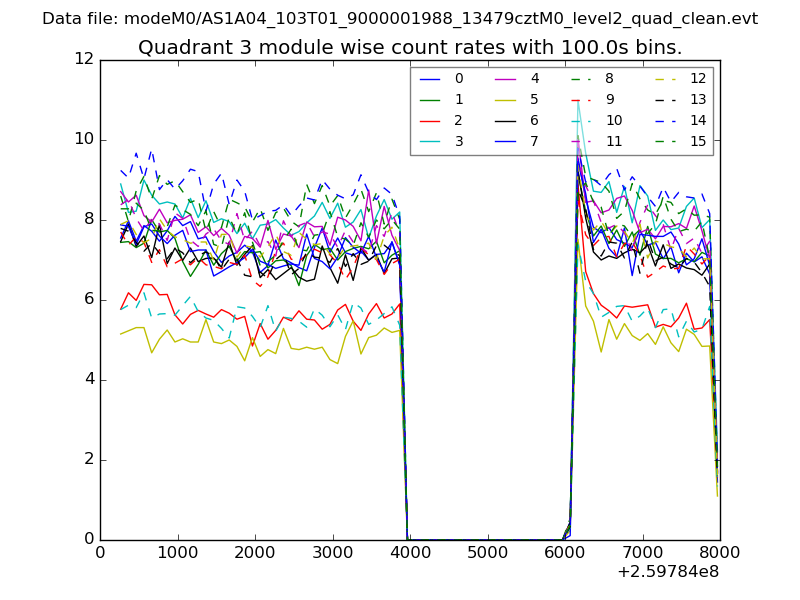 |
 |
| Parameter | Plot |
|---|---|
| CZT HV Monitor | 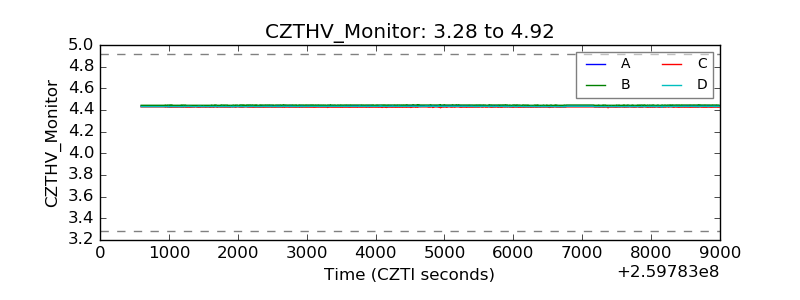 |
| D_VDD | 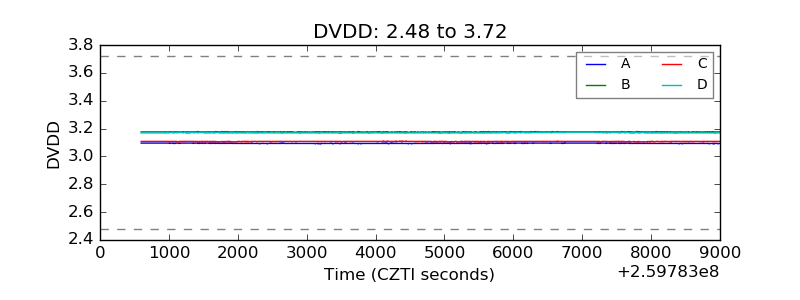 |
| Temperature 1 | 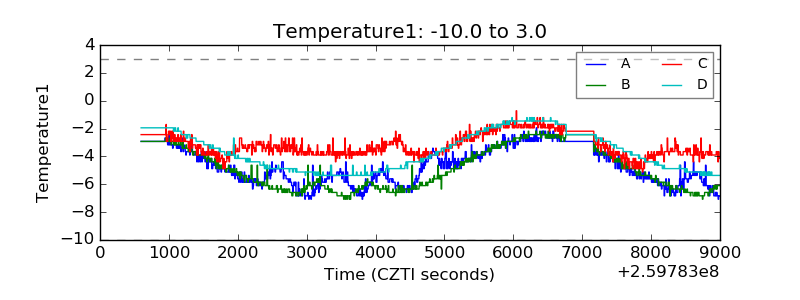 |
| Veto HV Monitor | 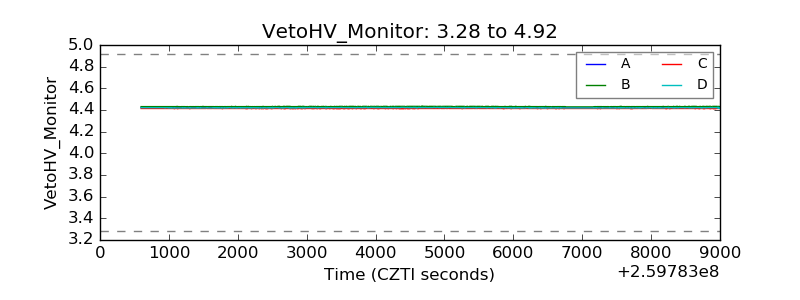 |
| Veto LLD | 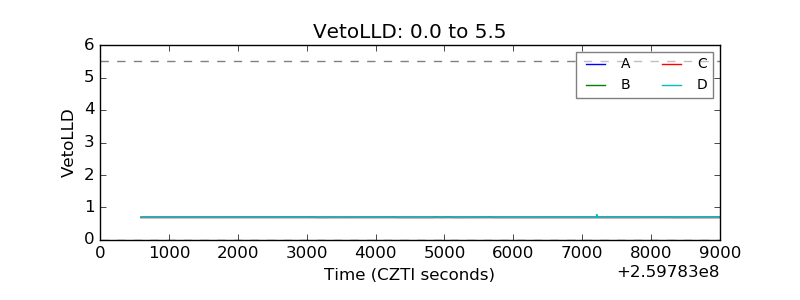 |
| Alpha Counter | 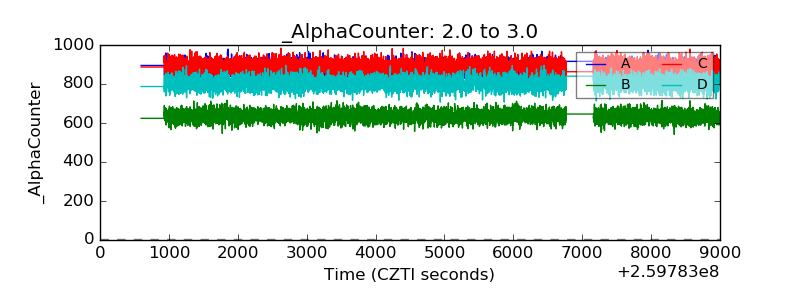 |
| _CPM_Rate | 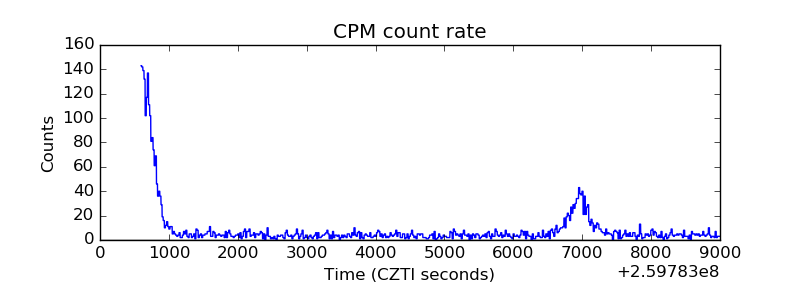 |
| CZT Counter | 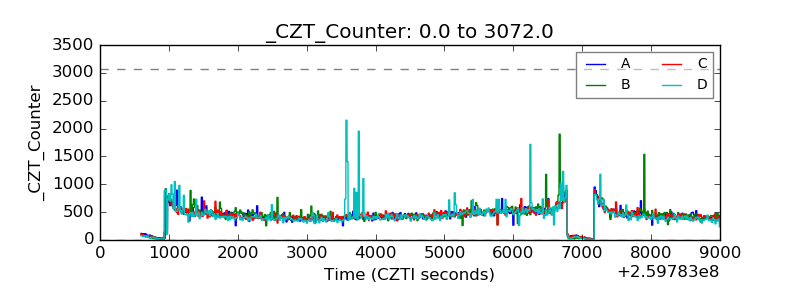 |
| +2.5 Volts monitor |  |
| +5 Volts monitor |  |
| _ROLL_ROT | 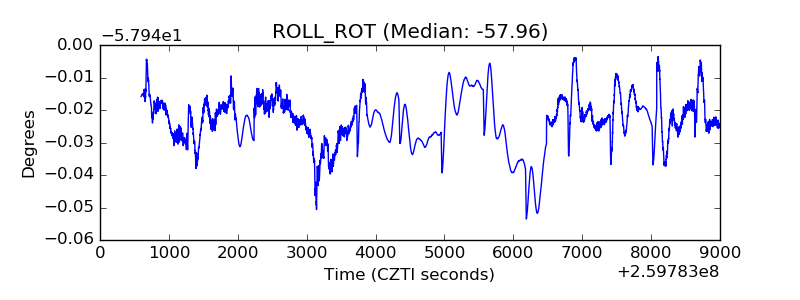 |
| _Roll_DEC | 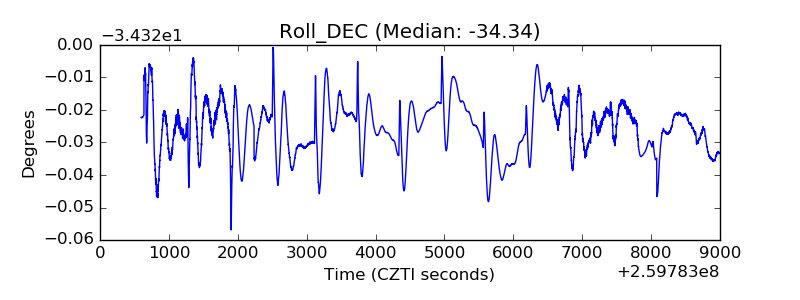 |
| _Roll_RA | 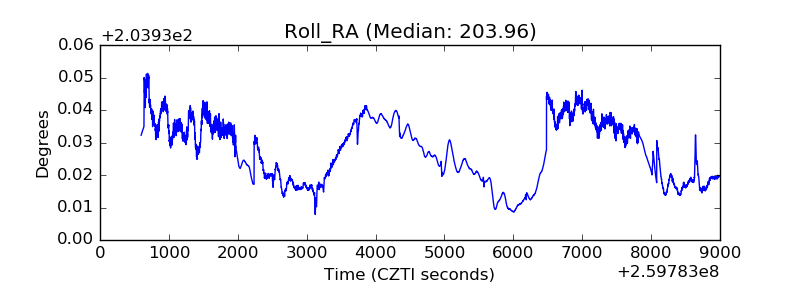 |
| Veto Counter | 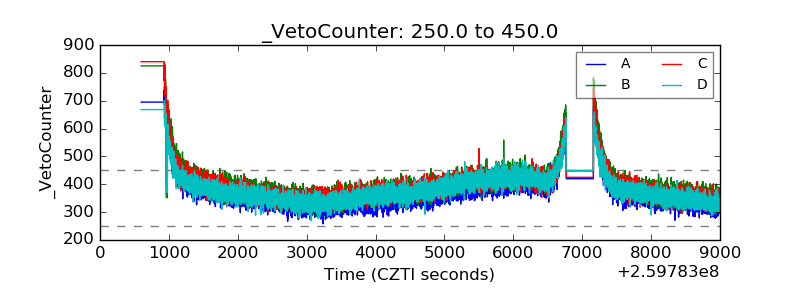 |