| Param | Original file | Final file |
|---|---|---|
| Filename | modeM0/AS1A04_103T01_9000001988_13480cztM0_level2.evt | modeM0/AS1A04_103T01_9000001988_13480cztM0_level2_quad_clean.evt |
| Size (bytes) | 519,880,320 | 109,077,120 |
| Size | 495.8 MB | 104.0 MB |
| Events in quadrant A | 3,763,158 | 690,559 |
| Events in quadrant B | 3,983,423 | 704,598 |
| Events in quadrant C | 3,774,414 | 686,979 |
| Events in quadrant D | 3,671,998 | 657,014 |
| Mode M0 | |||
|---|---|---|---|
| Quadrant | BADHDUFLAG | Total packets | Discarded packets |
| A | 0 | 16816 | 3 |
| B | 0 | 17319 | 2 |
| C | 0 | 16810 | 2 |
| D | 0 | 16966 | 2 |
| Mode SS | |||
|---|---|---|---|
| Quadrant | BADHDUFLAG | Total packets | Discarded packets |
| A | 0 | 166 | 0 |
| B | 0 | 166 | 0 |
| C | 0 | 166 | 0 |
| D | 0 | 166 | 0 |
| Mode M9 | |||
|---|---|---|---|
| Quadrant | BADHDUFLAG | Total packets | Discarded packets |
| A | 0 | 7 | 0 |
| B | 0 | 7 | 0 |
| C | 0 | 7 | 0 |
| D | 0 | 7 | 0 |
| Quadrant | Total seconds | Saturated seconds | Saturation percentage |
|---|---|---|---|
| A | 8121 | 53 | 0.652629% |
| B | 8121 | 130 | 1.600788% |
| C | 8121 | 30 | 0.369413% |
| D | 8121 | 32 | 0.394040% |
Noise dominated data is calculated using 1-second bins in cleaned event files. If a bin has >2000 counts, and if more than 50% of those come from <1% of pixels, then it is considered to be noise-dominated and hence unusable.
| Quadrant | # 1 sec bins | Bins with >0 counts | Bins with >2000 counts | High rate bins dominated by noise | Noise dominated (total time) | Noise dominated (detector-on time) | Marked lightcurve |
|---|---|---|---|---|---|---|---|
| A | 8822 | 8124 | 0 | 0 | 0.00% | 0.00% | 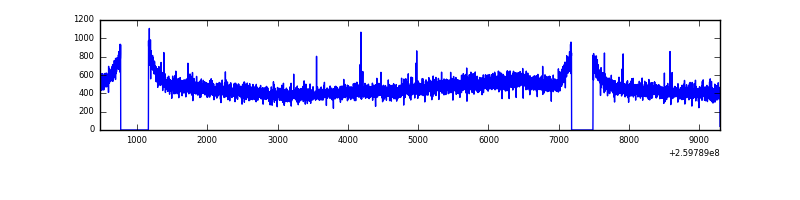 |
| B | 8822 | 8123 | 13 | 13 | 0.15% | 0.16% | 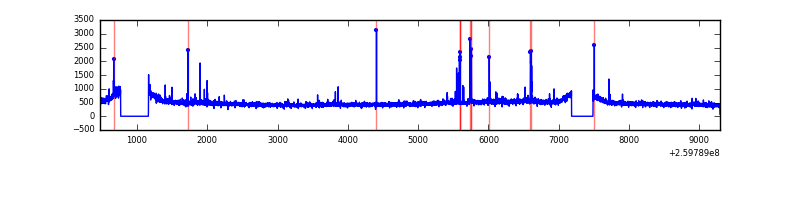 |
| C | 8822 | 8124 | 0 | 0 | 0.00% | 0.00% | 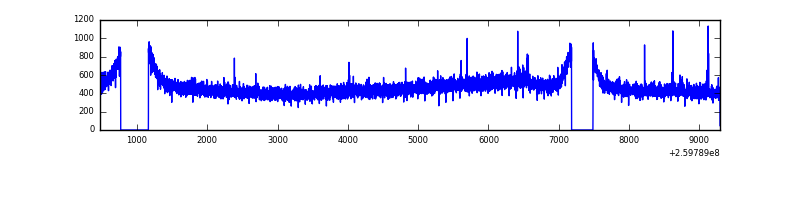 |
| D | 8822 | 8124 | 10 | 10 | 0.11% | 0.12% | 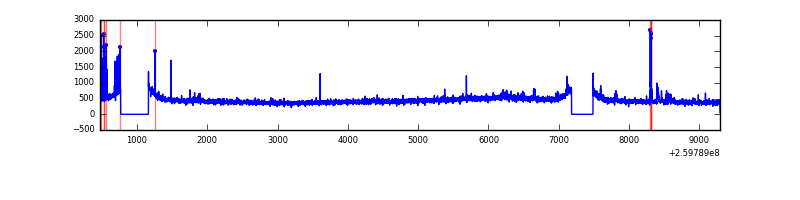 |
Top three noisy pixels from each quadrant. If the there are fewer than three noisy pixels in the level2.evt file, extra rows are filled as -1
| Pixel properties | Quadrant properties | ||||||
|---|---|---|---|---|---|---|---|
| Quadrant | DetID | PixID | Counts | Sigma | Mean | Median | Sigma |
| A | 1 | 162 | 16582 | 78.59 | 972 | 949 | 198.9 |
| A | 0 | 226 | 8914 | 40.04 | 972 | 949 | 198.9 |
| A | 12 | 194 | 7247 | 31.66 | 972 | 949 | 198.9 |
| B | 3 | 64 | 61975 | 326.06 | 975 | 952 | 187.1 |
| B | 4 | 142 | 47374 | 248.05 | 975 | 952 | 187.1 |
| B | 0 | 214 | 25303 | 130.11 | 975 | 952 | 187.1 |
| C | 3 | 233 | 73748 | 331.6 | 943 | 947 | 219.5 |
| C | 14 | 220 | 10394 | 43.03 | 943 | 947 | 219.5 |
| C | 13 | 61 | 6891 | 27.07 | 943 | 947 | 219.5 |
| D | 12 | 110 | 36348 | 157.07 | 933 | 904 | 225.7 |
| D | 13 | 122 | 34697 | 149.75 | 933 | 904 | 225.7 |
| D | 2 | 234 | 29956 | 128.74 | 933 | 904 | 225.7 |
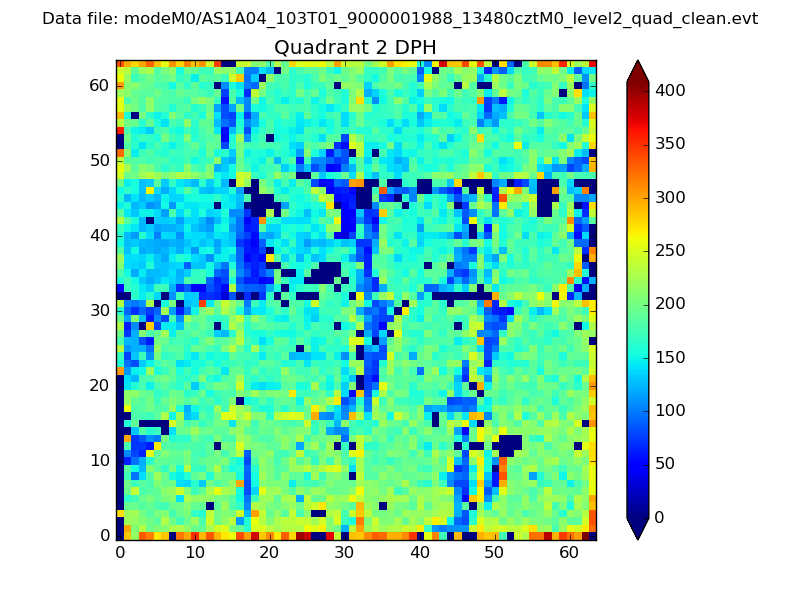
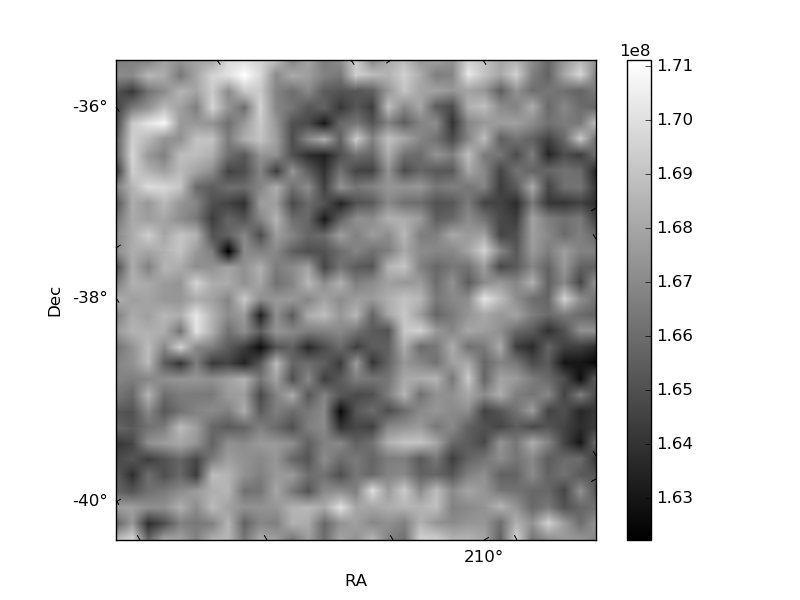
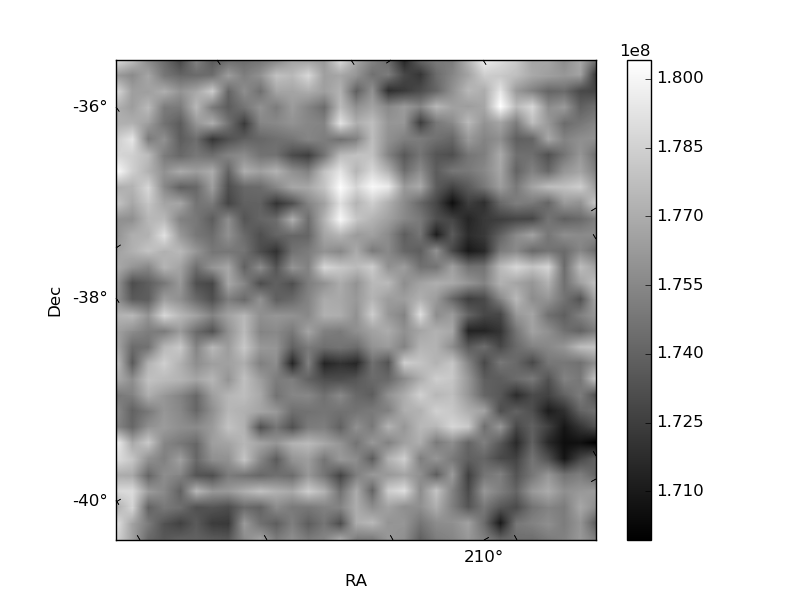
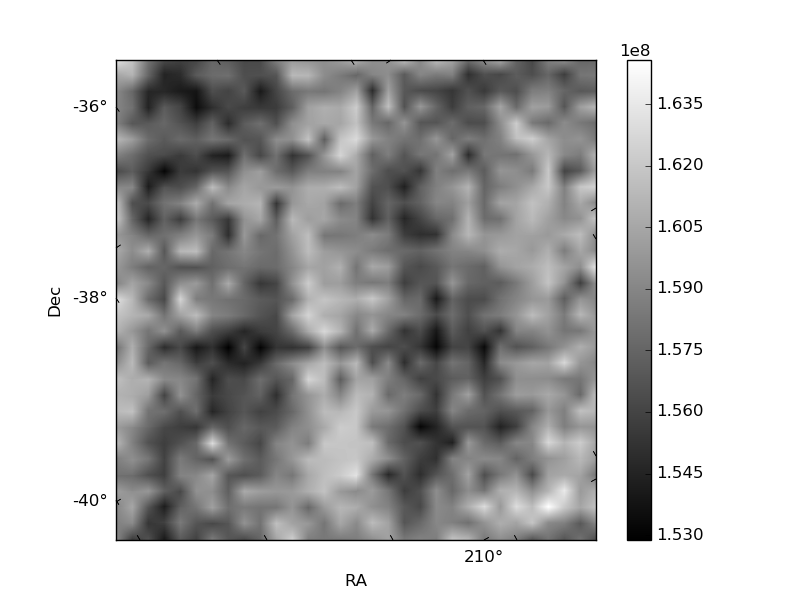
Histogram calculated using DETX and DETY for each event in the final _common_clean file
| Quadrant A | 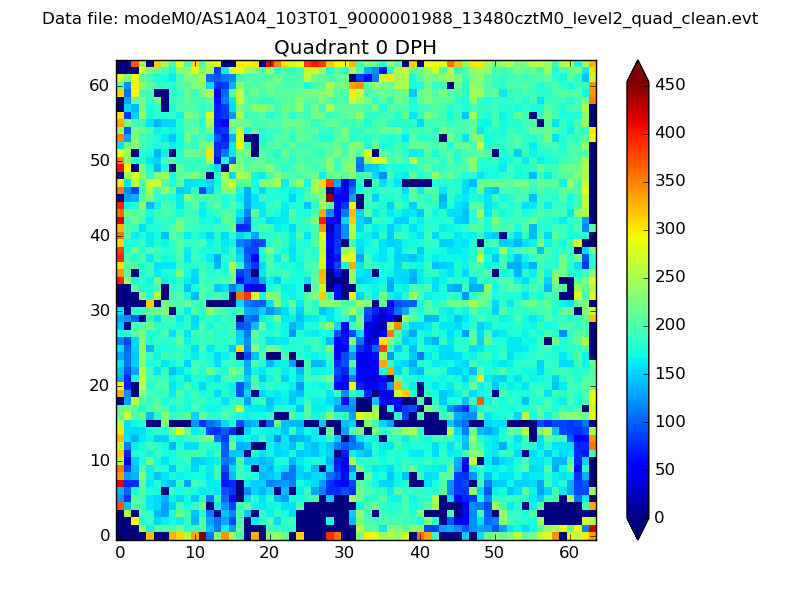 |
 |
Quadrant B |
|---|---|---|---|
| Quadrant D |  |
 |
Quadrant C |
| Plot type | Count rate plots | Images |
|---|---|---|
| Comparison with Poisson distribution Blue bars denote a histogram of data divided into 1 sec bins. Red curve is a Poisson curve with rate = median count rate of data. |
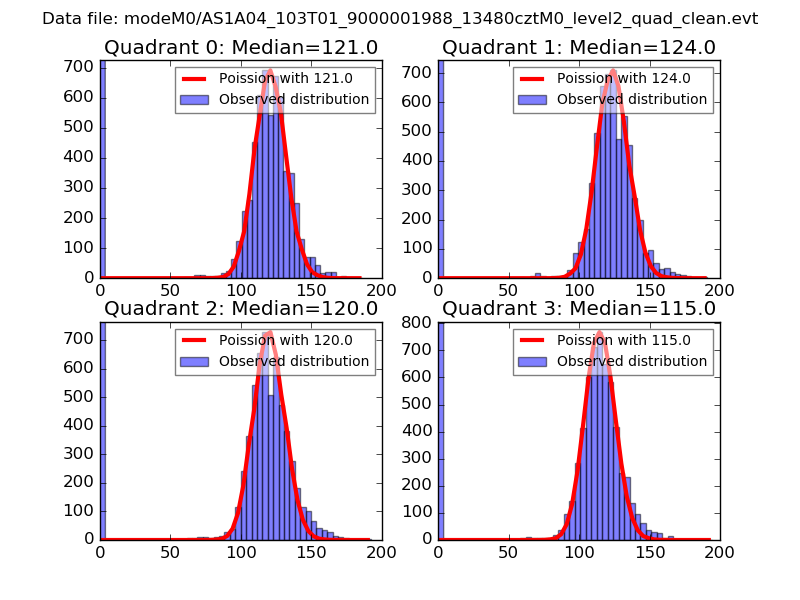 |
 |
| Quadrant-wise count rates Data is divided into 100 sec bins |
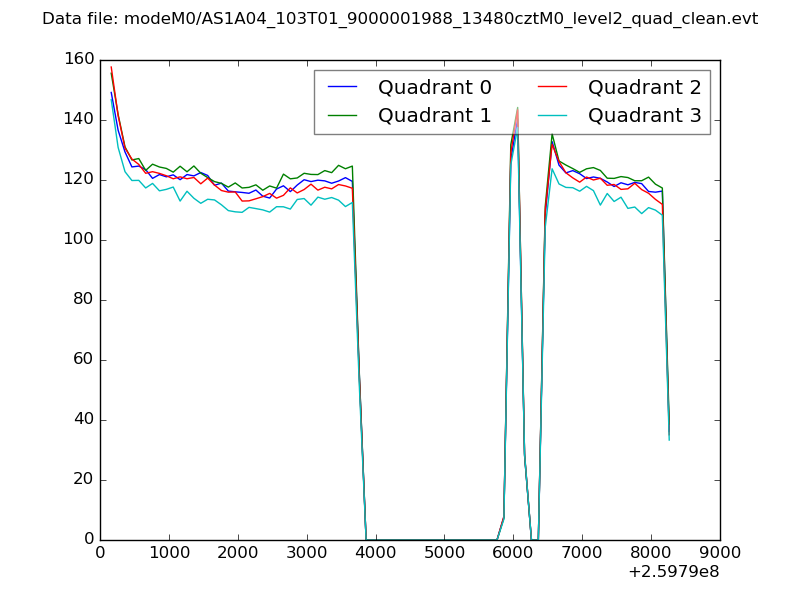 |
|
| Module-wise count rates for Quadrant A Data is divided into 100 sec bins |
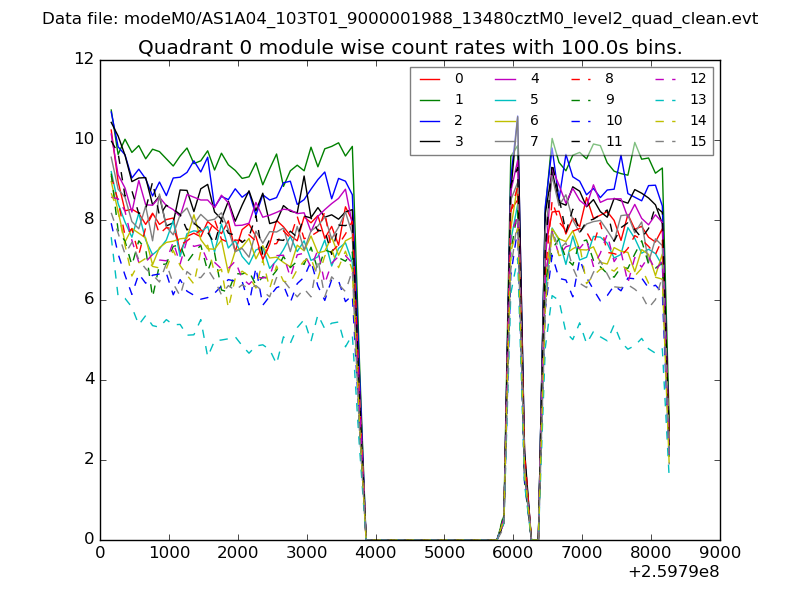 |
 |
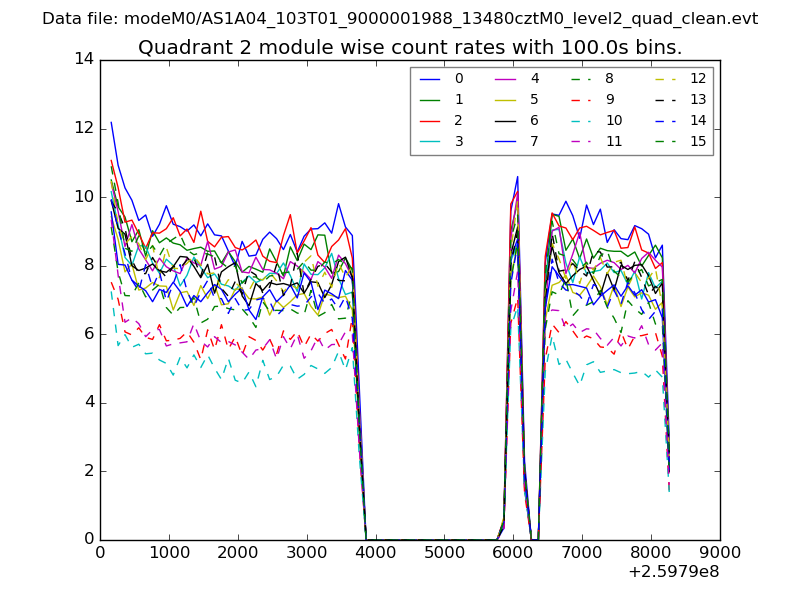
| Module-wise count rates for Quadrant B Data is divided into 100 sec bins |
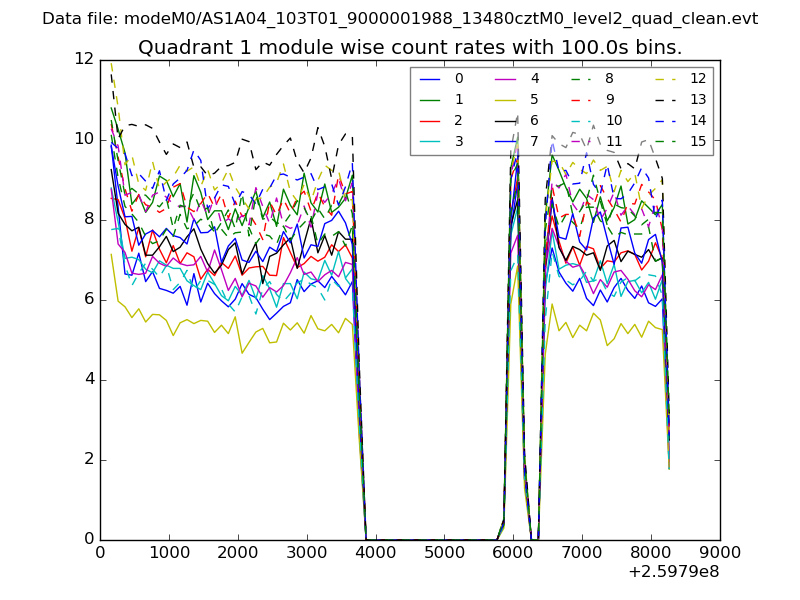 |
 |
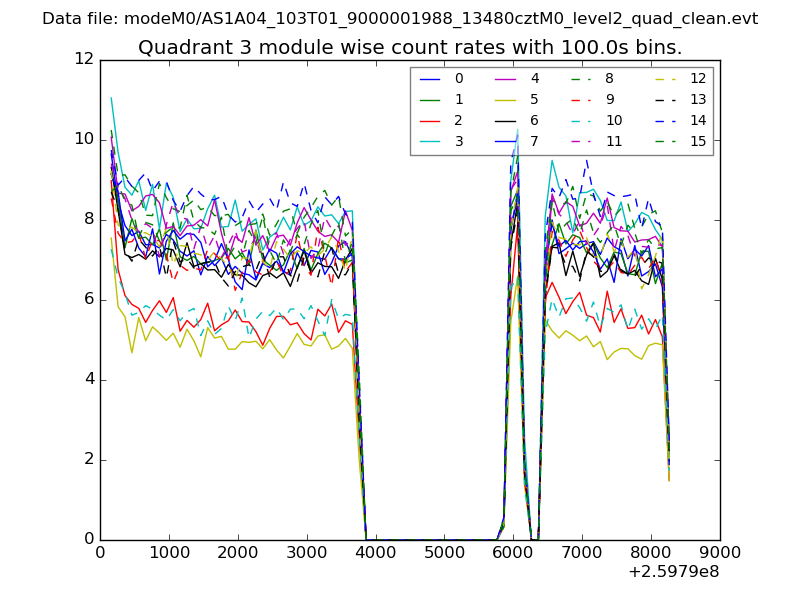
| Module-wise count rates for Quadrant C Data is divided into 100 sec bins |
 |
 |
| Module-wise count rates for Quadrant D Data is divided into 100 sec bins |
 |
 |
| Parameter | Plot |
|---|---|
| CZT HV Monitor | 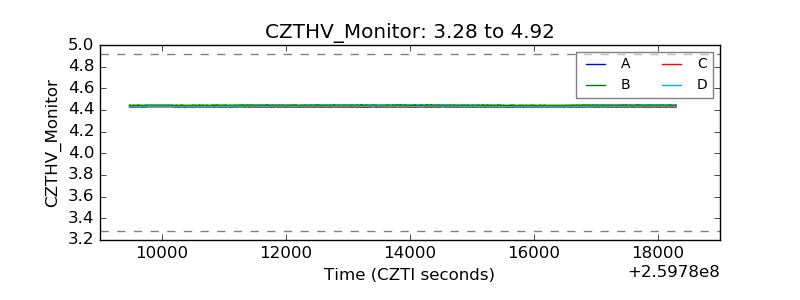 |
| D_VDD | 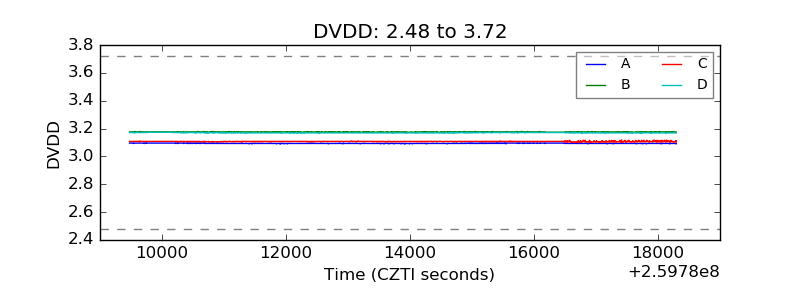 |
| Temperature 1 | 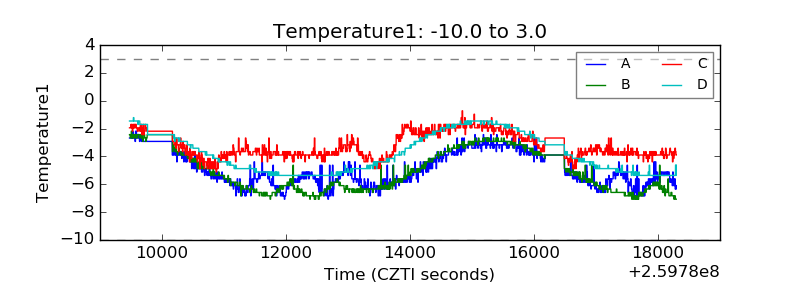 |
| Veto HV Monitor | 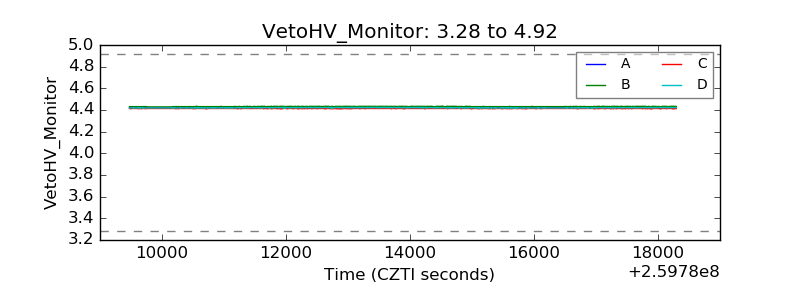 |
| Veto LLD | 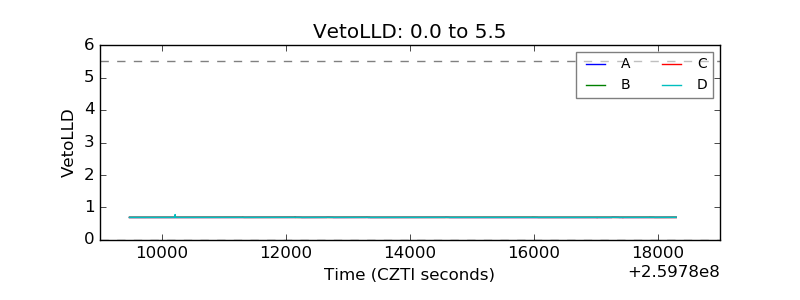 |
| Alpha Counter | 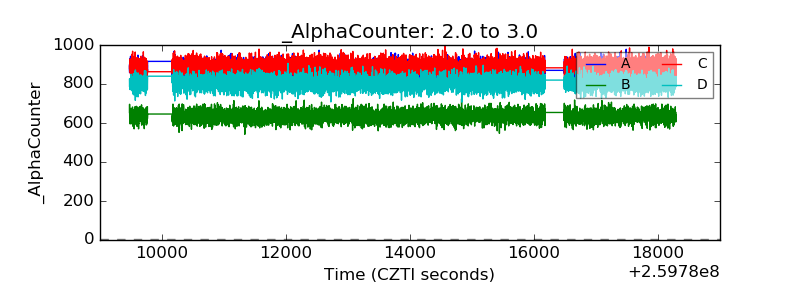 |
| _CPM_Rate | 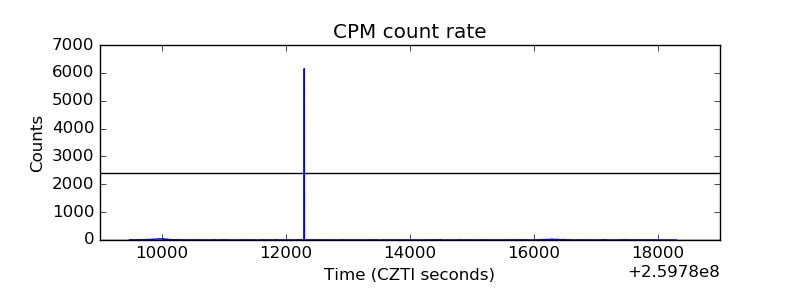 |
| CZT Counter | 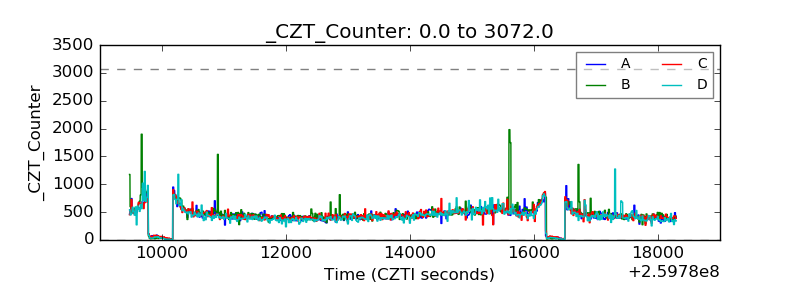 |
| +2.5 Volts monitor |  |
| +5 Volts monitor |  |
| _ROLL_ROT | 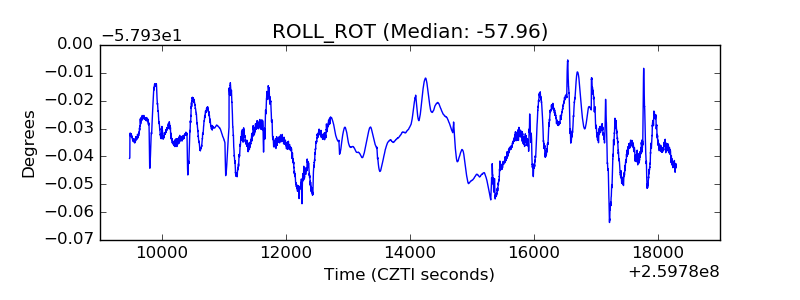 |
| _Roll_DEC | 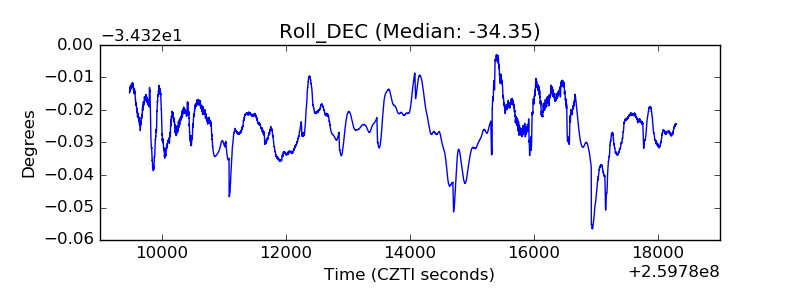 |
| _Roll_RA | 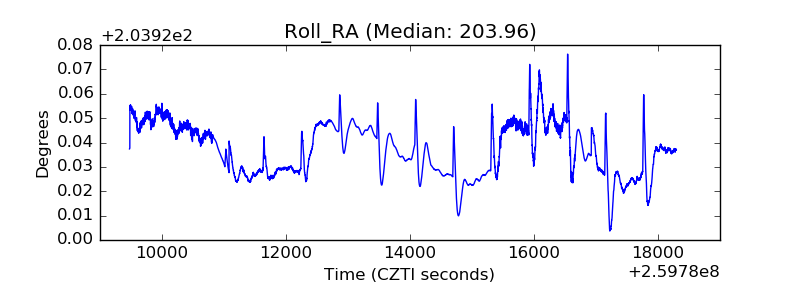 |
| Veto Counter | 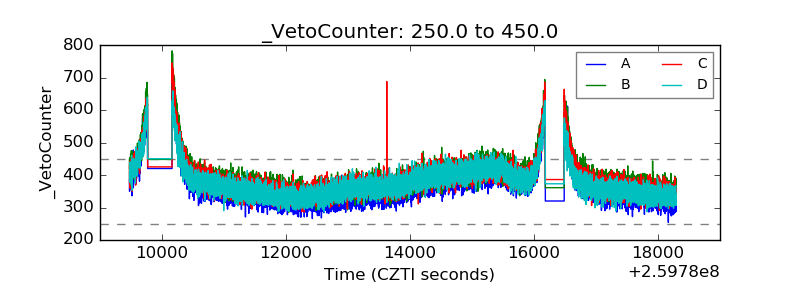 |