| Param | Original file | Final file |
|---|---|---|
| Filename | modeM0/AS1A04_103T01_9000001988_13481cztM0_level2.evt | modeM0/AS1A04_103T01_9000001988_13481cztM0_level2_quad_clean.evt |
| Size (bytes) | 571,898,880 | 107,199,360 |
| Size | 545.4 MB | 102.2 MB |
| Events in quadrant A | 3,826,498 | 676,875 |
| Events in quadrant B | 4,138,547 | 690,968 |
| Events in quadrant C | 3,865,039 | 674,285 |
| Events in quadrant D | 4,927,260 | 628,285 |
| Mode M0 | |||
|---|---|---|---|
| Quadrant | BADHDUFLAG | Total packets | Discarded packets |
| A | 0 | 17041 | 3 |
| B | 0 | 17817 | 2 |
| C | 0 | 17043 | 2 |
| D | 0 | 20777 | 2 |
| Mode SS | |||
|---|---|---|---|
| Quadrant | BADHDUFLAG | Total packets | Discarded packets |
| A | 0 | 172 | 0 |
| B | 0 | 172 | 0 |
| C | 0 | 172 | 0 |
| D | 0 | 172 | 0 |
| Mode M9 | |||
|---|---|---|---|
| Quadrant | BADHDUFLAG | Total packets | Discarded packets |
| A | 0 | 6 | 0 |
| B | 0 | 6 | 0 |
| C | 0 | 6 | 0 |
| D | 0 | 6 | 0 |
| Quadrant | Total seconds | Saturated seconds | Saturation percentage |
|---|---|---|---|
| A | 8281 | 31 | 0.374351% |
| B | 8281 | 103 | 1.243811% |
| C | 8281 | 26 | 0.313972% |
| D | 8281 | 418 | 5.047700% |
Noise dominated data is calculated using 1-second bins in cleaned event files. If a bin has >2000 counts, and if more than 50% of those come from <1% of pixels, then it is considered to be noise-dominated and hence unusable.
| Quadrant | # 1 sec bins | Bins with >0 counts | Bins with >2000 counts | High rate bins dominated by noise | Noise dominated (total time) | Noise dominated (detector-on time) | Marked lightcurve |
|---|---|---|---|---|---|---|---|
| A | 8972 | 8284 | 1 | 1 | 0.01% | 0.01% | 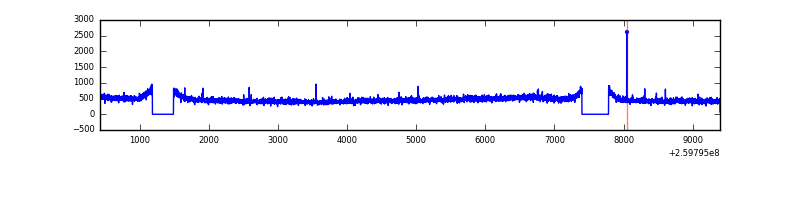 |
| B | 8972 | 8284 | 23 | 23 | 0.26% | 0.28% | 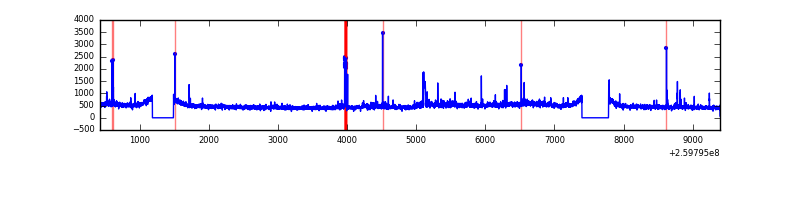 |
| C | 8972 | 8284 | 1 | 1 | 0.01% | 0.01% | 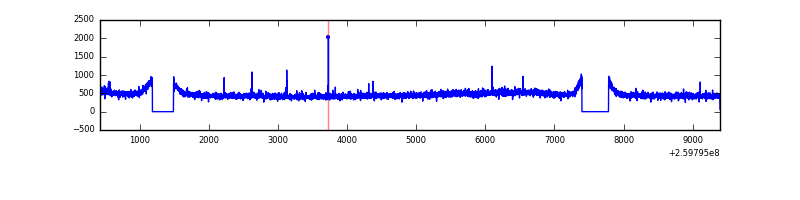 |
| D | 8972 | 8283 | 301 | 301 | 3.35% | 3.63% | 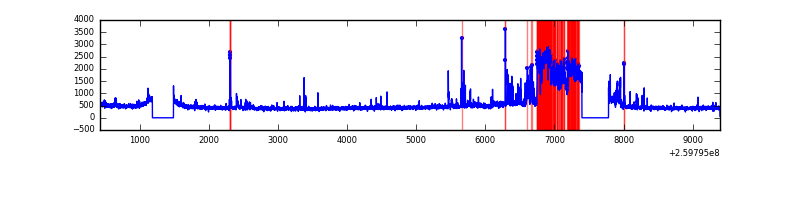 |
Top three noisy pixels from each quadrant. If the there are fewer than three noisy pixels in the level2.evt file, extra rows are filled as -1
| Pixel properties | Quadrant properties | ||||||
|---|---|---|---|---|---|---|---|
| Quadrant | DetID | PixID | Counts | Sigma | Mean | Median | Sigma |
| A | 1 | 162 | 15292 | 71.36 | 986 | 966 | 200.7 |
| A | 0 | 226 | 8840 | 39.22 | 986 | 966 | 200.7 |
| A | 12 | 194 | 7340 | 31.75 | 986 | 966 | 200.7 |
| B | 3 | 64 | 111997 | 581.39 | 989 | 963 | 191.0 |
| B | 0 | 214 | 70339 | 363.26 | 989 | 963 | 191.0 |
| B | 0 | 230 | 38617 | 197.16 | 989 | 963 | 191.0 |
| C | 3 | 233 | 91527 | 402.8 | 961 | 966 | 224.8 |
| C | 14 | 220 | 10325 | 41.63 | 961 | 966 | 224.8 |
| C | 0 | 207 | 7694 | 29.93 | 961 | 966 | 224.8 |
| D | 13 | 122 | 1140235 | 5040.98 | 933 | 908 | 226.0 |
| D | 13 | 104 | 82348 | 360.33 | 933 | 908 | 226.0 |
| D | 13 | 249 | 68683 | 299.87 | 933 | 908 | 226.0 |
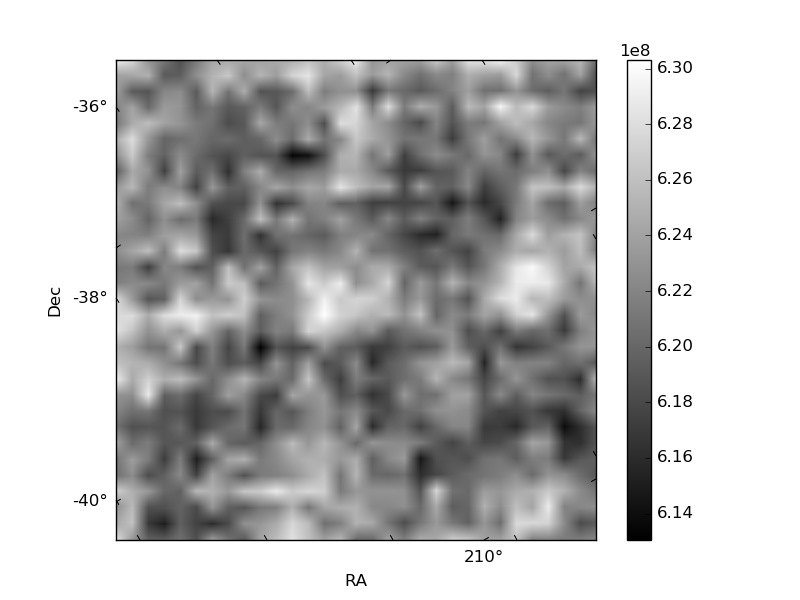
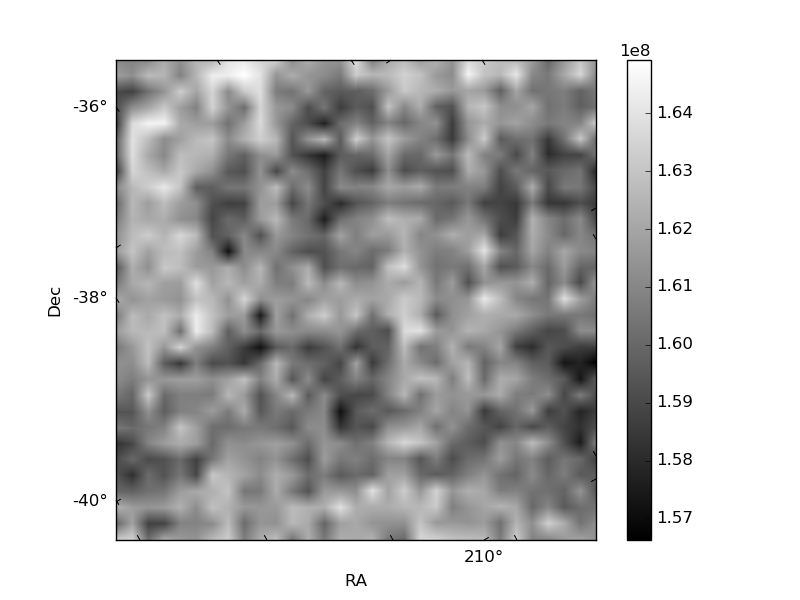
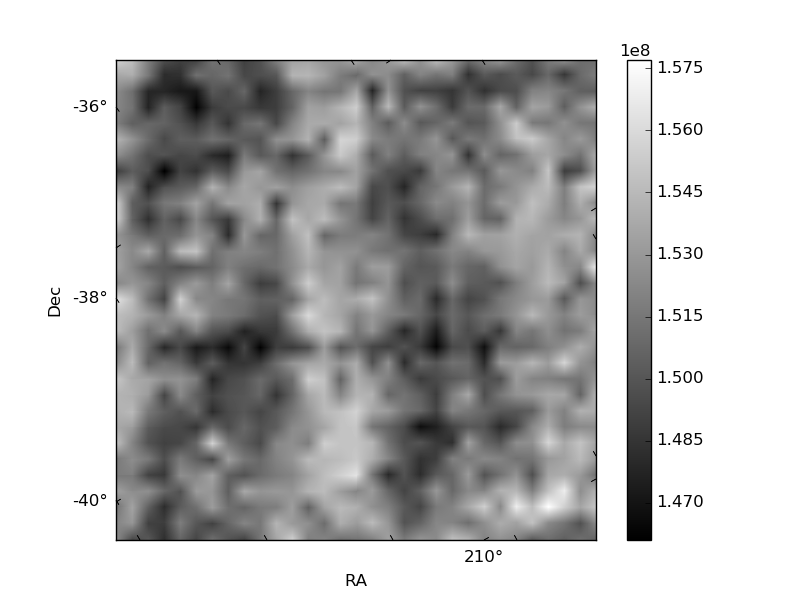
Histogram calculated using DETX and DETY for each event in the final _common_clean file
| Quadrant A | 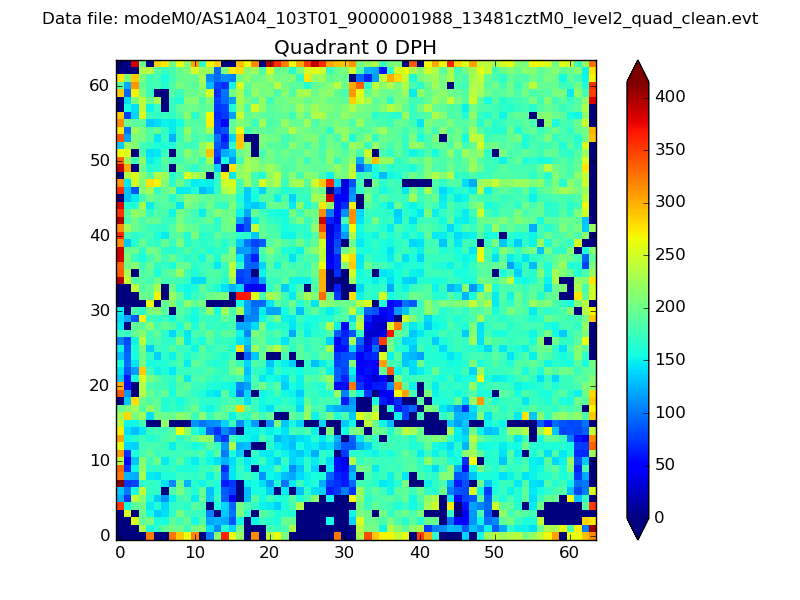 |
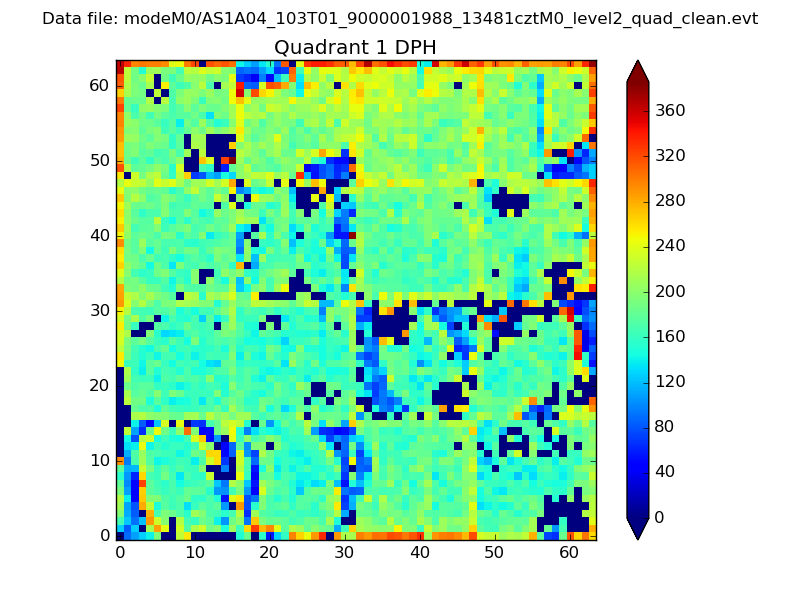 |
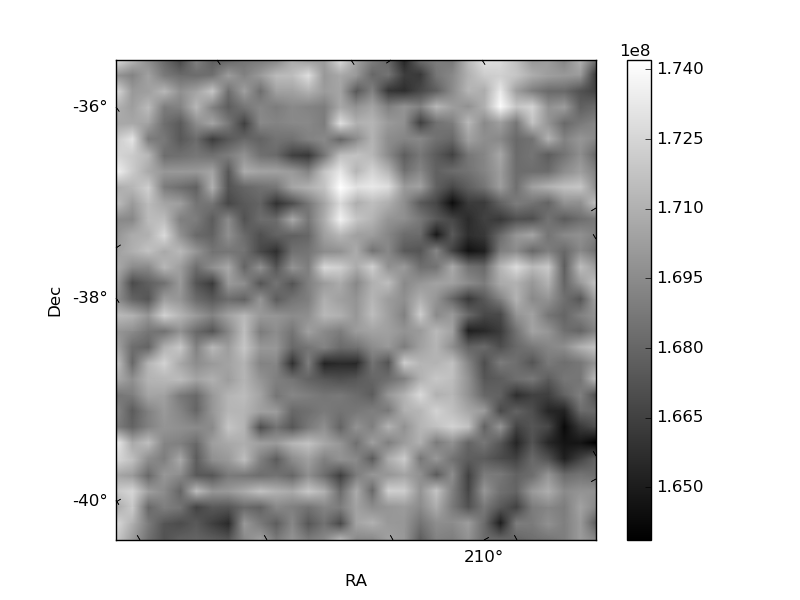
Quadrant B |
|---|---|---|---|
| Quadrant D | 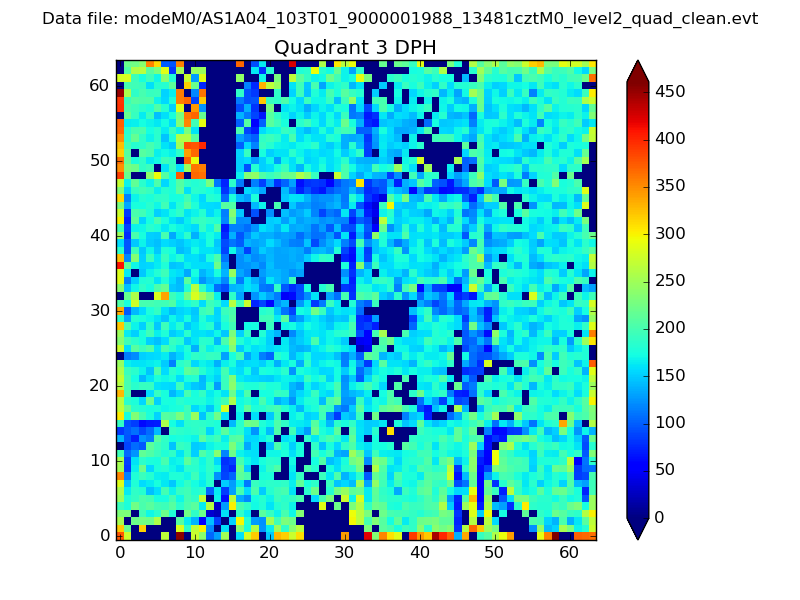 |
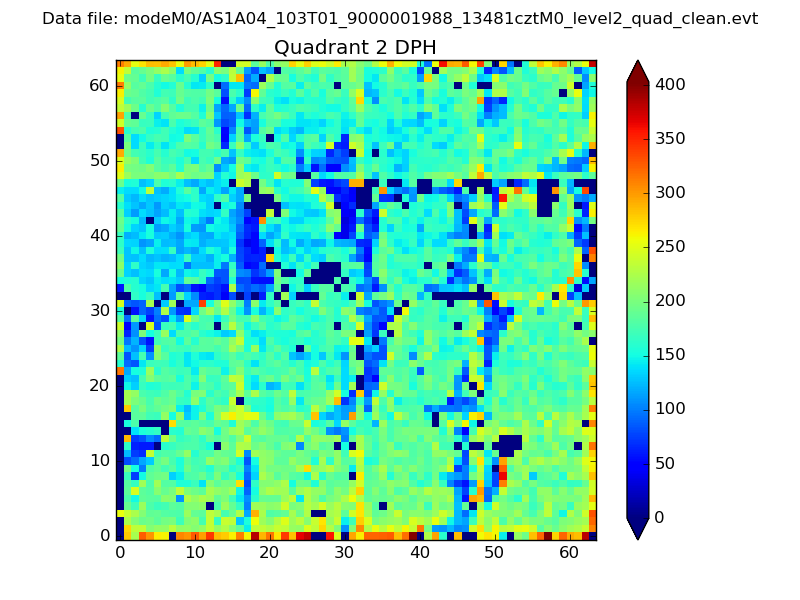 |
Quadrant C |
| Plot type | Count rate plots | Images |
|---|---|---|
| Comparison with Poisson distribution Blue bars denote a histogram of data divided into 1 sec bins. Red curve is a Poisson curve with rate = median count rate of data. |
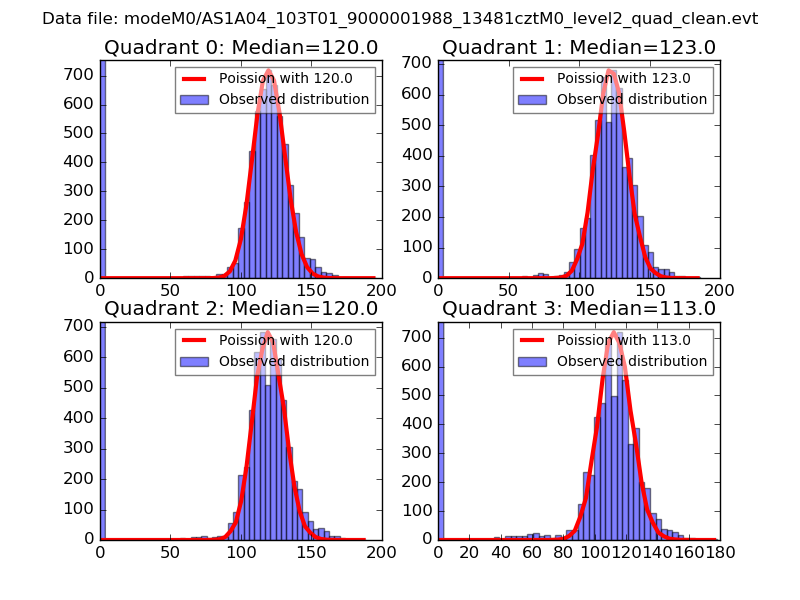 |
 |
| Quadrant-wise count rates Data is divided into 100 sec bins |
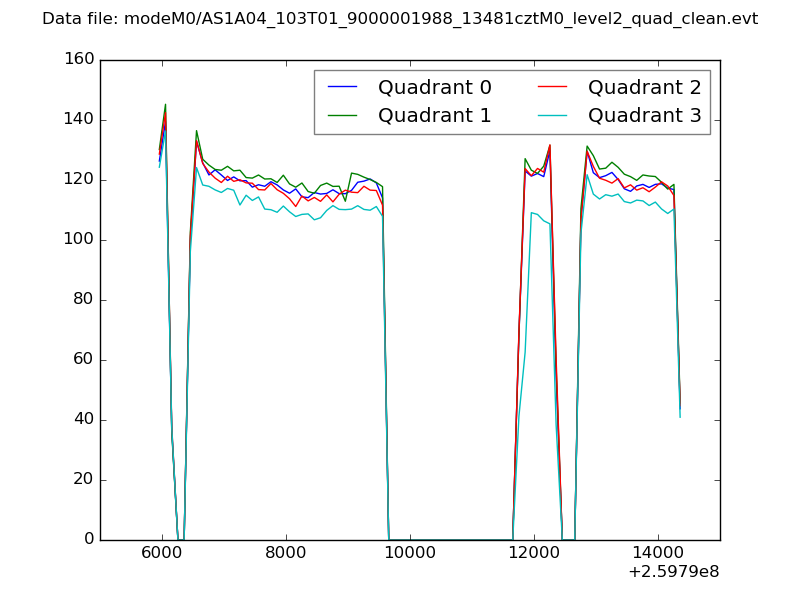 |
|
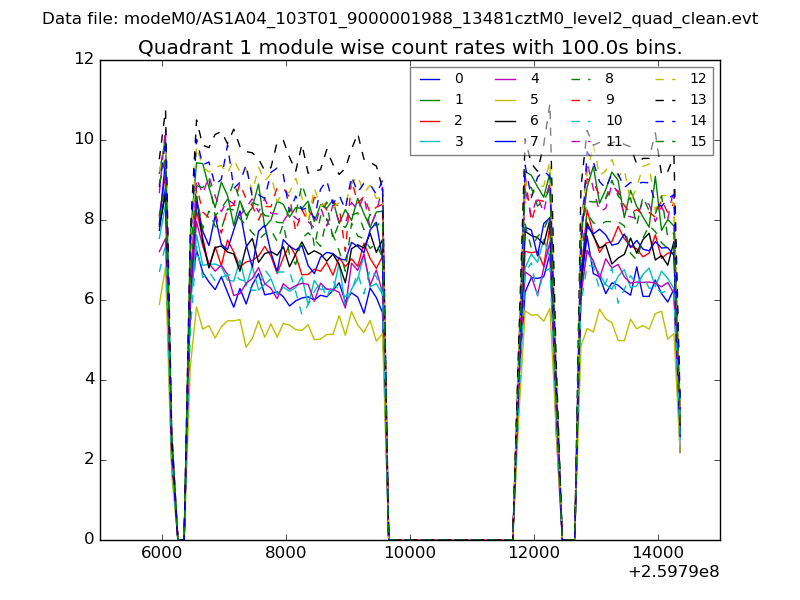
| Module-wise count rates for Quadrant A Data is divided into 100 sec bins |
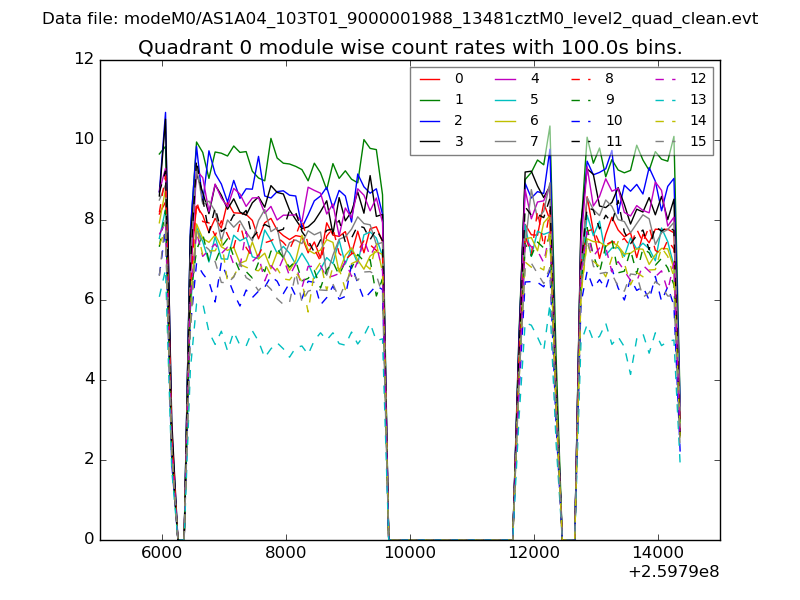 |
 |
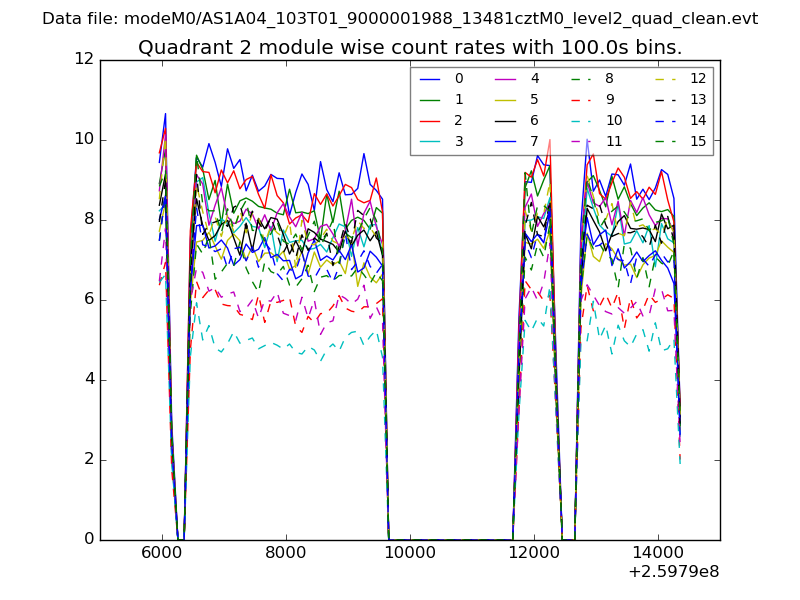
| Module-wise count rates for Quadrant B Data is divided into 100 sec bins |
 |
 |
| Module-wise count rates for Quadrant C Data is divided into 100 sec bins |
 |
 |
| Module-wise count rates for Quadrant D Data is divided into 100 sec bins |
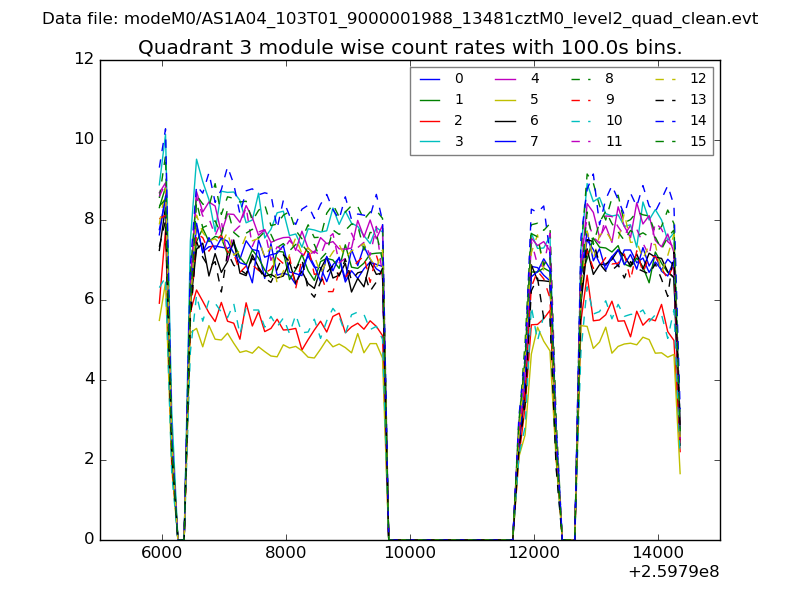 |
 |
| Parameter | Plot |
|---|---|
| CZT HV Monitor | 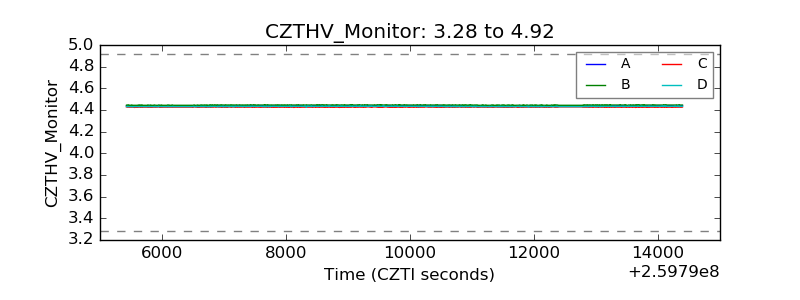 |
| D_VDD | 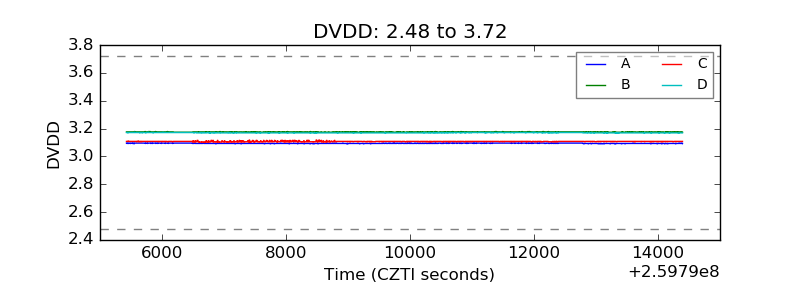 |
| Temperature 1 | 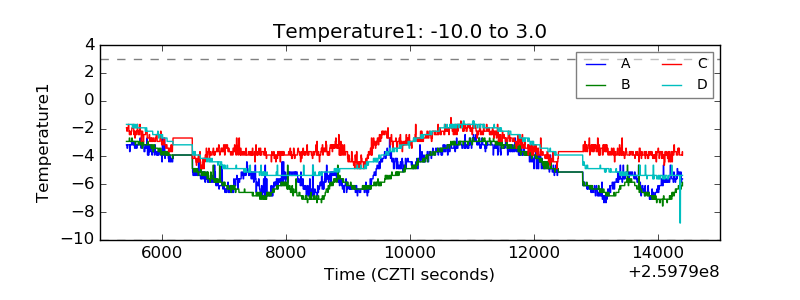 |
| Veto HV Monitor | 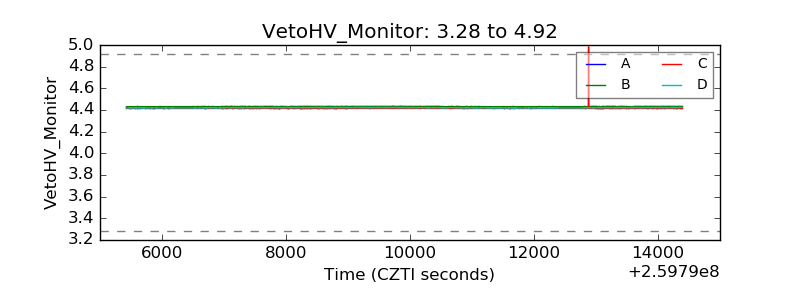 |
| Veto LLD | 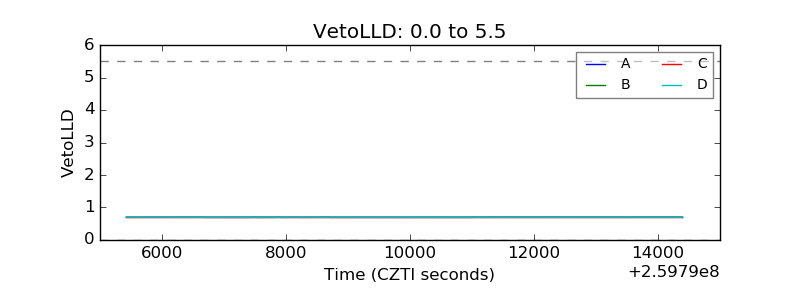 |
| Alpha Counter | 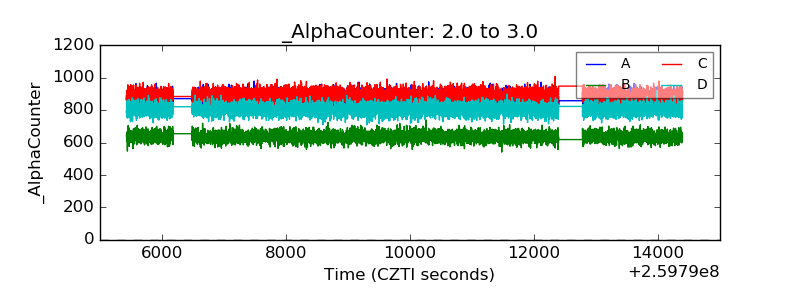 |
| _CPM_Rate | 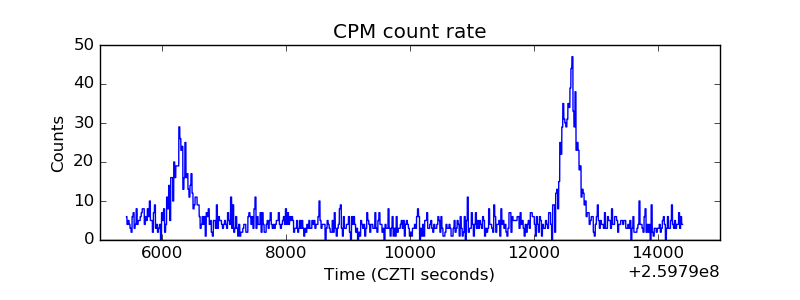 |
| CZT Counter | 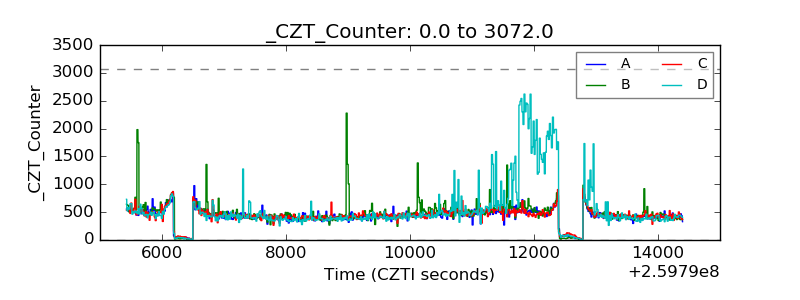 |
| +2.5 Volts monitor |  |
| +5 Volts monitor |  |
| _ROLL_ROT | 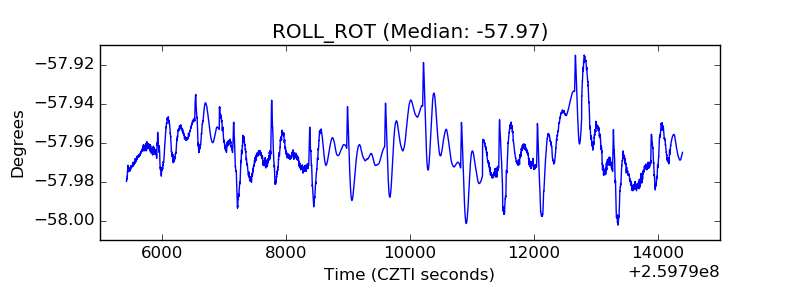 |
| _Roll_DEC | 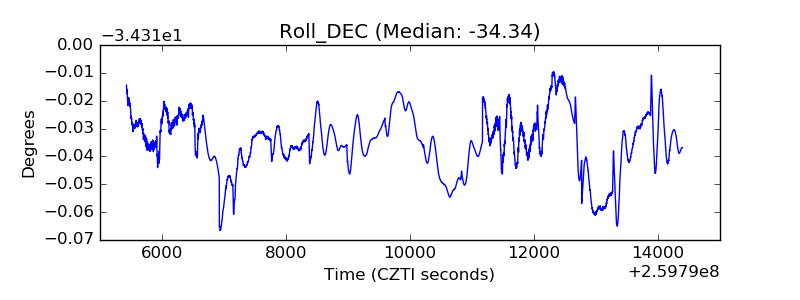 |
| _Roll_RA | 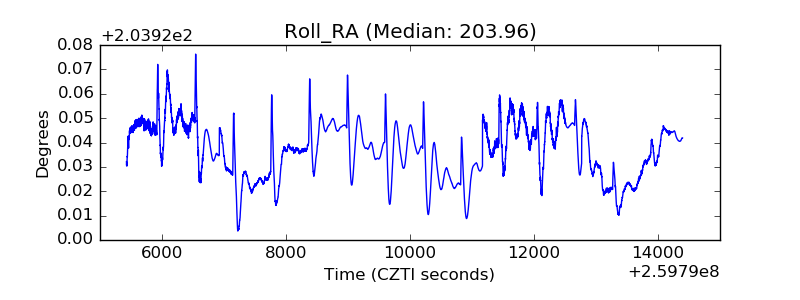 |
| Veto Counter | 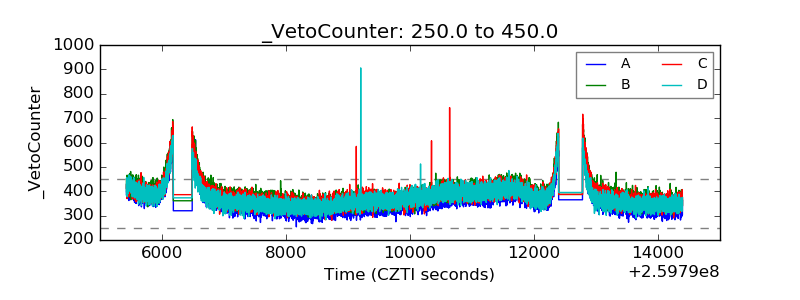 |