| Param | Original file | Final file |
|---|---|---|
| Filename | modeM0/AS1A04_103T01_9000001988_13483cztM0_level2.evt | modeM0/AS1A04_103T01_9000001988_13483cztM0_level2_quad_clean.evt |
| Size (bytes) | 830,399,040 | 167,333,760 |
| Size | 791.9 MB | 159.6 MB |
| Events in quadrant A | 5,894,791 | 1,051,761 |
| Events in quadrant B | 6,076,425 | 1,077,154 |
| Events in quadrant C | 5,925,339 | 1,048,123 |
| Events in quadrant D | 6,375,688 | 997,237 |
| Mode M0 | |||
|---|---|---|---|
| Quadrant | BADHDUFLAG | Total packets | Discarded packets |
| A | 0 | 26304 | 4 |
| B | 0 | 26546 | 3 |
| C | 0 | 26239 | 3 |
| D | 0 | 28186 | 3 |
| Mode SS | |||
|---|---|---|---|
| Quadrant | BADHDUFLAG | Total packets | Discarded packets |
| A | 0 | 264 | 0 |
| B | 0 | 264 | 0 |
| C | 0 | 264 | 0 |
| D | 0 | 264 | 0 |
| Mode M9 | |||
|---|---|---|---|
| Quadrant | BADHDUFLAG | Total packets | Discarded packets |
| A | 0 | 13 | 0 |
| B | 0 | 13 | 0 |
| C | 0 | 13 | 0 |
| D | 0 | 14 | 0 |
| Quadrant | Total seconds | Saturated seconds | Saturation percentage |
|---|---|---|---|
| A | 12931 | 49 | 0.378934% |
| B | 12931 | 91 | 0.703735% |
| C | 12931 | 70 | 0.541335% |
| D | 12931 | 64 | 0.494935% |
Noise dominated data is calculated using 1-second bins in cleaned event files. If a bin has >2000 counts, and if more than 50% of those come from <1% of pixels, then it is considered to be noise-dominated and hence unusable.
| Quadrant | # 1 sec bins | Bins with >0 counts | Bins with >2000 counts | High rate bins dominated by noise | Noise dominated (total time) | Noise dominated (detector-on time) | Marked lightcurve |
|---|---|---|---|---|---|---|---|
| A | 14157 | 12933 | 1 | 1 | 0.01% | 0.01% | 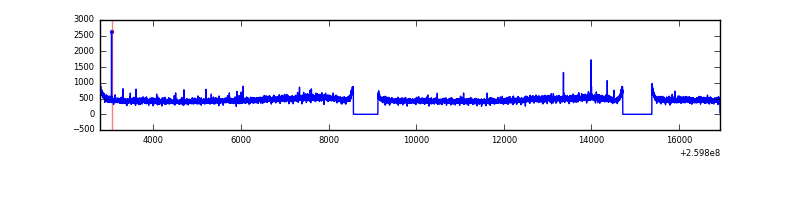 |
| B | 14157 | 12932 | 15 | 15 | 0.11% | 0.12% | 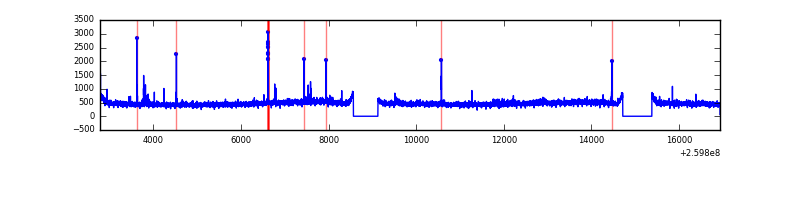 |
| C | 14157 | 12932 | 0 | 0 | 0.00% | 0.00% | 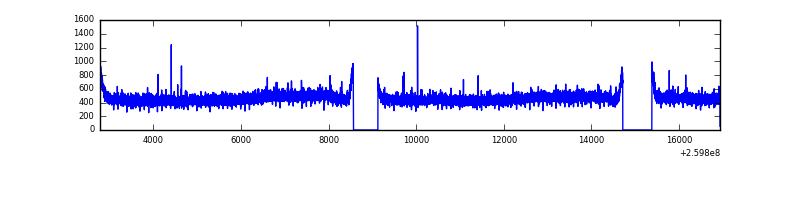 |
| D | 14157 | 12932 | 5 | 5 | 0.04% | 0.04% | 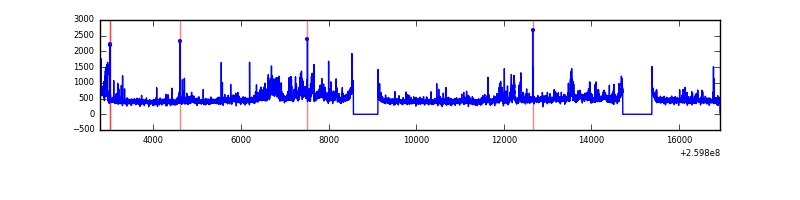 |
Top three noisy pixels from each quadrant. If the there are fewer than three noisy pixels in the level2.evt file, extra rows are filled as -1
| Pixel properties | Quadrant properties | ||||||
|---|---|---|---|---|---|---|---|
| Quadrant | DetID | PixID | Counts | Sigma | Mean | Median | Sigma |
| A | 8 | 15 | 50032 | 159.55 | 1507 | 1475 | 304.3 |
| A | 1 | 162 | 31036 | 97.13 | 1507 | 1475 | 304.3 |
| A | 0 | 226 | 13073 | 38.11 | 1507 | 1475 | 304.3 |
| B | 3 | 64 | 62654 | 210.01 | 1514 | 1472 | 291.3 |
| B | 0 | 214 | 57322 | 191.71 | 1514 | 1472 | 291.3 |
| B | 12 | 111 | 35050 | 115.26 | 1514 | 1472 | 291.3 |
| C | 3 | 233 | 129054 | 371.07 | 1482 | 1490 | 343.8 |
| C | 0 | 207 | 14108 | 36.7 | 1482 | 1490 | 343.8 |
| C | 13 | 61 | 10500 | 26.21 | 1482 | 1490 | 343.8 |
| D | 8 | 195 | 613983 | 1743.21 | 1463 | 1424 | 351.4 |
| D | 13 | 122 | 91926 | 257.55 | 1463 | 1424 | 351.4 |
| D | 13 | 249 | 49995 | 138.22 | 1463 | 1424 | 351.4 |
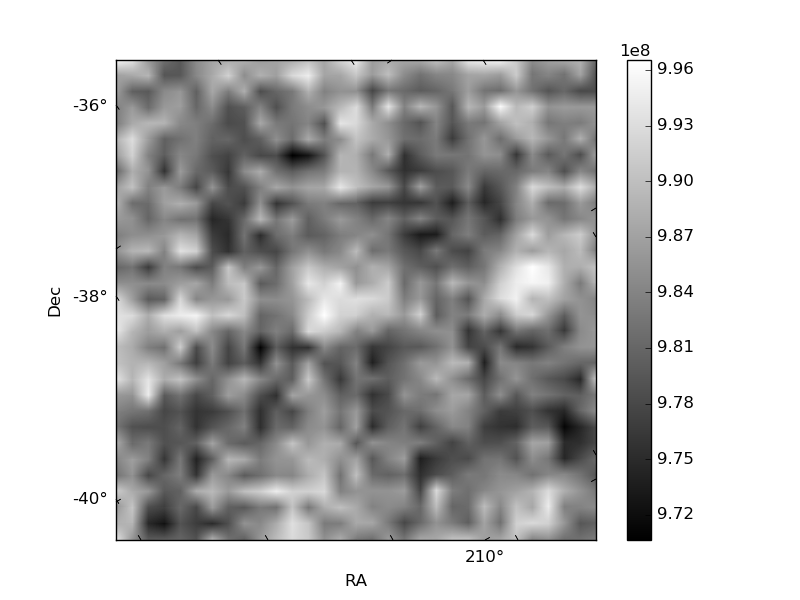
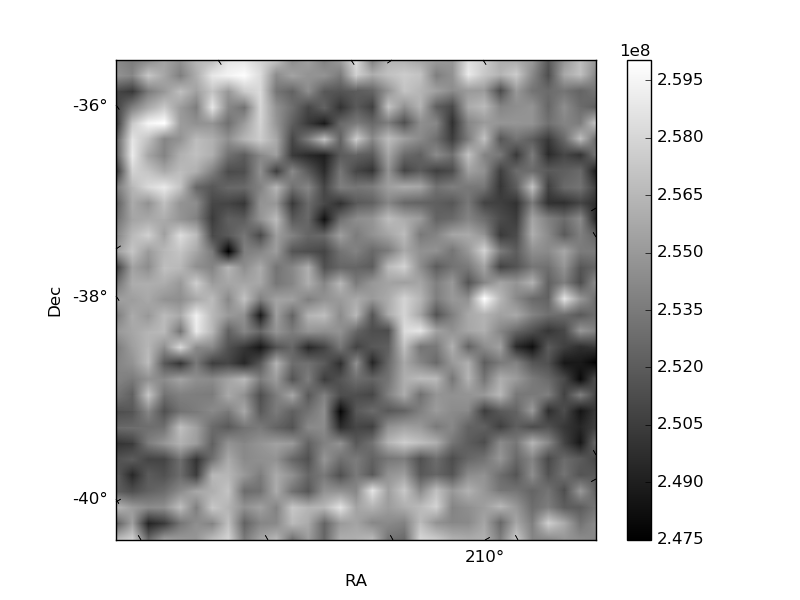
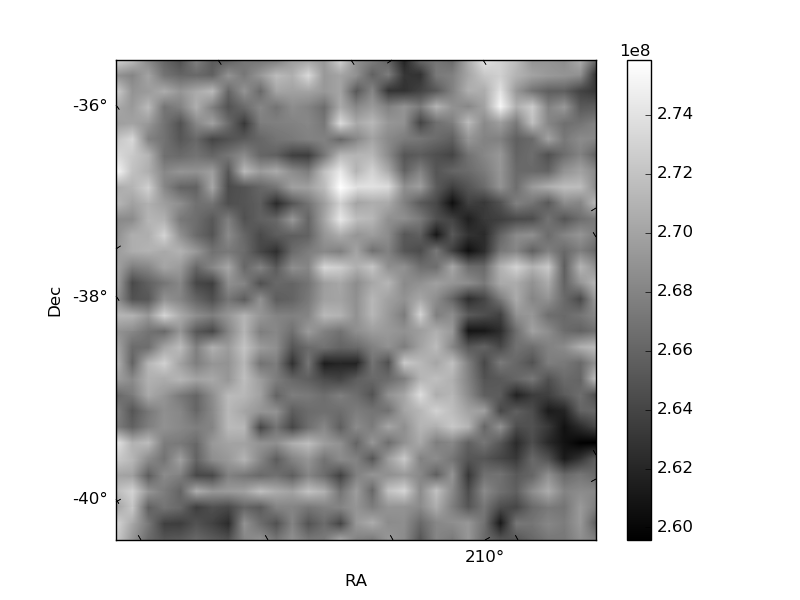
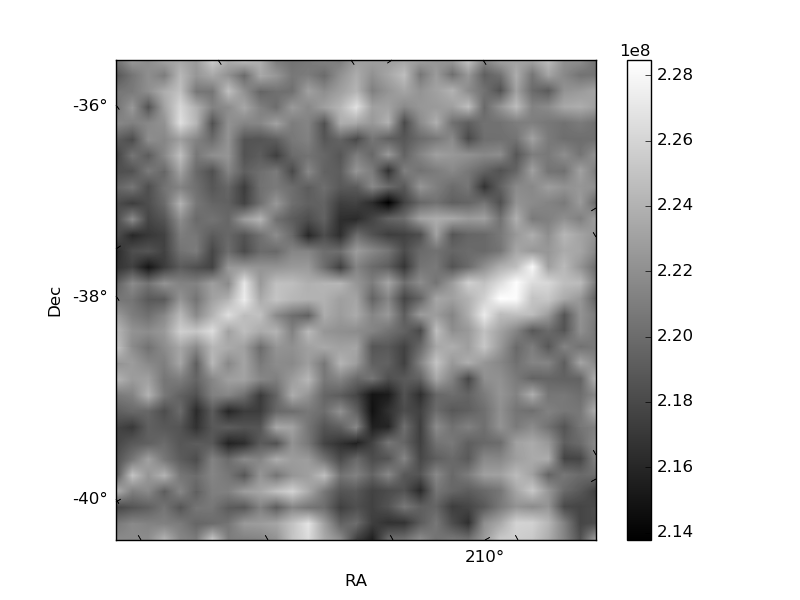
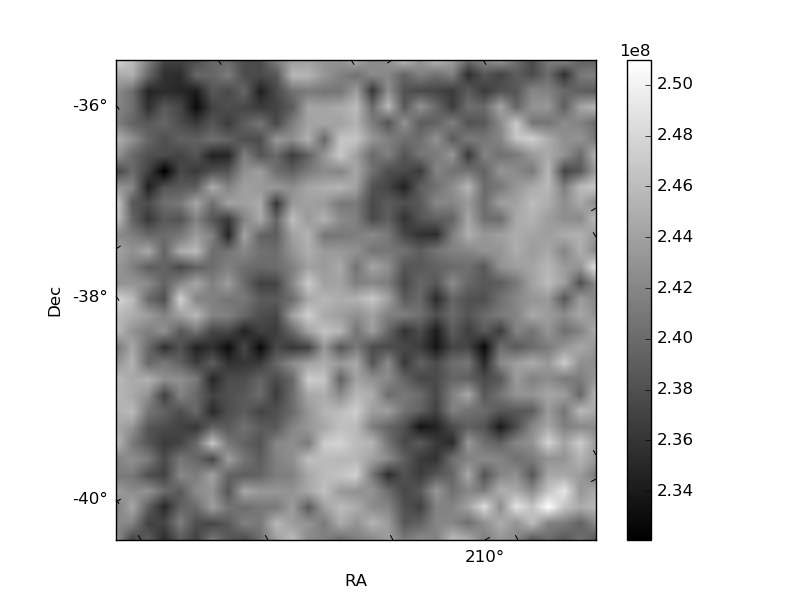
Histogram calculated using DETX and DETY for each event in the final _common_clean file
| Quadrant A | 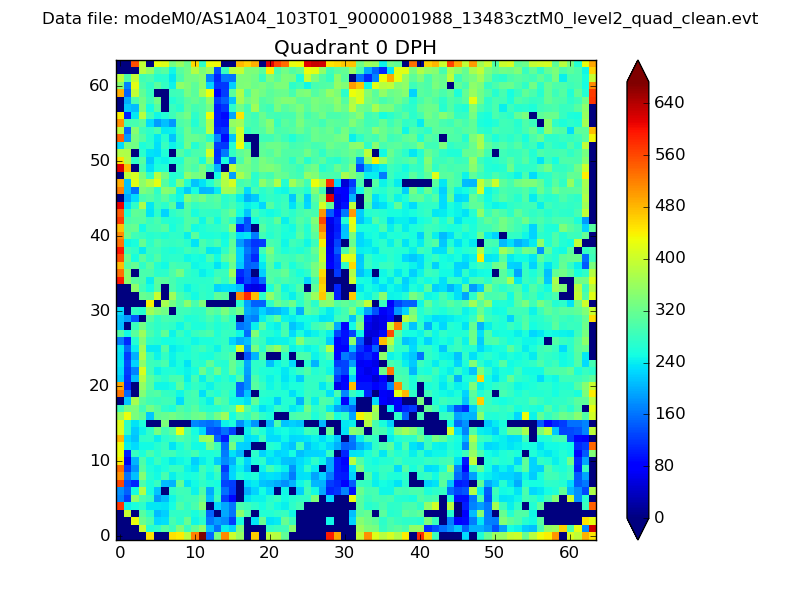 |
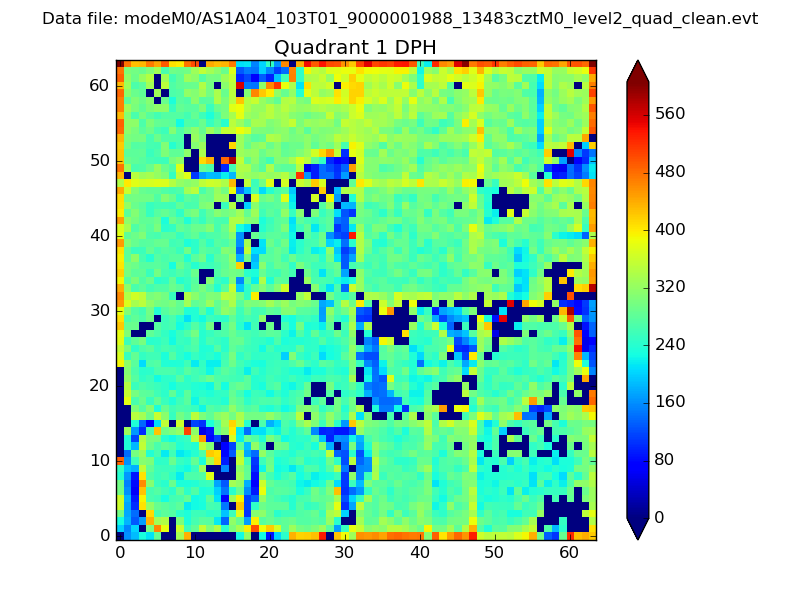 |
Quadrant B |
|---|---|---|---|
| Quadrant D | 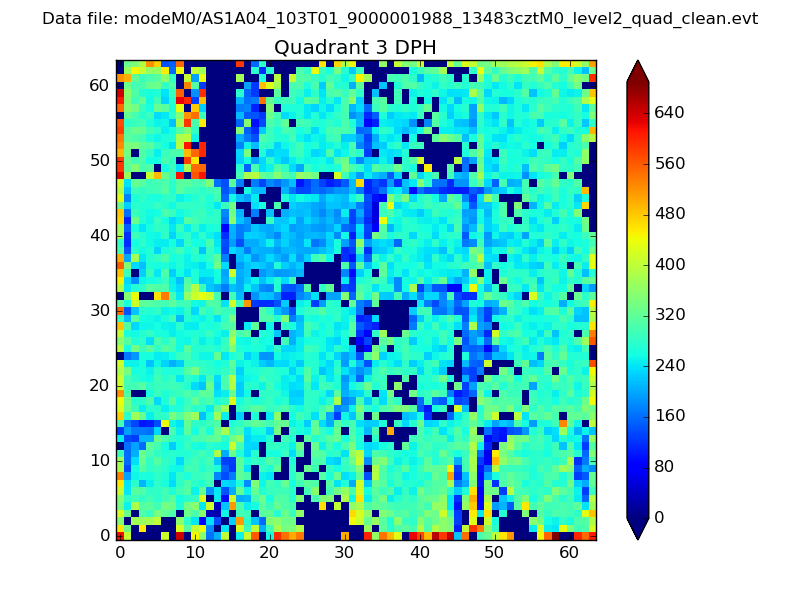 |
 |
Quadrant C |
| Plot type | Count rate plots | Images |
|---|---|---|
| Comparison with Poisson distribution Blue bars denote a histogram of data divided into 1 sec bins. Red curve is a Poisson curve with rate = median count rate of data. |
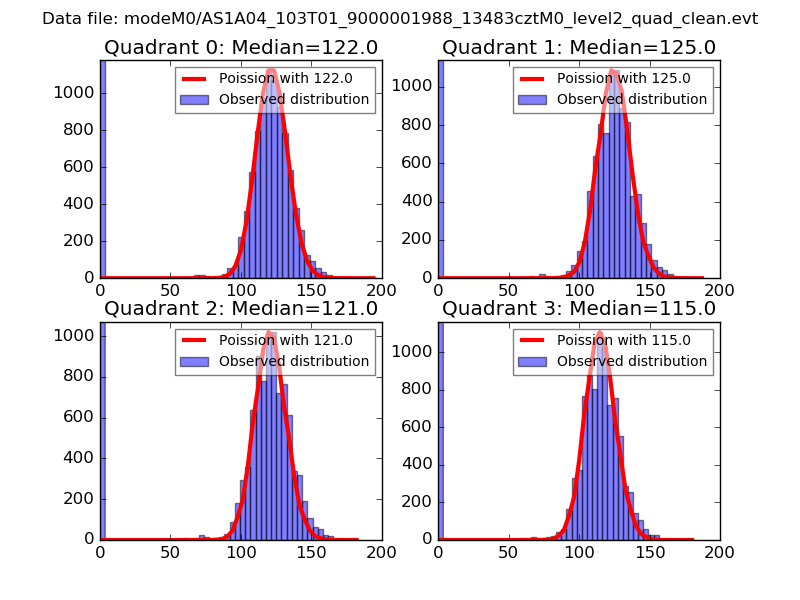 |
 |
| Quadrant-wise count rates Data is divided into 100 sec bins |
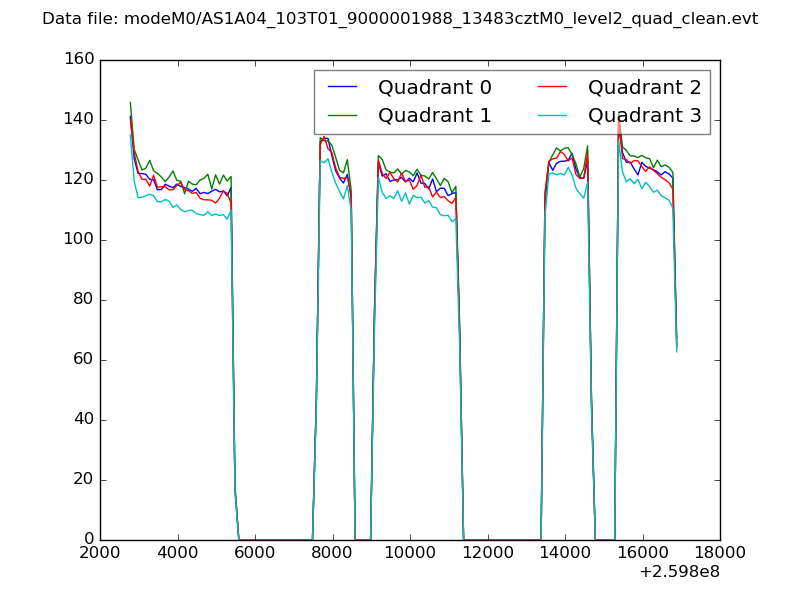 |
|
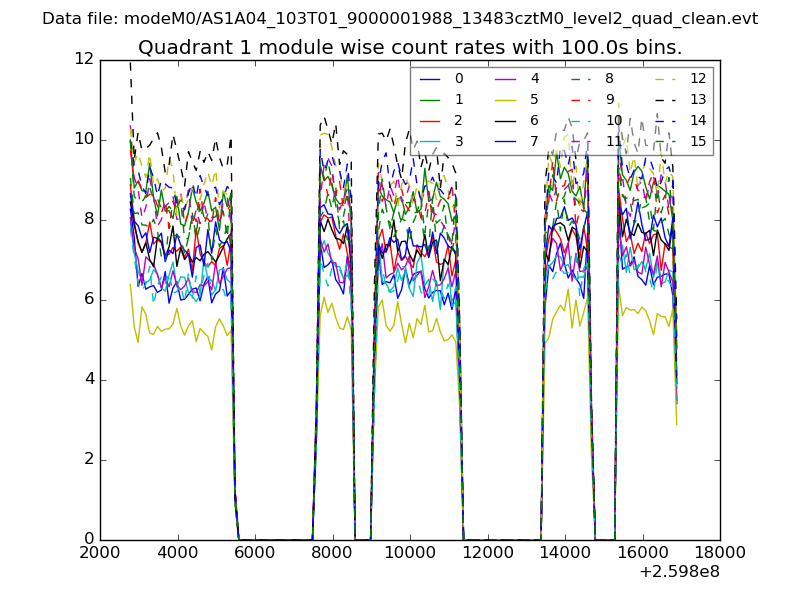
| Module-wise count rates for Quadrant A Data is divided into 100 sec bins |
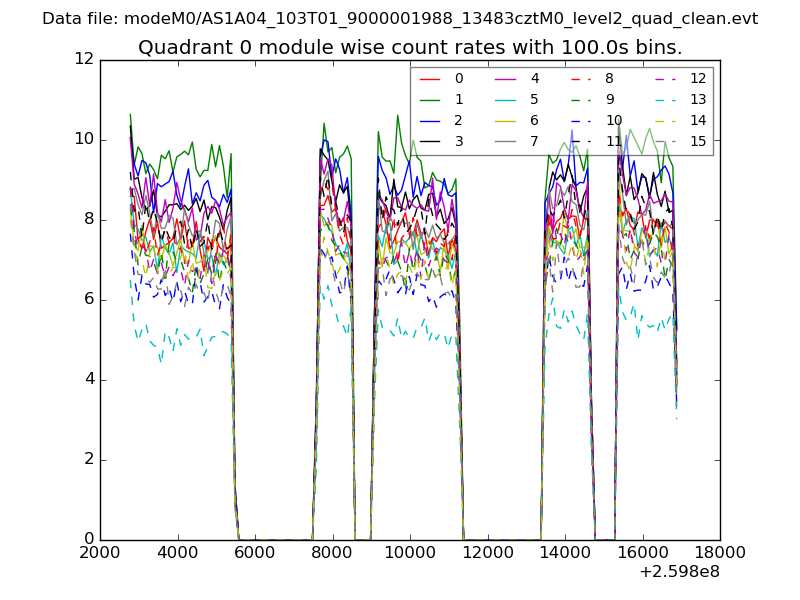 |
 |
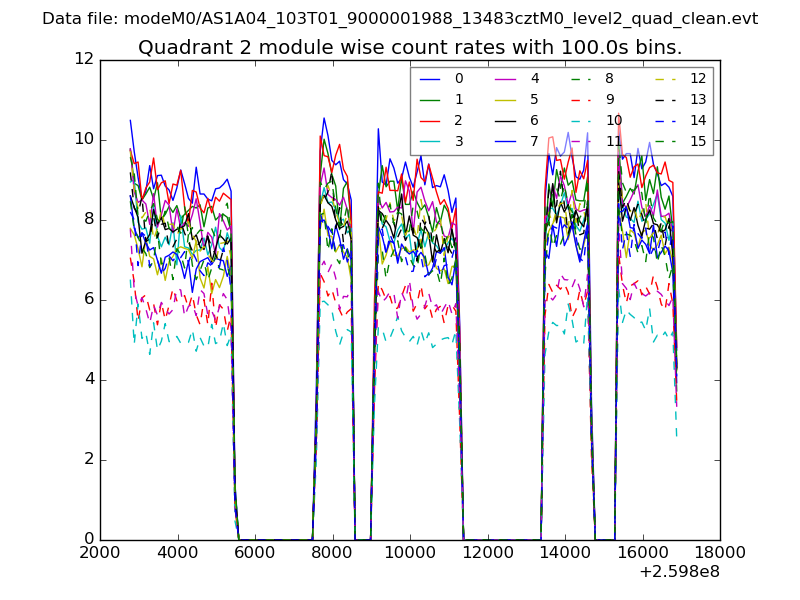
| Module-wise count rates for Quadrant B Data is divided into 100 sec bins |
 |
 |
| Module-wise count rates for Quadrant C Data is divided into 100 sec bins |
 |
 |
| Module-wise count rates for Quadrant D Data is divided into 100 sec bins |
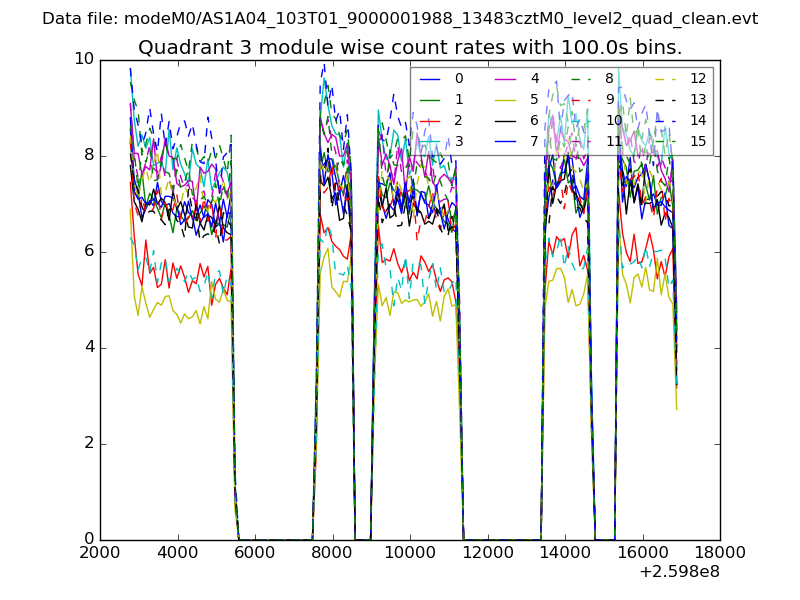 |
 |
| Parameter | Plot |
|---|---|
| CZT HV Monitor | 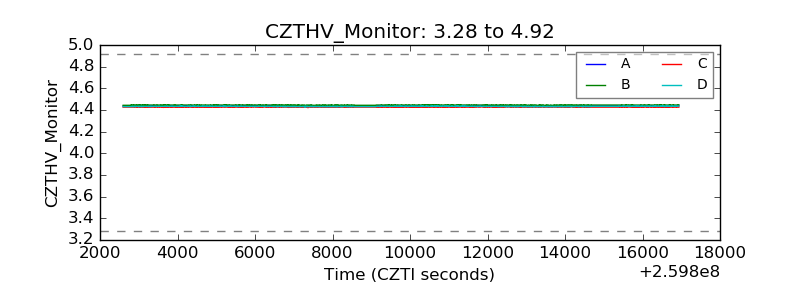 |
| D_VDD | 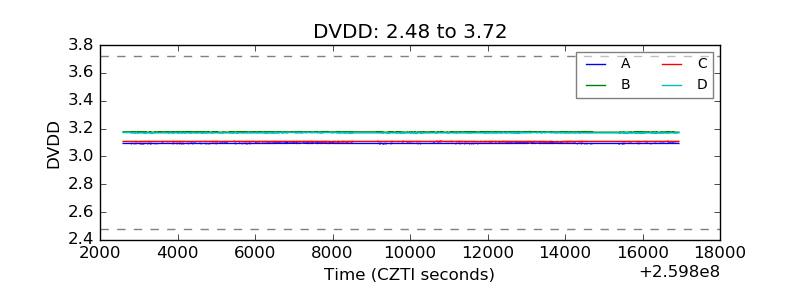 |
| Temperature 1 | 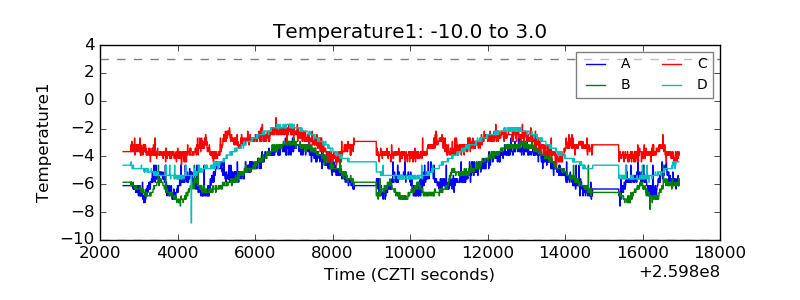 |
| Veto HV Monitor | 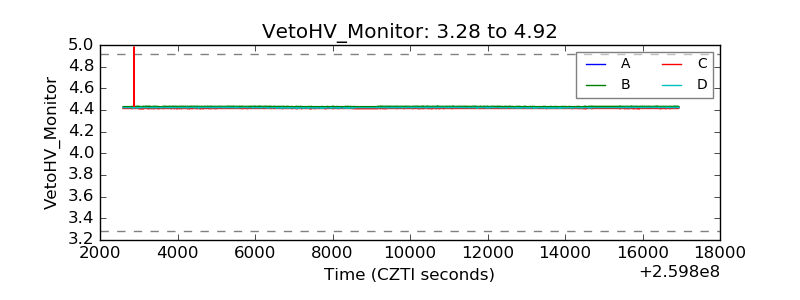 |
| Veto LLD | 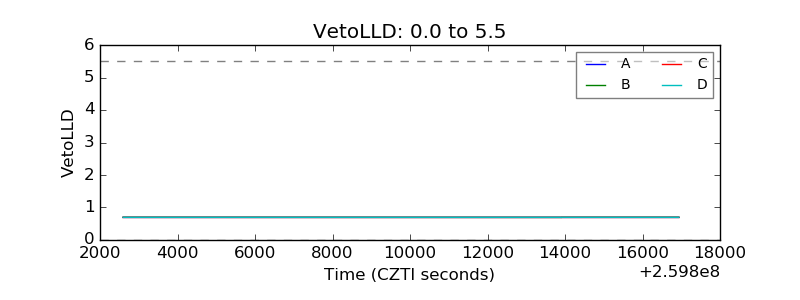 |
| Alpha Counter | 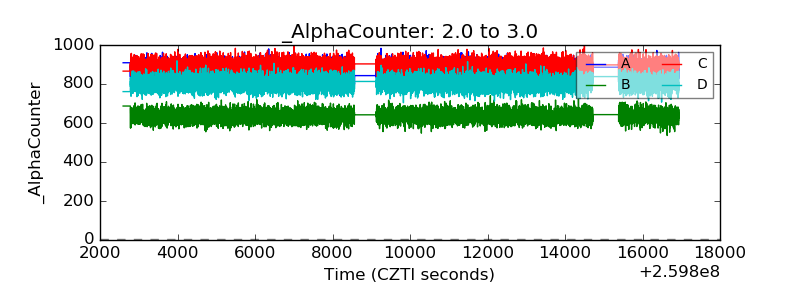 |
| _CPM_Rate | 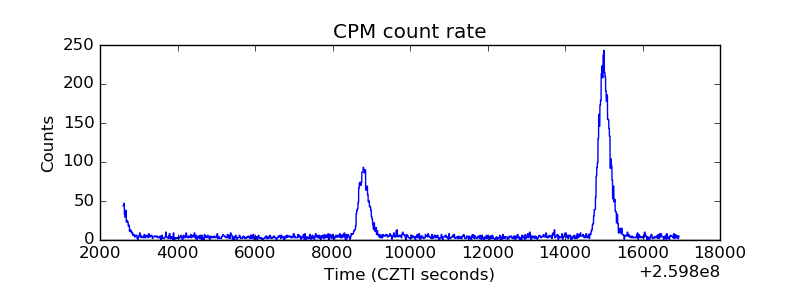 |
| CZT Counter | 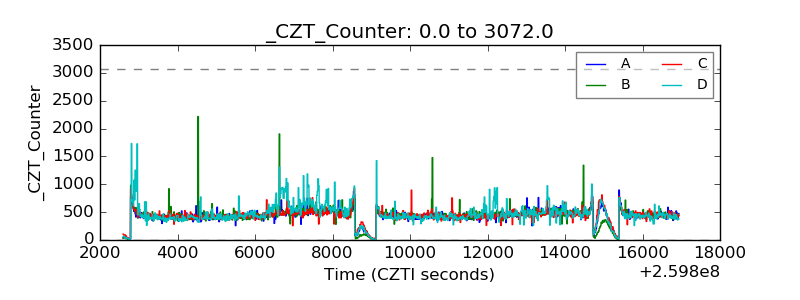 |
| +2.5 Volts monitor |  |
| +5 Volts monitor |  |
| _ROLL_ROT | 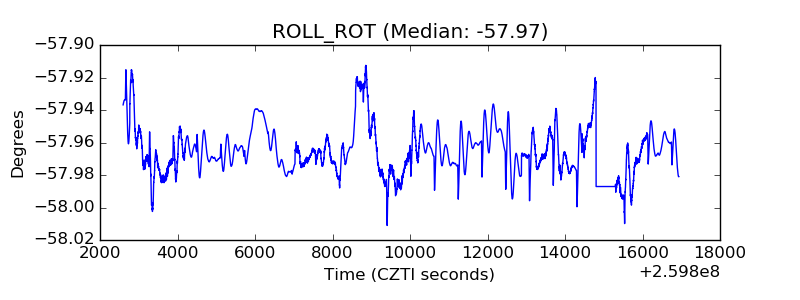 |
| _Roll_DEC | 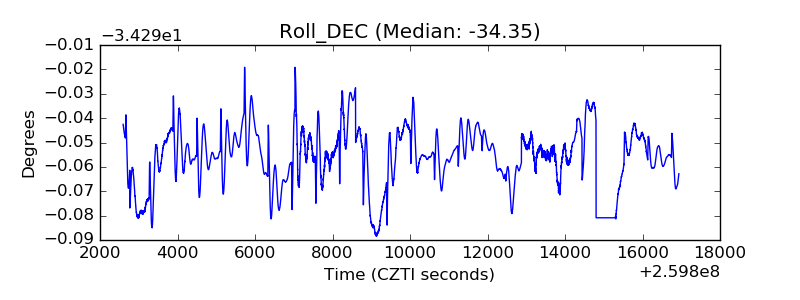 |
| _Roll_RA | 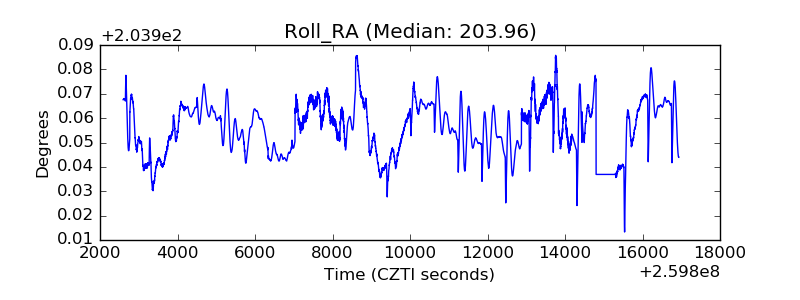 |
| Veto Counter | 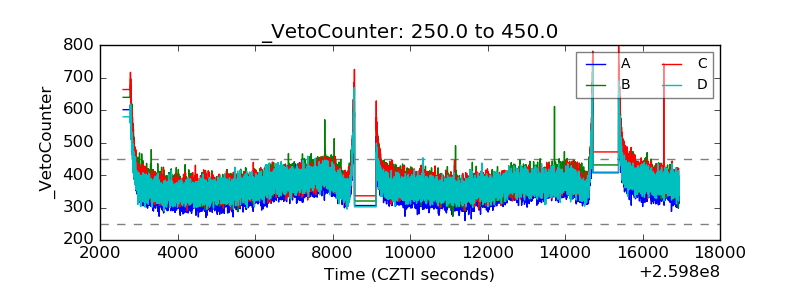 |