| Param | Original file | Final file |
|---|---|---|
| Filename | modeM0/AS1A04_103T01_9000001988_13484cztM0_level2.evt | modeM0/AS1A04_103T01_9000001988_13484cztM0_level2_quad_clean.evt |
| Size (bytes) | 482,598,720 | 105,635,520 |
| Size | 460.2 MB | 100.7 MB |
| Events in quadrant A | 3,488,277 | 672,404 |
| Events in quadrant B | 3,601,405 | 687,276 |
| Events in quadrant C | 3,537,760 | 673,340 |
| Events in quadrant D | 3,476,348 | 642,258 |
| Mode M0 | |||
|---|---|---|---|
| Quadrant | BADHDUFLAG | Total packets | Discarded packets |
| A | 0 | 15314 | 3 |
| B | 0 | 15512 | 2 |
| C | 0 | 15427 | 2 |
| D | 0 | 15591 | 2 |
| Mode SS | |||
|---|---|---|---|
| Quadrant | BADHDUFLAG | Total packets | Discarded packets |
| A | 0 | 156 | 0 |
| B | 0 | 156 | 0 |
| C | 0 | 156 | 0 |
| D | 0 | 156 | 0 |
| Mode M9 | |||
|---|---|---|---|
| Quadrant | BADHDUFLAG | Total packets | Discarded packets |
| A | 0 | 14 | 0 |
| B | 0 | 14 | 0 |
| C | 0 | 14 | 0 |
| D | 0 | 14 | 0 |
| Quadrant | Total seconds | Saturated seconds | Saturation percentage |
|---|---|---|---|
| A | 7524 | 58 | 0.770867% |
| B | 7524 | 87 | 1.156300% |
| C | 7524 | 81 | 1.076555% |
| D | 7524 | 73 | 0.970229% |
Noise dominated data is calculated using 1-second bins in cleaned event files. If a bin has >2000 counts, and if more than 50% of those come from <1% of pixels, then it is considered to be noise-dominated and hence unusable.
| Quadrant | # 1 sec bins | Bins with >0 counts | Bins with >2000 counts | High rate bins dominated by noise | Noise dominated (total time) | Noise dominated (detector-on time) | Marked lightcurve |
|---|---|---|---|---|---|---|---|
| A | 9030 | 7525 | 0 | 0 | 0.00% | 0.00% | 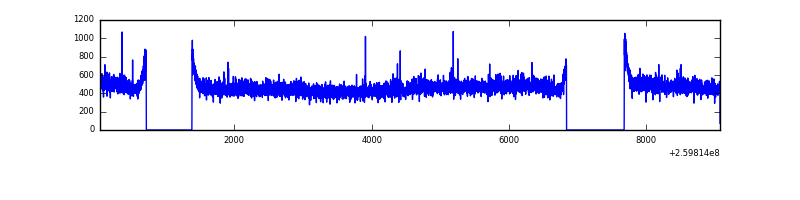 |
| B | 9030 | 7526 | 5 | 5 | 0.06% | 0.07% | 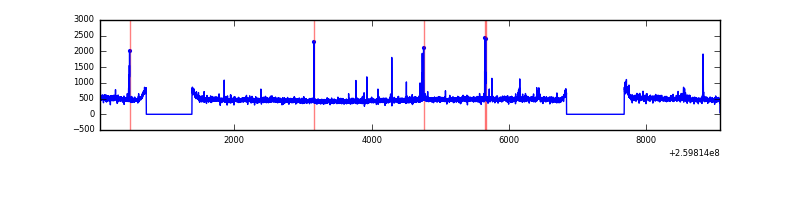 |
| C | 9030 | 7526 | 3 | 3 | 0.03% | 0.04% | 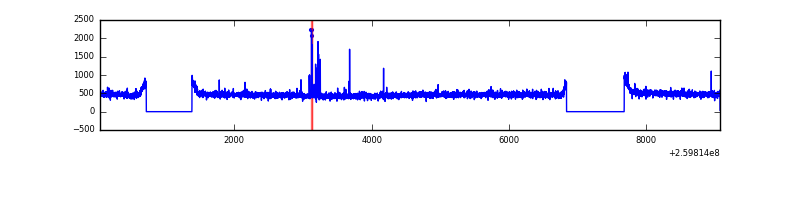 |
| D | 9030 | 7526 | 11 | 11 | 0.12% | 0.15% | 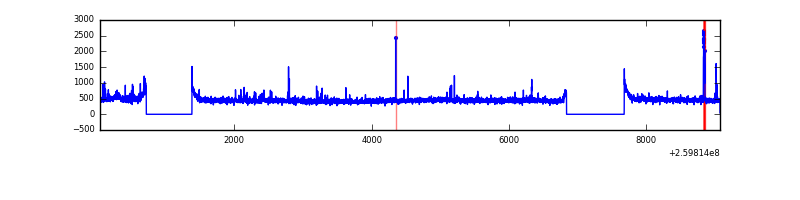 |
Top three noisy pixels from each quadrant. If the there are fewer than three noisy pixels in the level2.evt file, extra rows are filled as -1
| Pixel properties | Quadrant properties | ||||||
|---|---|---|---|---|---|---|---|
| Quadrant | DetID | PixID | Counts | Sigma | Mean | Median | Sigma |
| A | 1 | 162 | 24664 | 129.21 | 897 | 877 | 184.1 |
| A | 0 | 226 | 7786 | 37.53 | 897 | 877 | 184.1 |
| A | 1 | 178 | 6767 | 31.99 | 897 | 877 | 184.1 |
| B | 4 | 142 | 27605 | 154.97 | 898 | 874 | 172.5 |
| B | 0 | 214 | 26376 | 147.85 | 898 | 874 | 172.5 |
| B | 3 | 64 | 25499 | 142.76 | 898 | 874 | 172.5 |
| C | 3 | 233 | 67598 | 325.7 | 882 | 888 | 204.8 |
| C | 0 | 207 | 32464 | 154.16 | 882 | 888 | 204.8 |
| C | 13 | 61 | 6291 | 26.38 | 882 | 888 | 204.8 |
| D | 8 | 195 | 65636 | 308.66 | 871 | 844 | 209.9 |
| D | 13 | 249 | 54882 | 257.43 | 871 | 844 | 209.9 |
| D | 2 | 234 | 28586 | 132.16 | 871 | 844 | 209.9 |
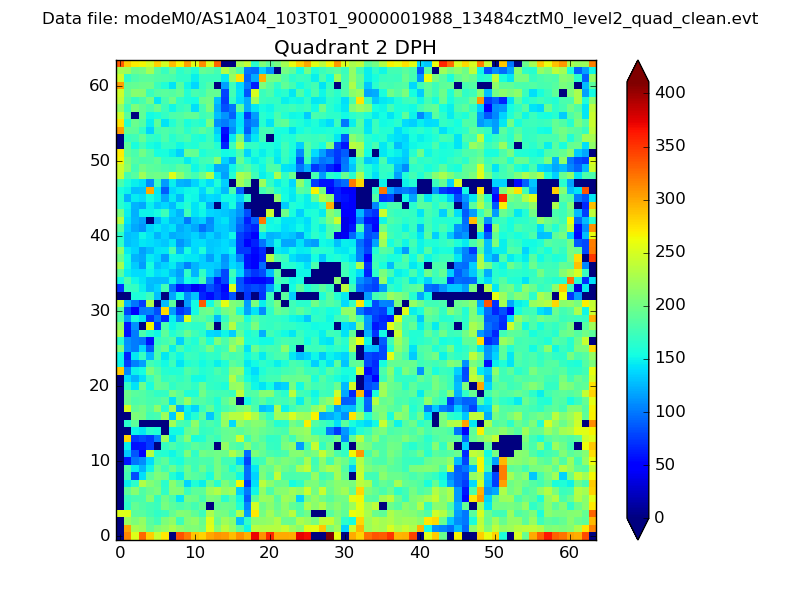
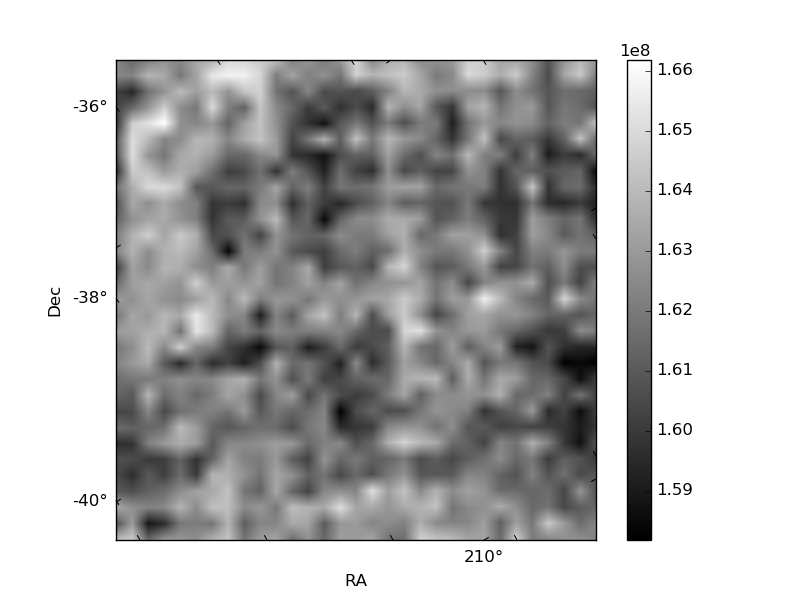
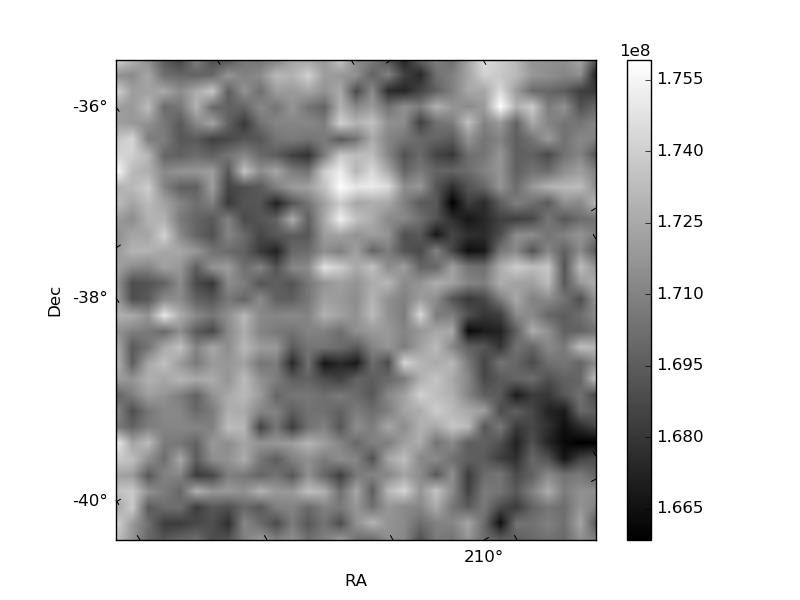
Histogram calculated using DETX and DETY for each event in the final _common_clean file
| Quadrant A | 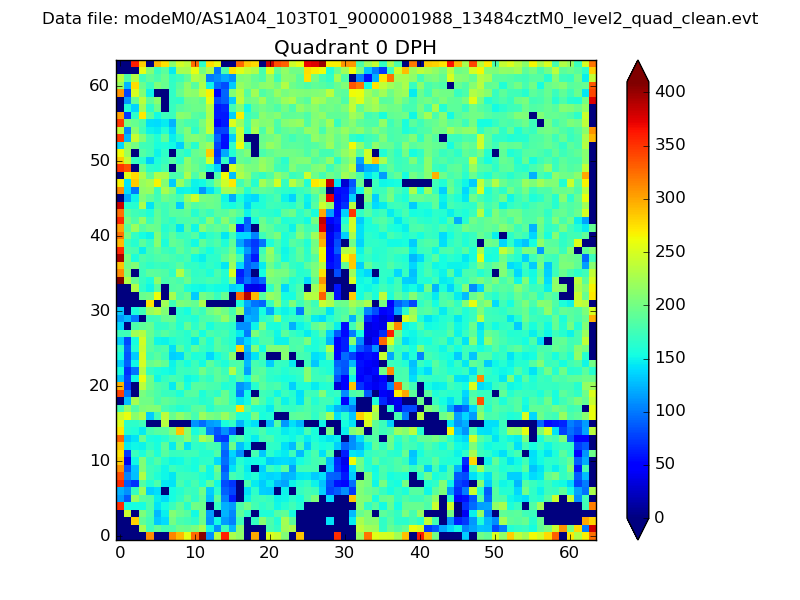 |
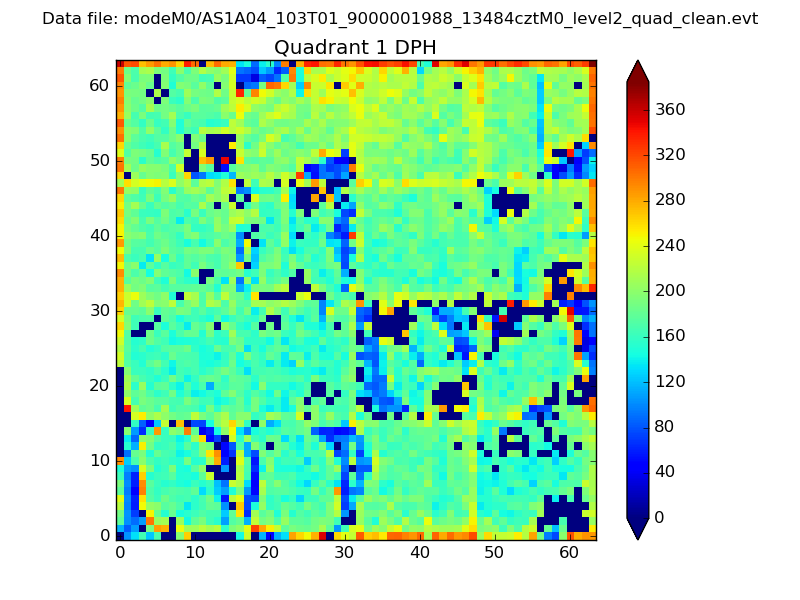 |
Quadrant B |
|---|---|---|---|
| Quadrant D | 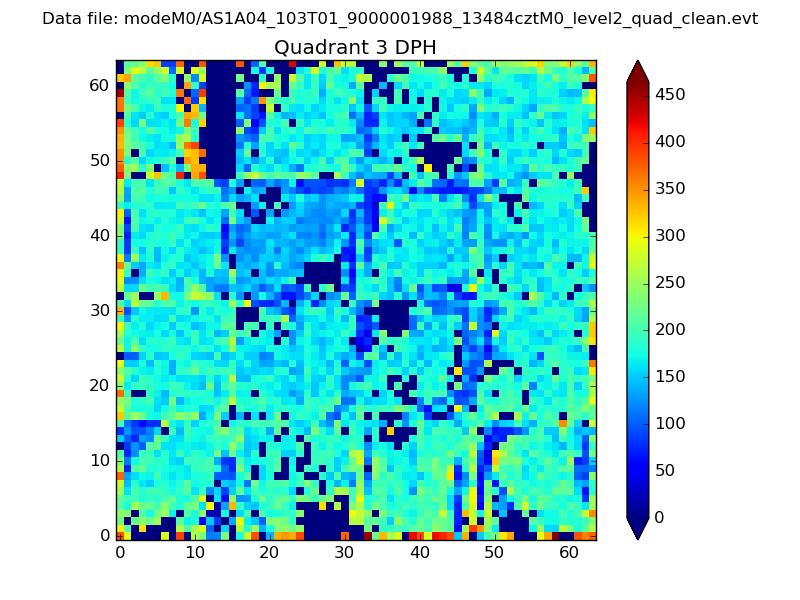 |
 |
Quadrant C |
| Plot type | Count rate plots | Images |
|---|---|---|
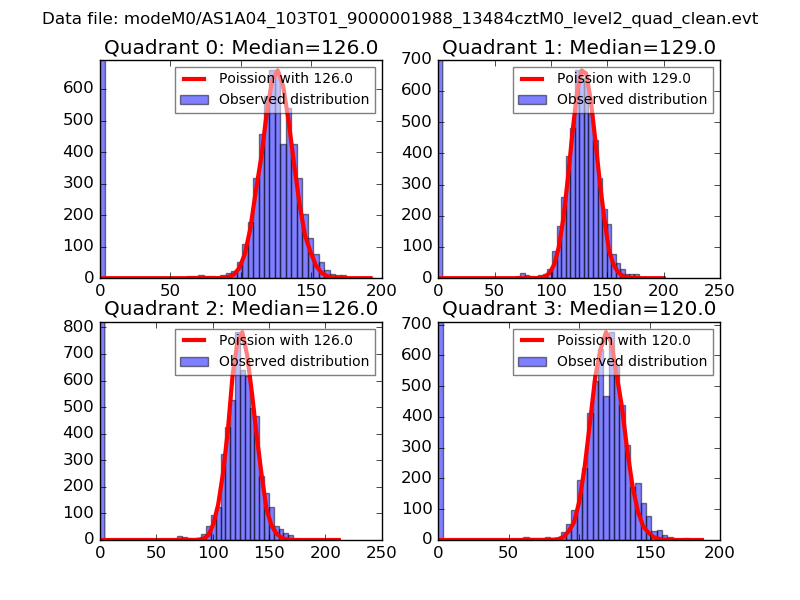
| Comparison with Poisson distribution Blue bars denote a histogram of data divided into 1 sec bins. Red curve is a Poisson curve with rate = median count rate of data. |
 |
 |
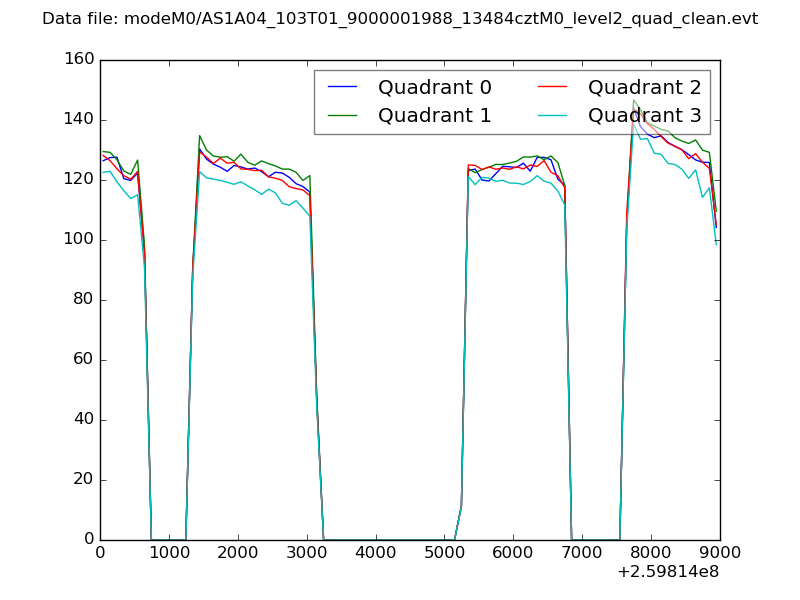
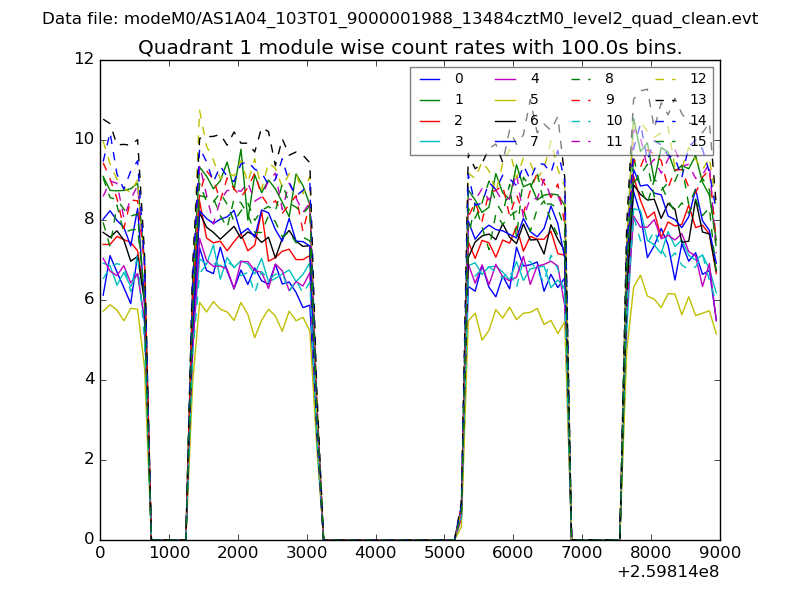
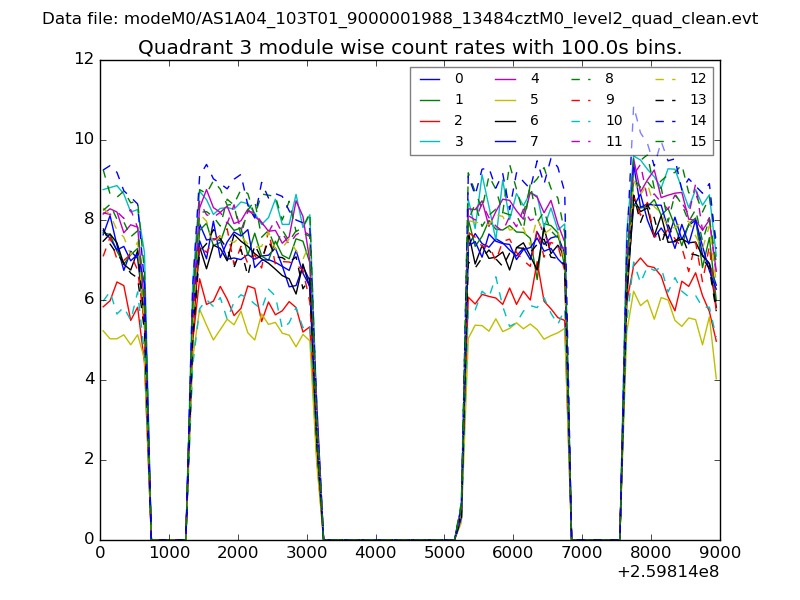
| Quadrant-wise count rates Data is divided into 100 sec bins |
 |
|
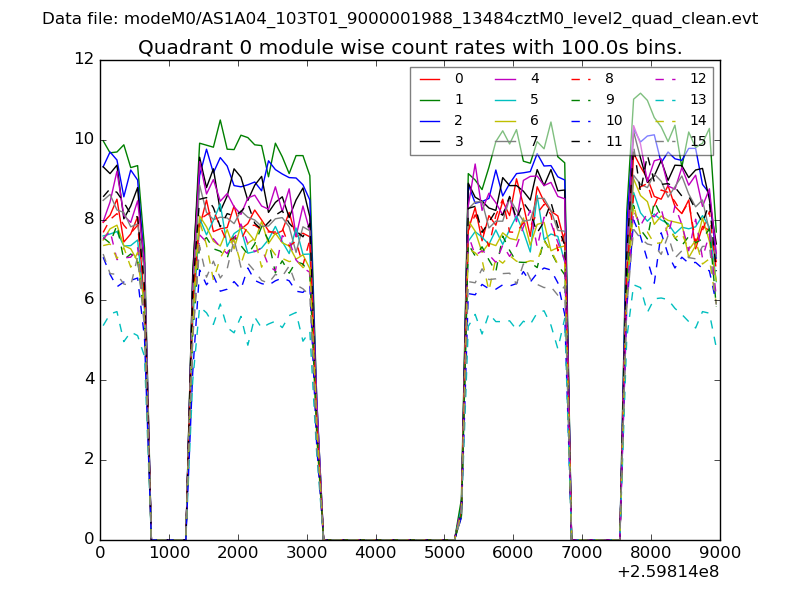
| Module-wise count rates for Quadrant A Data is divided into 100 sec bins |
 |
 |
| Module-wise count rates for Quadrant B Data is divided into 100 sec bins |
 |
 |
| Module-wise count rates for Quadrant C Data is divided into 100 sec bins |
 |
 |
| Module-wise count rates for Quadrant D Data is divided into 100 sec bins |
 |
 |
| Parameter | Plot |
|---|---|
| CZT HV Monitor | 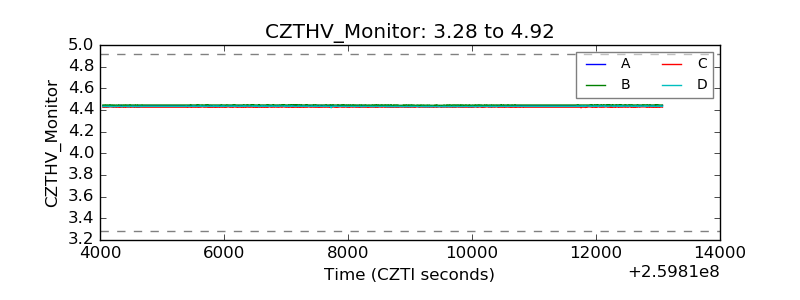 |
| D_VDD | 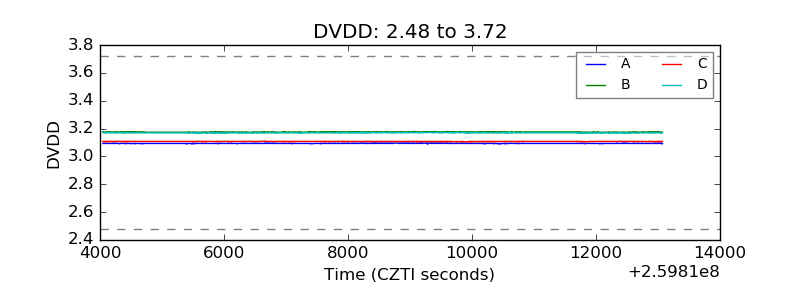 |
| Temperature 1 | 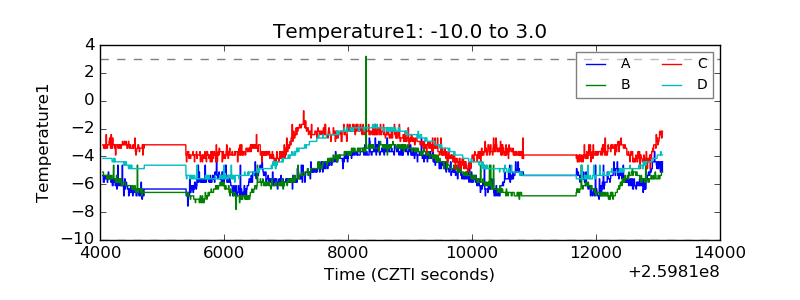 |
| Veto HV Monitor | 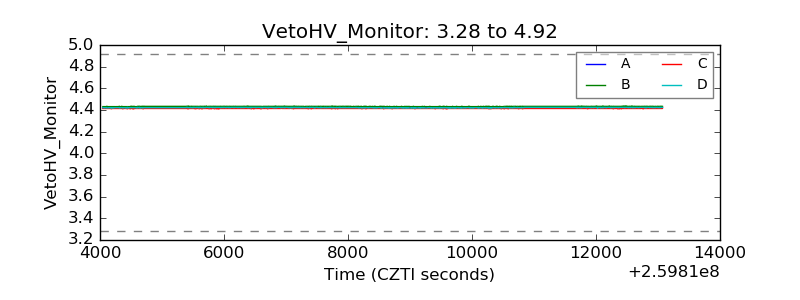 |
| Veto LLD | 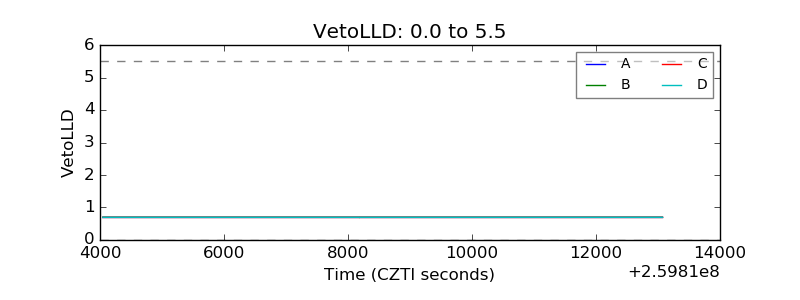 |
| Alpha Counter | 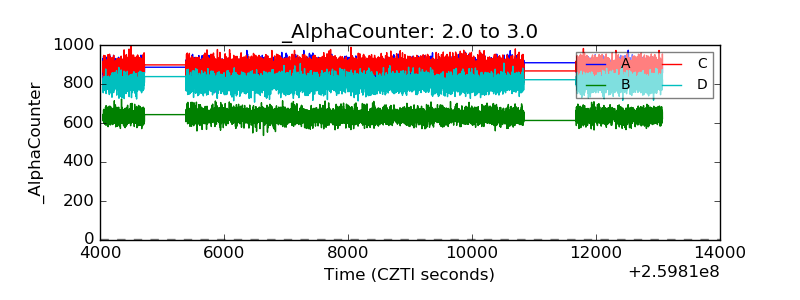 |
| _CPM_Rate | 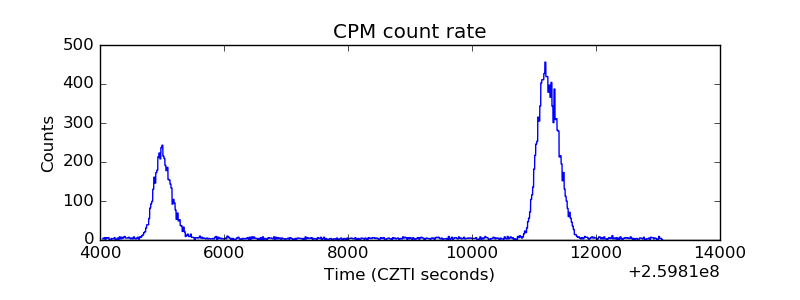 |
| CZT Counter | 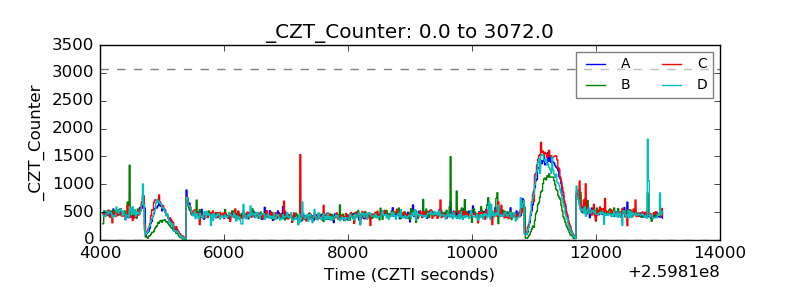 |
| +2.5 Volts monitor |  |
| +5 Volts monitor |  |
| _ROLL_ROT | 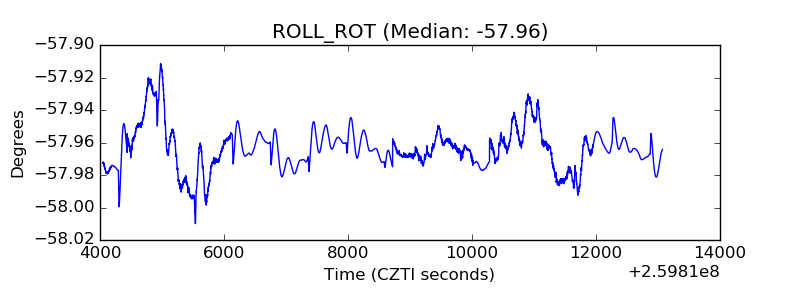 |
| _Roll_DEC | 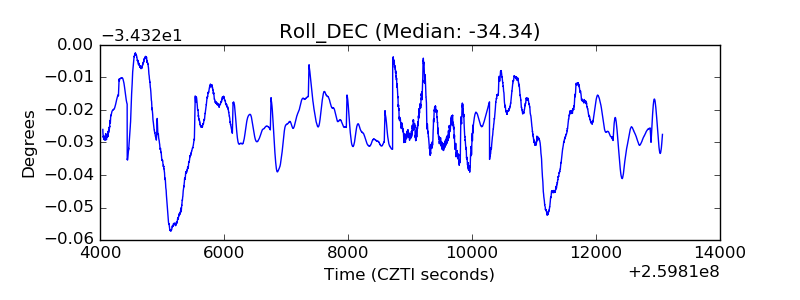 |
| _Roll_RA | 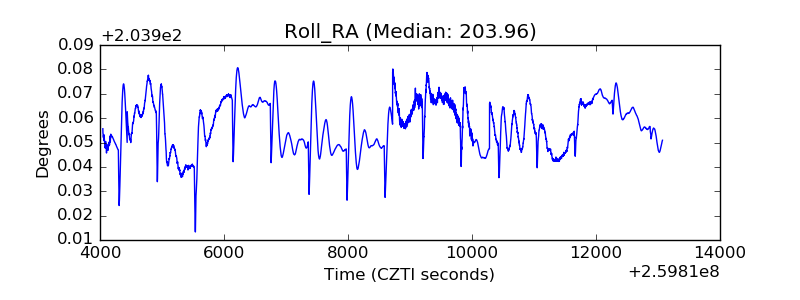 |
| Veto Counter | 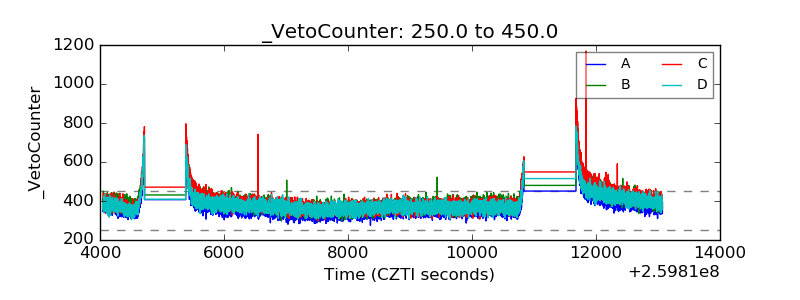 |