| Param | Original file | Final file |
|---|---|---|
| Filename | modeM0/AS1A04_103T01_9000001988_13485cztM0_level2.evt | modeM0/AS1A04_103T01_9000001988_13485cztM0_level2_quad_clean.evt |
| Size (bytes) | 432,184,320 | 86,192,640 |
| Size | 412.2 MB | 82.2 MB |
| Events in quadrant A | 3,097,333 | 541,465 |
| Events in quadrant B | 3,277,305 | 552,396 |
| Events in quadrant C | 3,152,635 | 541,574 |
| Events in quadrant D | 3,115,645 | 517,548 |
| Mode M0 | |||
|---|---|---|---|
| Quadrant | BADHDUFLAG | Total packets | Discarded packets |
| A | 0 | 13439 | 3 |
| B | 0 | 13728 | 2 |
| C | 0 | 13558 | 2 |
| D | 0 | 13720 | 2 |
| Mode SS | |||
|---|---|---|---|
| Quadrant | BADHDUFLAG | Total packets | Discarded packets |
| A | 0 | 134 | 0 |
| B | 0 | 134 | 0 |
| C | 0 | 134 | 0 |
| D | 0 | 134 | 0 |
| Mode M9 | |||
|---|---|---|---|
| Quadrant | BADHDUFLAG | Total packets | Discarded packets |
| A | 0 | 10 | 0 |
| B | 0 | 10 | 0 |
| C | 0 | 10 | 0 |
| D | 0 | 11 | 0 |
| Quadrant | Total seconds | Saturated seconds | Saturation percentage |
|---|---|---|---|
| A | 6552 | 55 | 0.839438% |
| B | 6552 | 75 | 1.144689% |
| C | 6552 | 57 | 0.869963% |
| D | 6552 | 64 | 0.976801% |
Noise dominated data is calculated using 1-second bins in cleaned event files. If a bin has >2000 counts, and if more than 50% of those come from <1% of pixels, then it is considered to be noise-dominated and hence unusable.
| Quadrant | # 1 sec bins | Bins with >0 counts | Bins with >2000 counts | High rate bins dominated by noise | Noise dominated (total time) | Noise dominated (detector-on time) | Marked lightcurve |
|---|---|---|---|---|---|---|---|
| A | 7548 | 6553 | 0 | 0 | 0.00% | 0.00% | 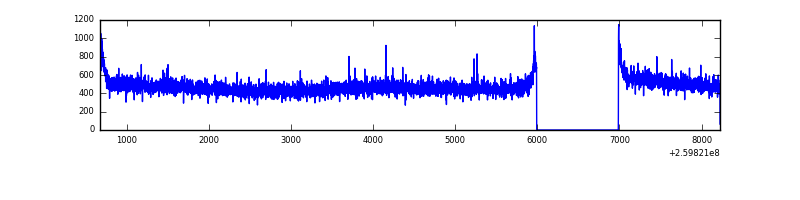 |
| B | 7548 | 6553 | 5 | 5 | 0.07% | 0.08% | 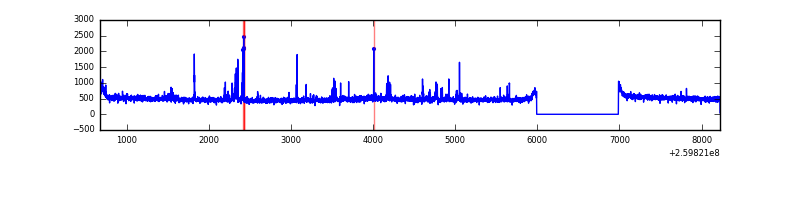 |
| C | 7548 | 6553 | 0 | 0 | 0.00% | 0.00% | 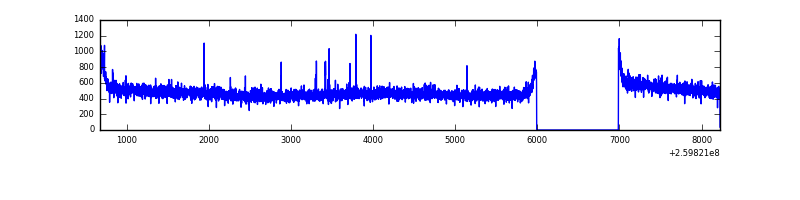 |
| D | 7548 | 6553 | 15 | 15 | 0.20% | 0.23% | 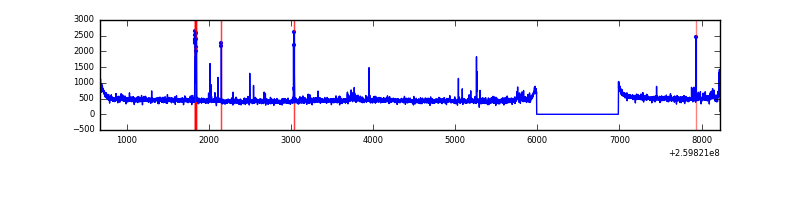 |
Top three noisy pixels from each quadrant. If the there are fewer than three noisy pixels in the level2.evt file, extra rows are filled as -1
| Pixel properties | Quadrant properties | ||||||
|---|---|---|---|---|---|---|---|
| Quadrant | DetID | PixID | Counts | Sigma | Mean | Median | Sigma |
| A | 1 | 162 | 17383 | 101.84 | 798 | 781 | 163.0 |
| A | 0 | 226 | 7025 | 38.3 | 798 | 781 | 163.0 |
| A | 12 | 194 | 5951 | 31.71 | 798 | 781 | 163.0 |
| B | 4 | 173 | 82773 | 539.82 | 797 | 776 | 151.9 |
| B | 0 | 214 | 27529 | 176.12 | 797 | 776 | 151.9 |
| B | 0 | 230 | 25831 | 164.95 | 797 | 776 | 151.9 |
| C | 3 | 233 | 61991 | 334.38 | 787 | 792 | 183.0 |
| C | 0 | 207 | 15474 | 80.22 | 787 | 792 | 183.0 |
| C | 14 | 220 | 6174 | 29.41 | 787 | 792 | 183.0 |
| D | 8 | 195 | 77968 | 412.17 | 778 | 756 | 187.3 |
| D | 13 | 249 | 71959 | 380.09 | 778 | 756 | 187.3 |
| D | 2 | 234 | 21742 | 112.03 | 778 | 756 | 187.3 |
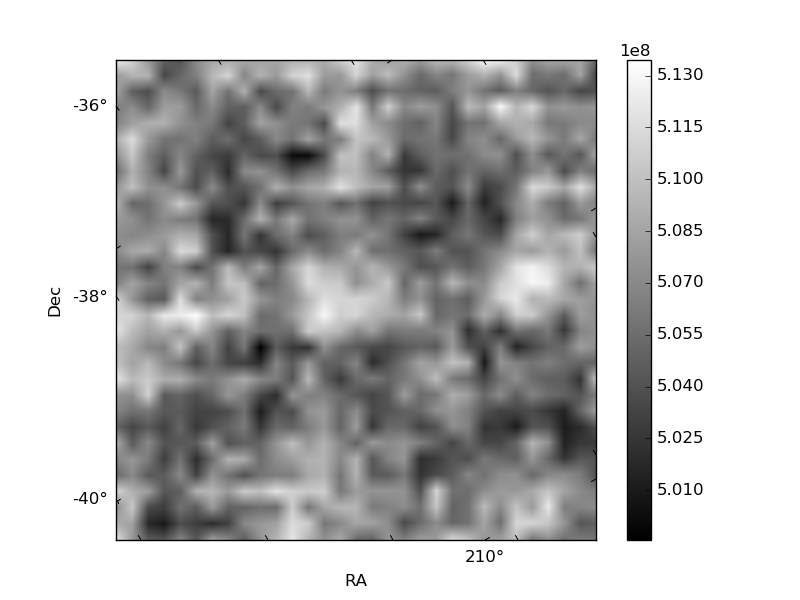
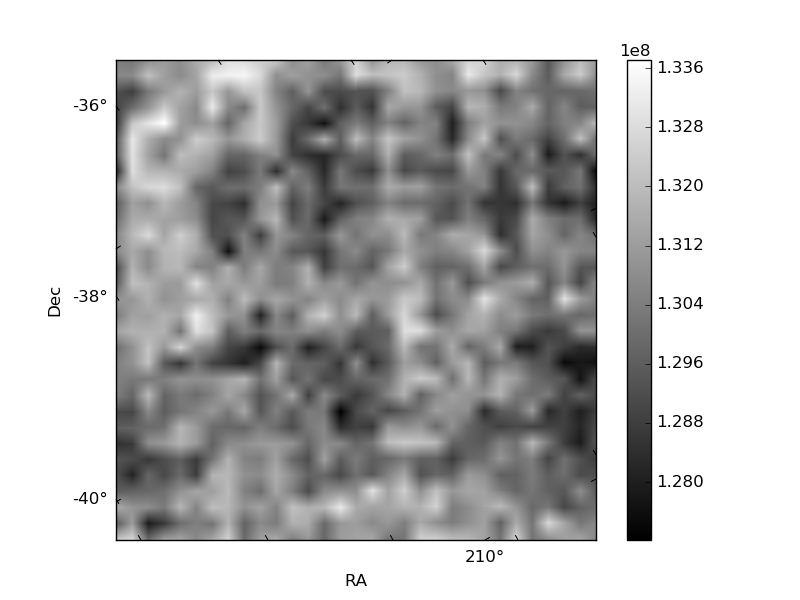
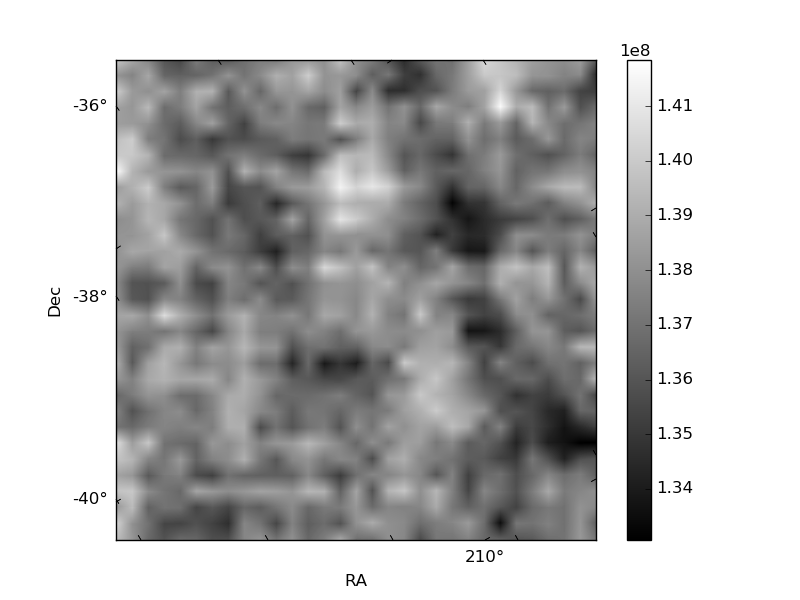
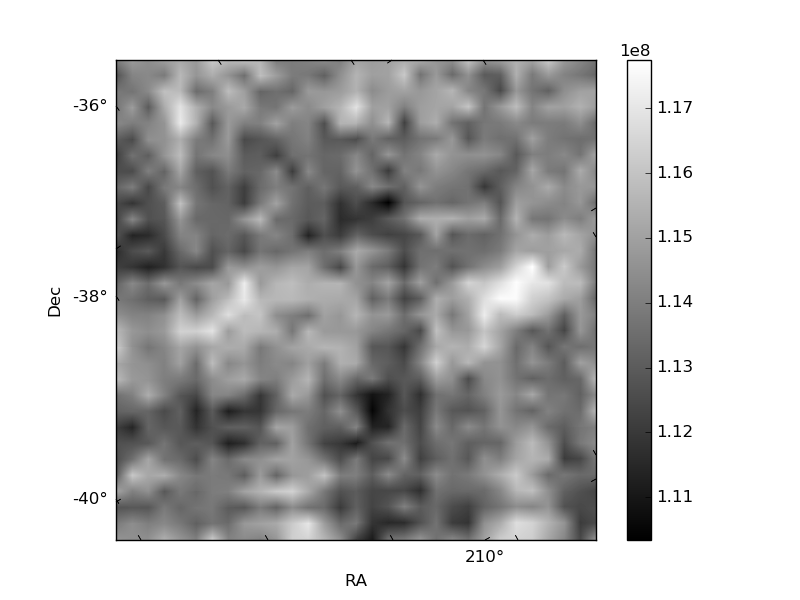
Histogram calculated using DETX and DETY for each event in the final _common_clean file
| Quadrant A | 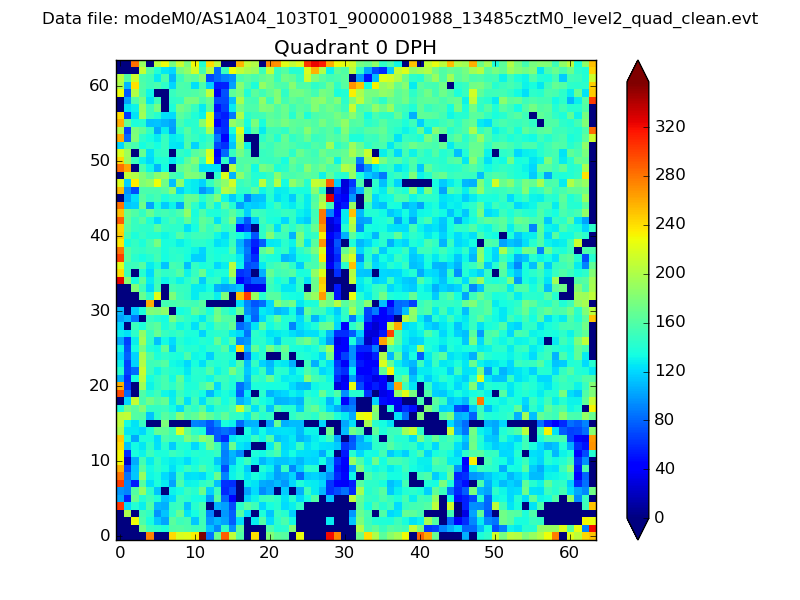 |
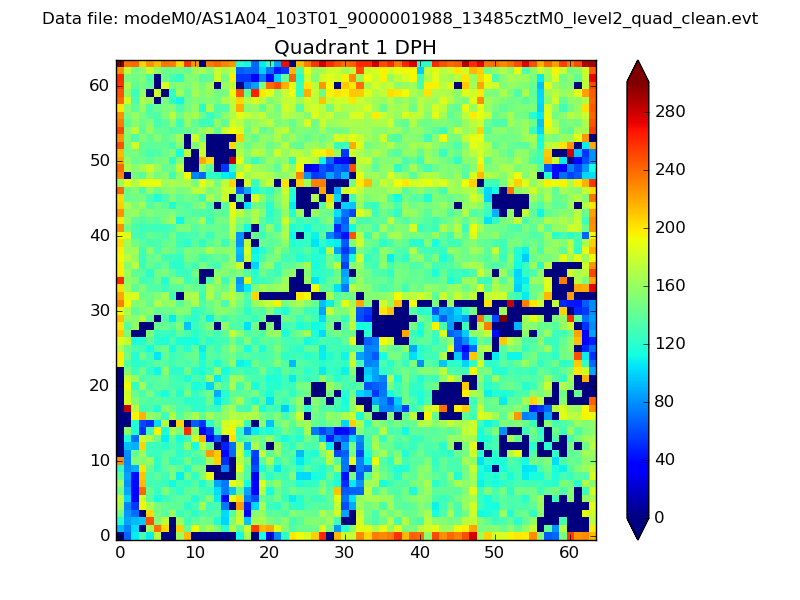 |
Quadrant B |
|---|---|---|---|
| Quadrant D |  |
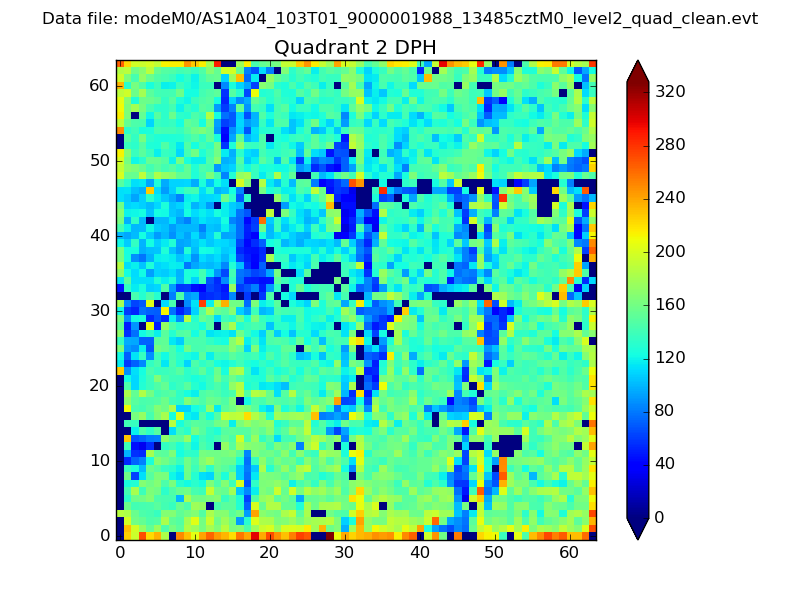 |
Quadrant C |
| Plot type | Count rate plots | Images |
|---|---|---|
| Comparison with Poisson distribution Blue bars denote a histogram of data divided into 1 sec bins. Red curve is a Poisson curve with rate = median count rate of data. |
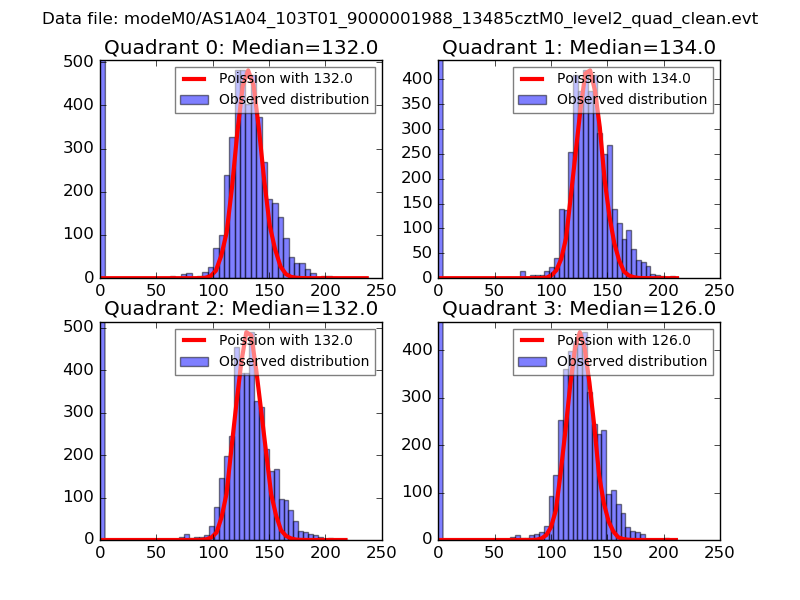 |
 |
| Quadrant-wise count rates Data is divided into 100 sec bins |
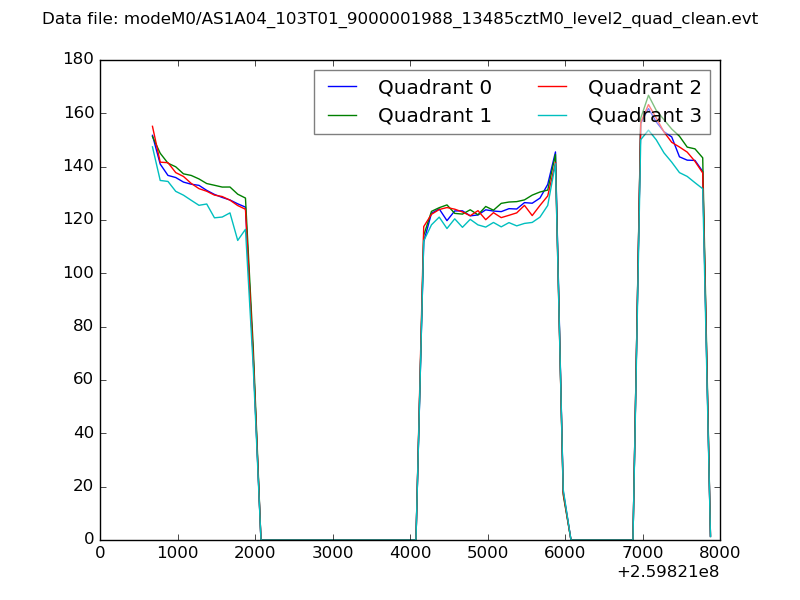 |
|
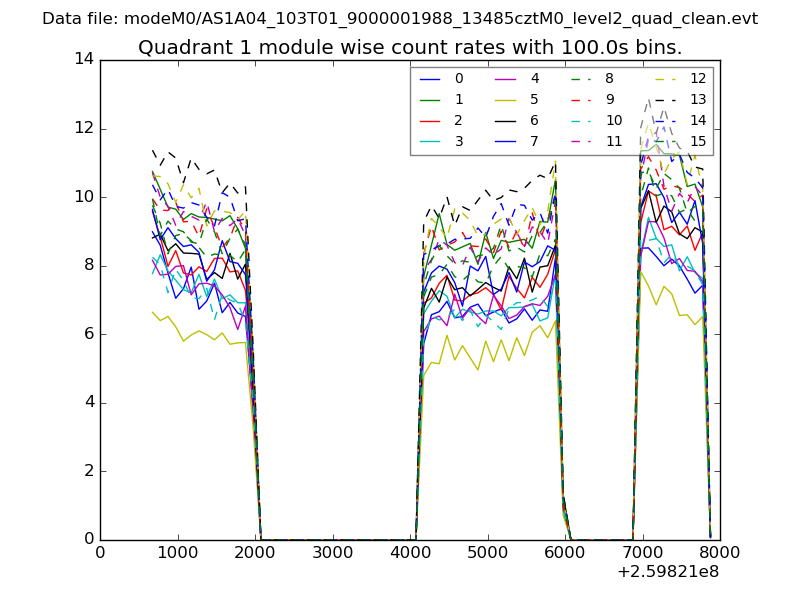
| Module-wise count rates for Quadrant A Data is divided into 100 sec bins |
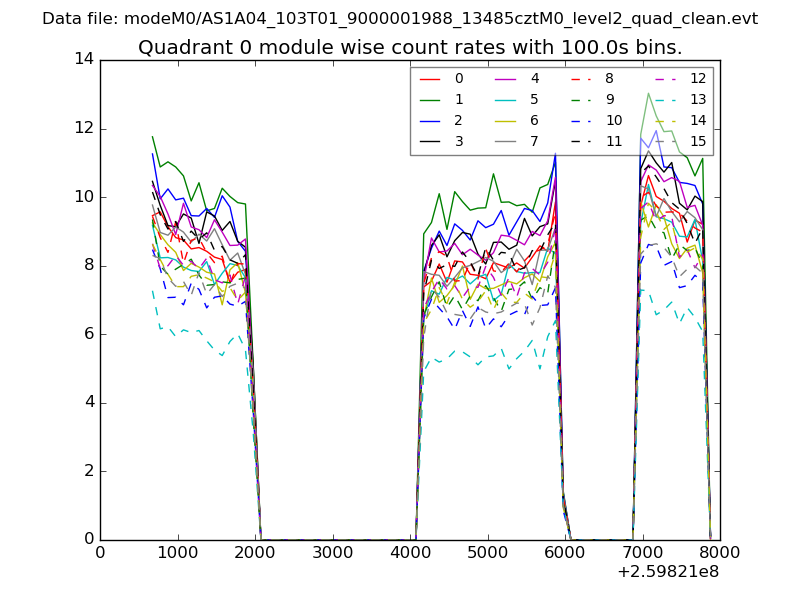 |
 |
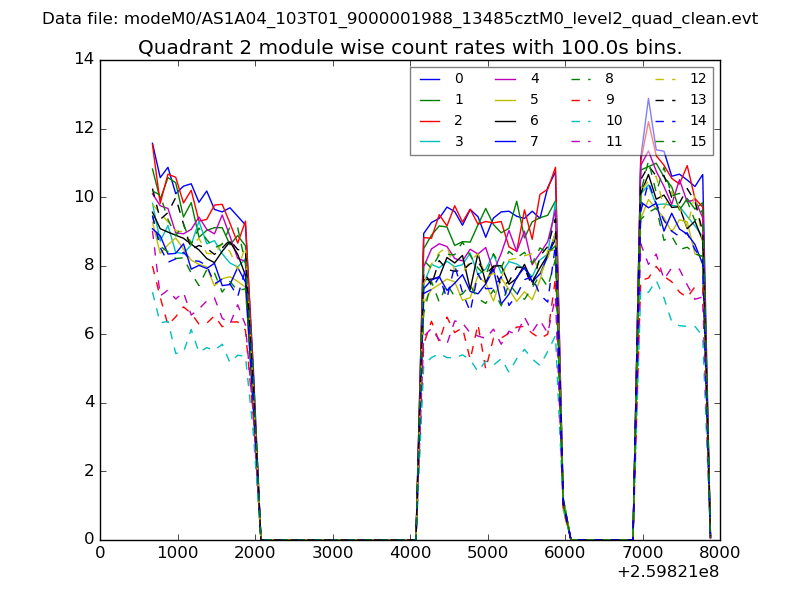
| Module-wise count rates for Quadrant B Data is divided into 100 sec bins |
 |
 |
| Module-wise count rates for Quadrant C Data is divided into 100 sec bins |
 |
 |
| Module-wise count rates for Quadrant D Data is divided into 100 sec bins |
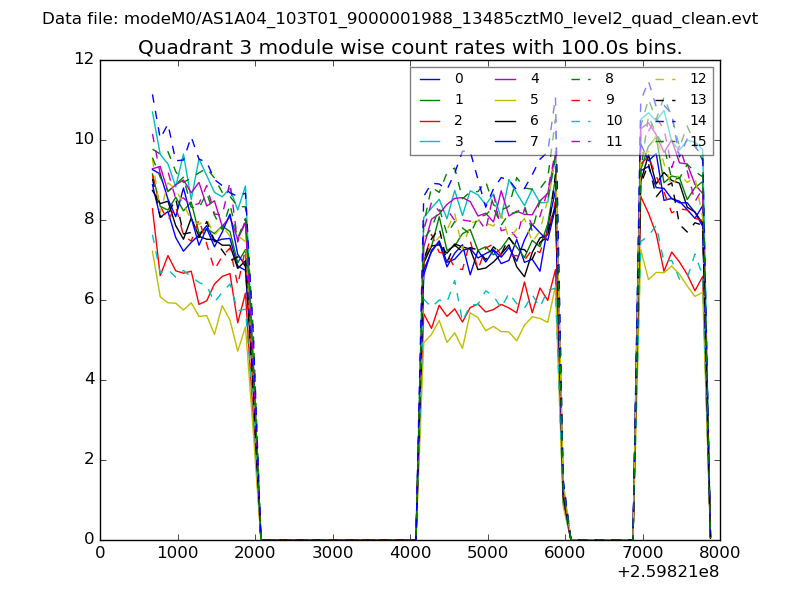 |
 |
| Parameter | Plot |
|---|---|
| CZT HV Monitor | 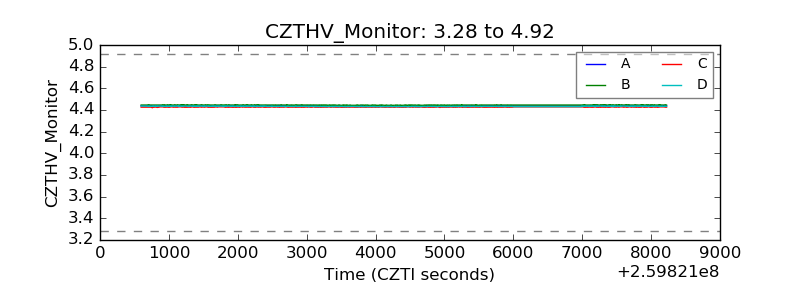 |
| D_VDD | 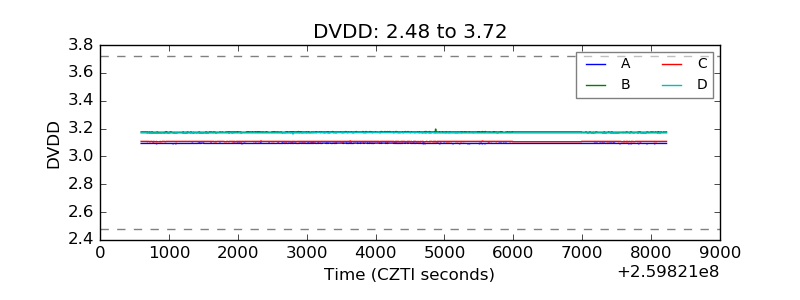 |
| Temperature 1 | 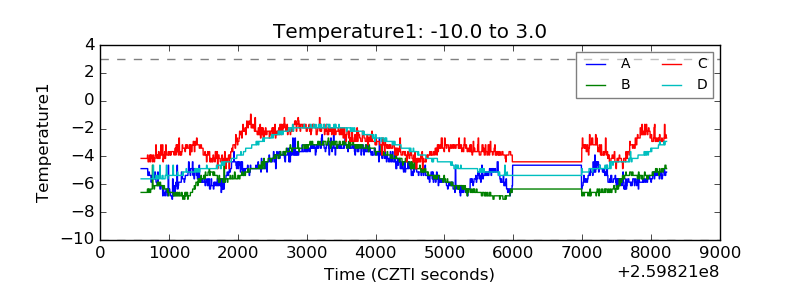 |
| Veto HV Monitor | 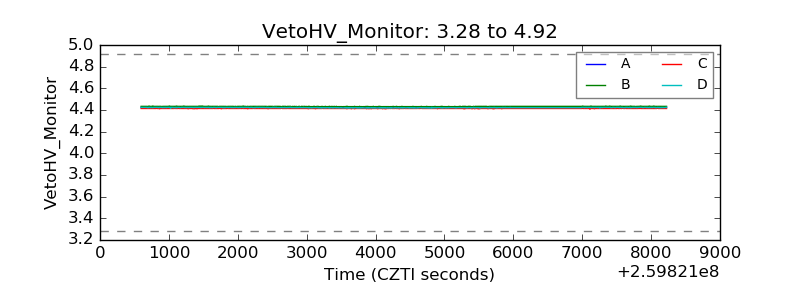 |
| Veto LLD | 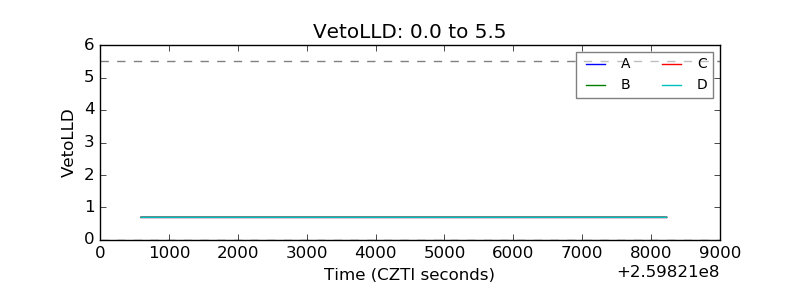 |
| Alpha Counter | 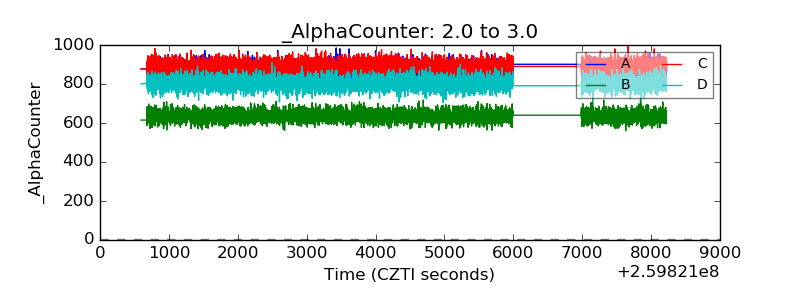 |
| _CPM_Rate | 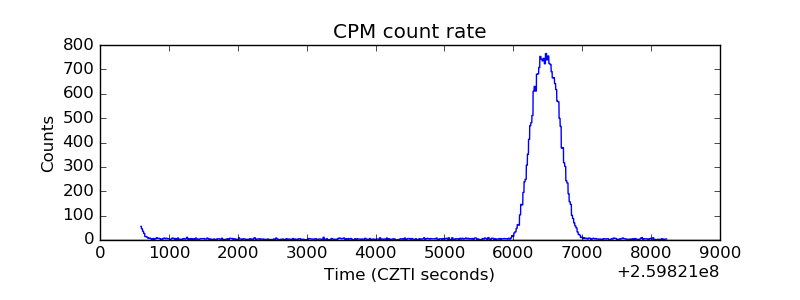 |
| CZT Counter | 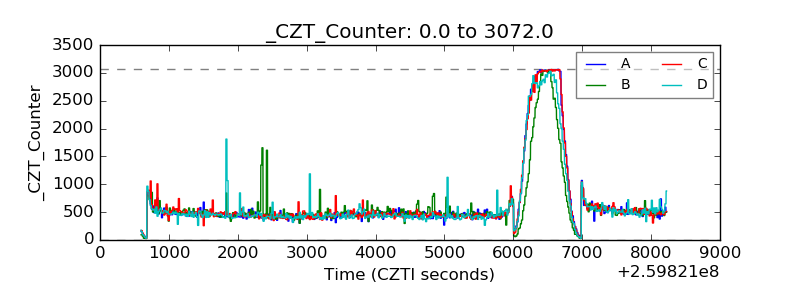 |
| +2.5 Volts monitor | 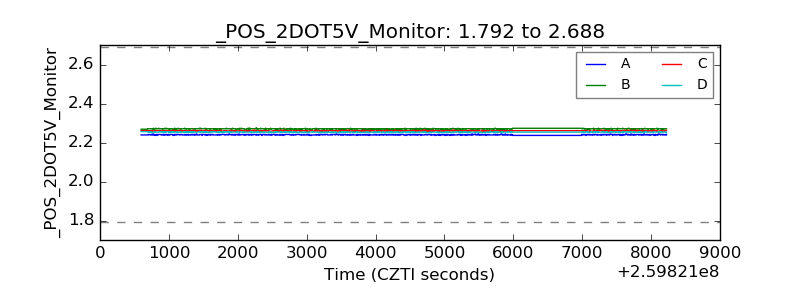 |
| +5 Volts monitor |  |
| _ROLL_ROT | 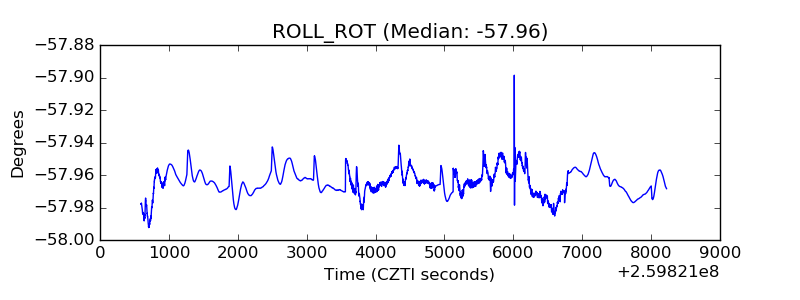 |
| _Roll_DEC | 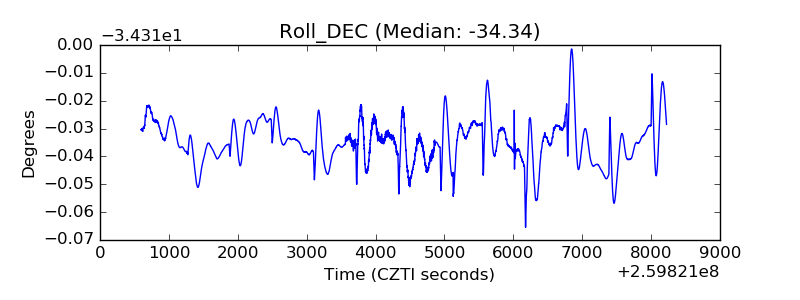 |
| _Roll_RA | 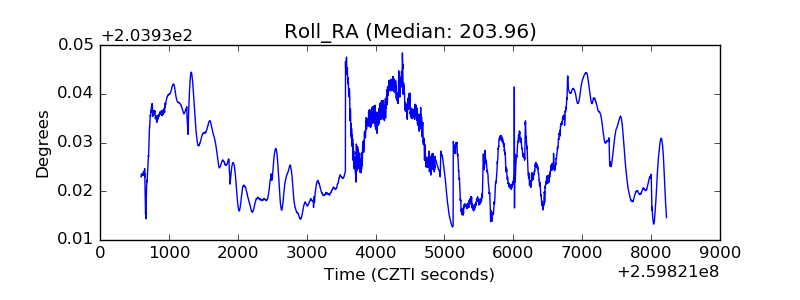 |
| Veto Counter | 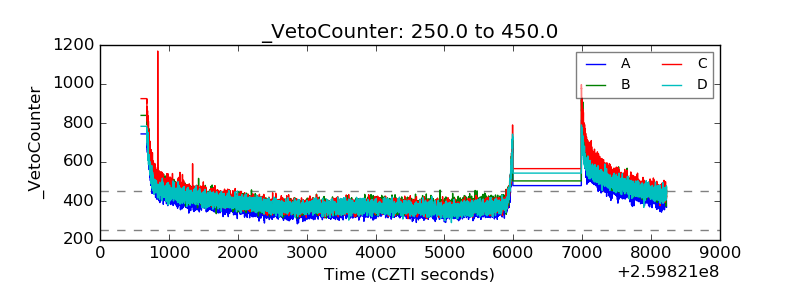 |