| Param | Original file | Final file |
|---|---|---|
| Filename | modeM0/AS1A04_103T01_9000001988_13488cztM0_level2.evt | modeM0/AS1A04_103T01_9000001988_13488cztM0_level2_quad_clean.evt |
| Size (bytes) | 471,594,240 | 67,939,200 |
| Size | 449.7 MB | 64.8 MB |
| Events in quadrant A | 3,226,489 | 407,564 |
| Events in quadrant B | 3,341,352 | 415,884 |
| Events in quadrant C | 3,253,832 | 408,292 |
| Events in quadrant D | 4,031,236 | 383,867 |
| Mode M0 | |||
|---|---|---|---|
| Quadrant | BADHDUFLAG | Total packets | Discarded packets |
| A | 0 | 13566 | 3 |
| B | 0 | 13907 | 2 |
| C | 0 | 13677 | 2 |
| D | 0 | 16081 | 2 |
| Mode SS | |||
|---|---|---|---|
| Quadrant | BADHDUFLAG | Total packets | Discarded packets |
| A | 0 | 130 | 0 |
| B | 0 | 130 | 0 |
| C | 0 | 130 | 0 |
| D | 0 | 130 | 0 |
| Mode M9 | |||
|---|---|---|---|
| Quadrant | BADHDUFLAG | Total packets | Discarded packets |
| A | 0 | 16 | 0 |
| B | 0 | 16 | 0 |
| C | 0 | 16 | 0 |
| D | 0 | 17 | 0 |
| Quadrant | Total seconds | Saturated seconds | Saturation percentage |
|---|---|---|---|
| A | 6319 | 65 | 1.028644% |
| B | 6319 | 74 | 1.171071% |
| C | 6319 | 48 | 0.759614% |
| D | 6319 | 91 | 1.440101% |
Noise dominated data is calculated using 1-second bins in cleaned event files. If a bin has >2000 counts, and if more than 50% of those come from <1% of pixels, then it is considered to be noise-dominated and hence unusable.
| Quadrant | # 1 sec bins | Bins with >0 counts | Bins with >2000 counts | High rate bins dominated by noise | Noise dominated (total time) | Noise dominated (detector-on time) | Marked lightcurve |
|---|---|---|---|---|---|---|---|
| A | 7545 | 6320 | 0 | 0 | 0.00% | 0.00% |  |
| B | 7545 | 6320 | 3 | 3 | 0.04% | 0.05% | 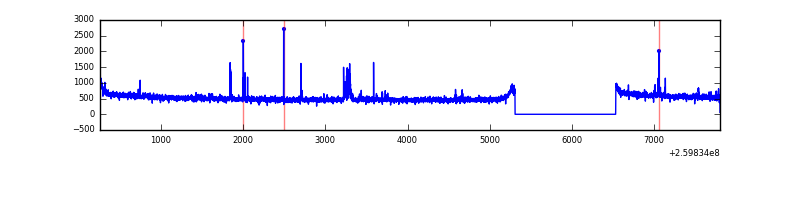 |
| C | 7545 | 6320 | 0 | 0 | 0.00% | 0.00% | 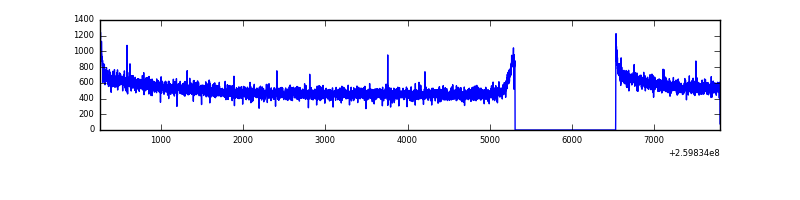 |
| D | 7545 | 6320 | 32 | 32 | 0.42% | 0.51% | 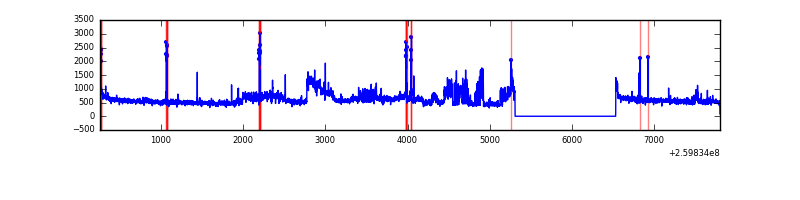 |
Top three noisy pixels from each quadrant. If the there are fewer than three noisy pixels in the level2.evt file, extra rows are filled as -1
| Pixel properties | Quadrant properties | ||||||
|---|---|---|---|---|---|---|---|
| Quadrant | DetID | PixID | Counts | Sigma | Mean | Median | Sigma |
| A | 1 | 162 | 19632 | 113.5 | 831 | 814 | 165.8 |
| A | 0 | 226 | 7473 | 40.16 | 831 | 814 | 165.8 |
| A | 1 | 178 | 6820 | 36.22 | 831 | 814 | 165.8 |
| B | 0 | 230 | 58283 | 372.27 | 827 | 806 | 154.4 |
| B | 3 | 64 | 24618 | 154.23 | 827 | 806 | 154.4 |
| B | 0 | 214 | 20091 | 124.91 | 827 | 806 | 154.4 |
| C | 3 | 233 | 79842 | 426.06 | 813 | 816 | 185.5 |
| C | 13 | 61 | 5876 | 27.28 | 813 | 816 | 185.5 |
| C | 0 | 207 | 3544 | 14.71 | 813 | 816 | 185.5 |
| D | 13 | 122 | 817913 | 4275.49 | 802 | 781 | 191.1 |
| D | 8 | 195 | 55684 | 287.27 | 802 | 781 | 191.1 |
| D | 9 | 85 | 42659 | 219.12 | 802 | 781 | 191.1 |
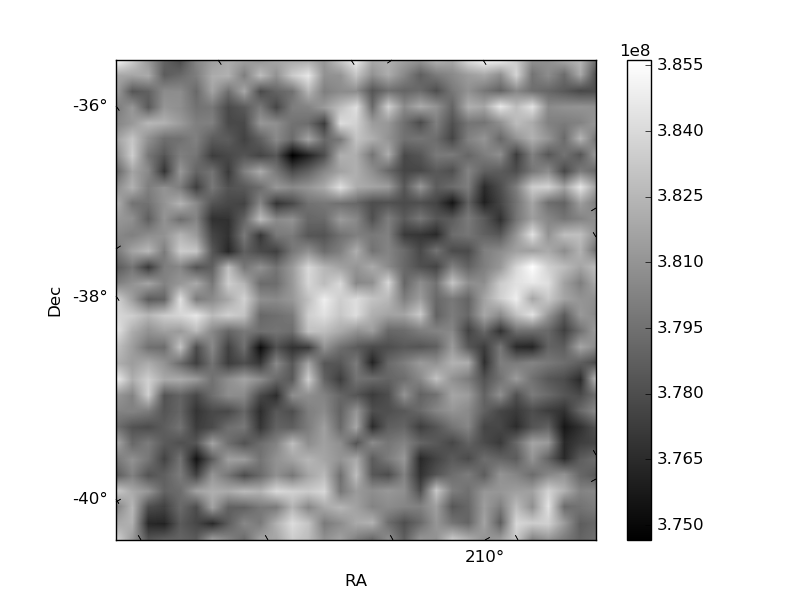
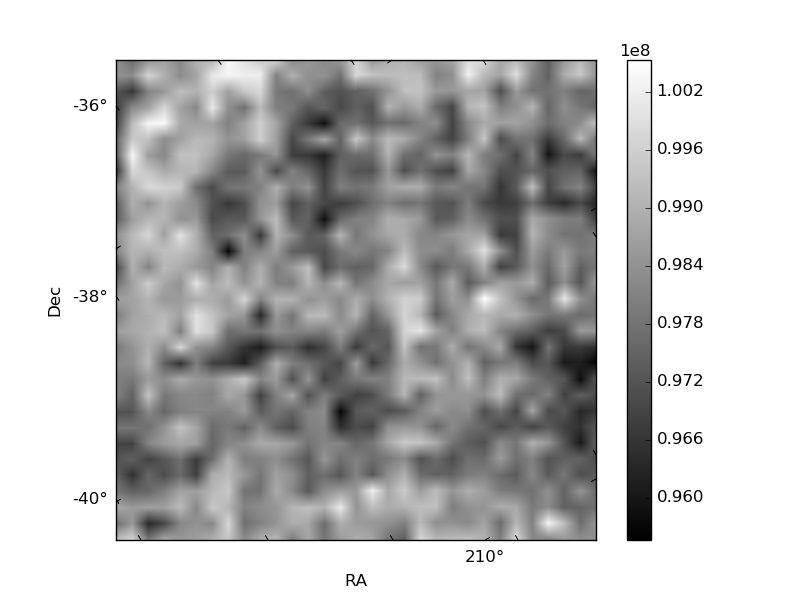
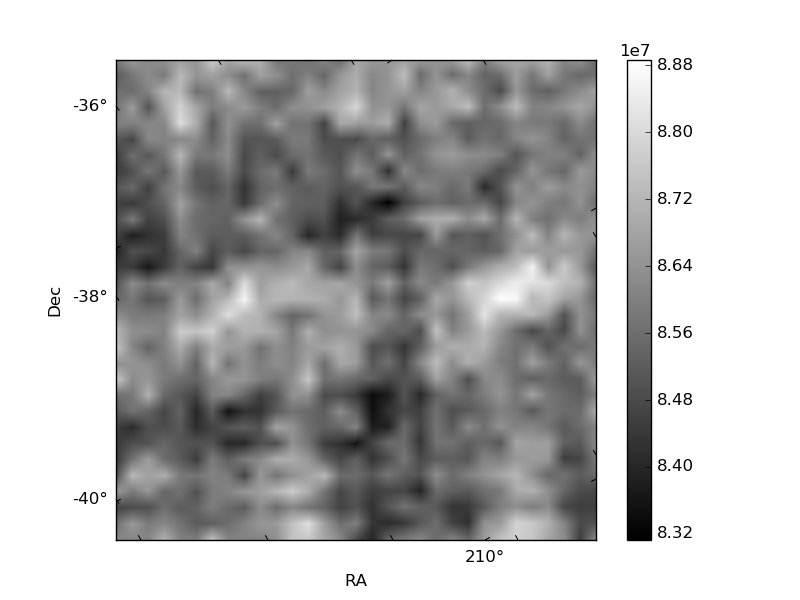
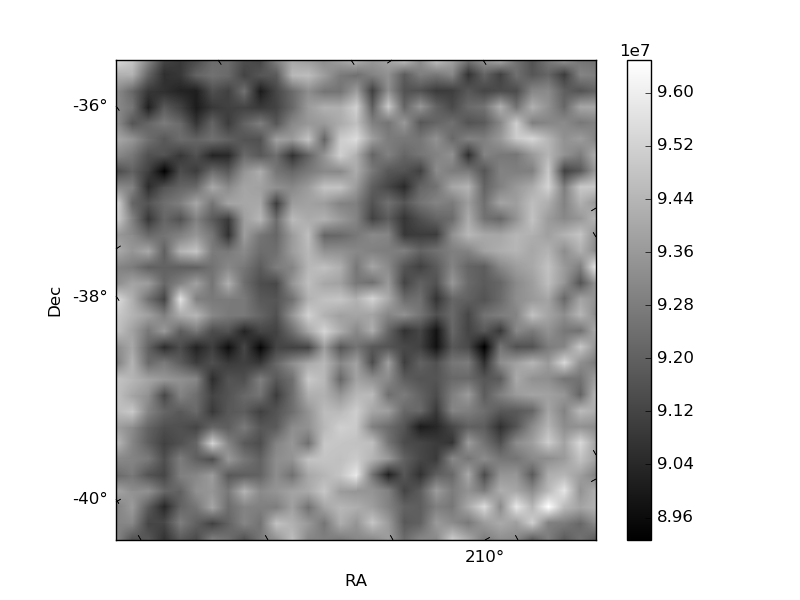
Histogram calculated using DETX and DETY for each event in the final _common_clean file
| Quadrant A |  |
 |
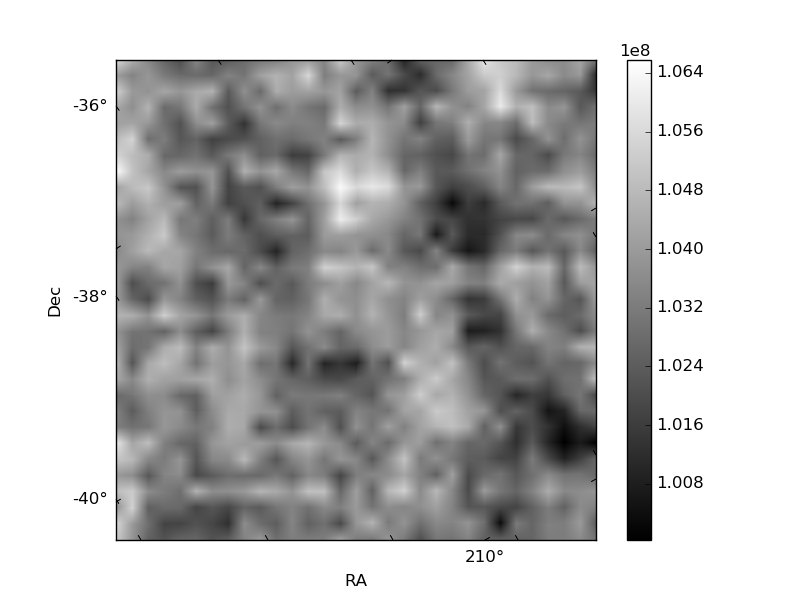
Quadrant B |
|---|---|---|---|
| Quadrant D | 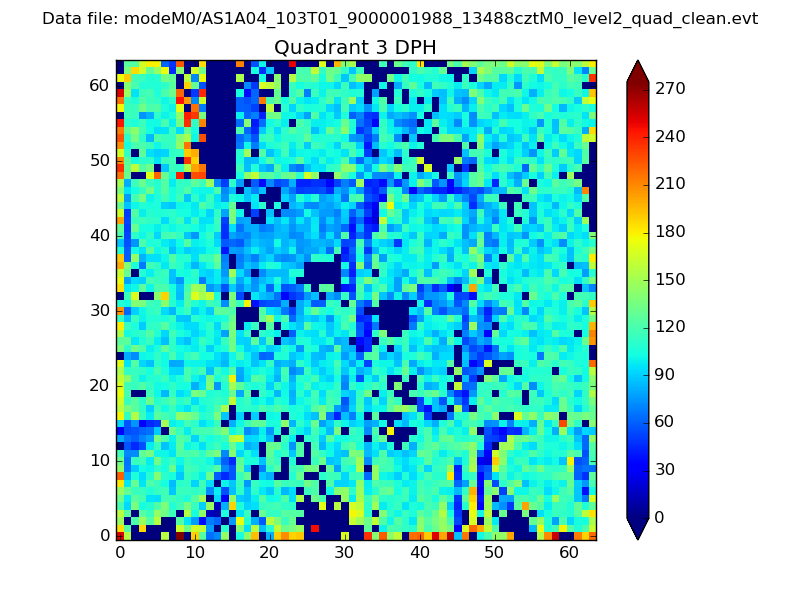 |
 |
Quadrant C |
| Plot type | Count rate plots | Images |
|---|---|---|
| Comparison with Poisson distribution Blue bars denote a histogram of data divided into 1 sec bins. Red curve is a Poisson curve with rate = median count rate of data. |
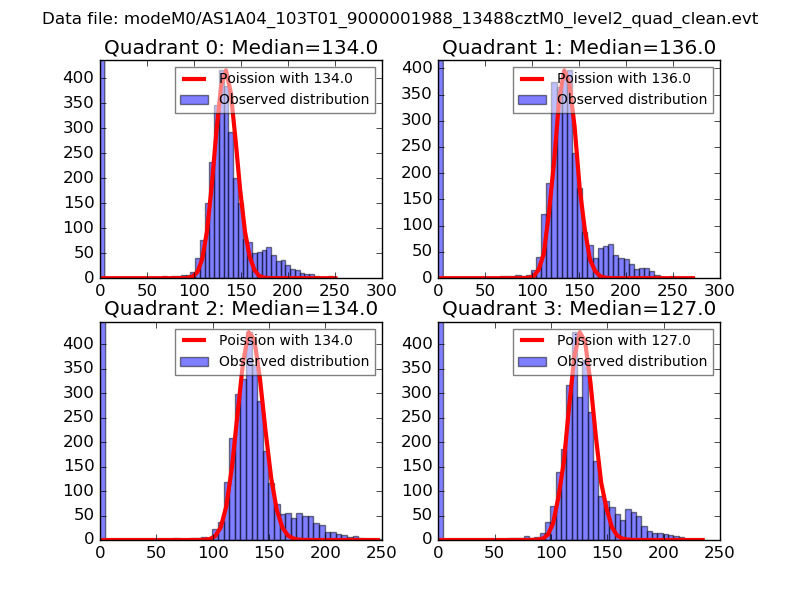 |
 |
| Quadrant-wise count rates Data is divided into 100 sec bins |
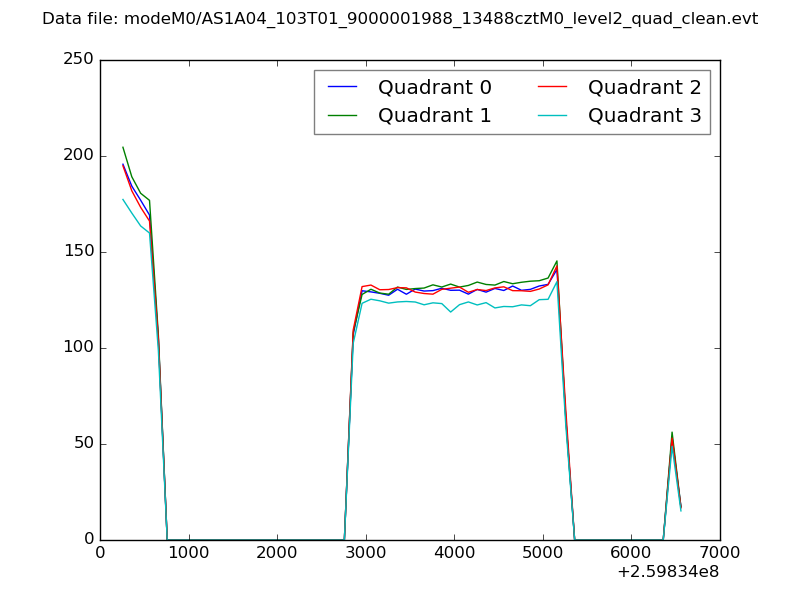 |
|
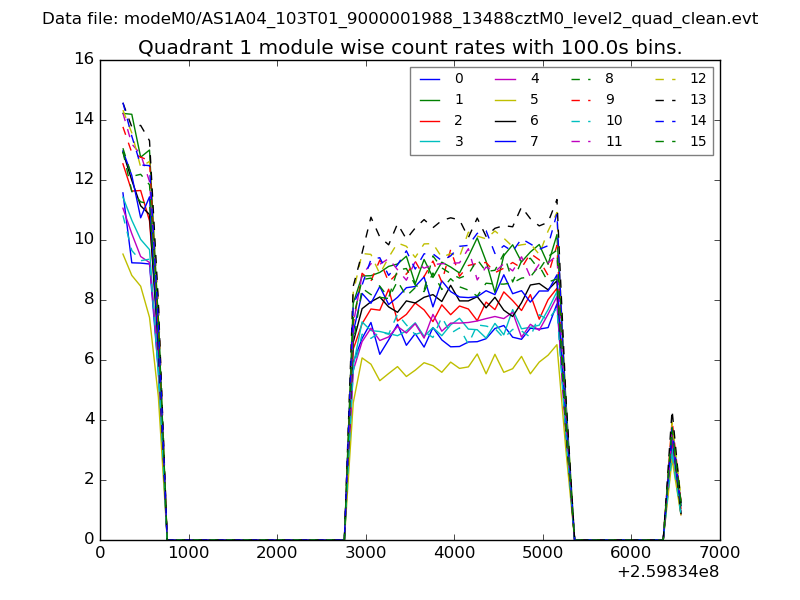
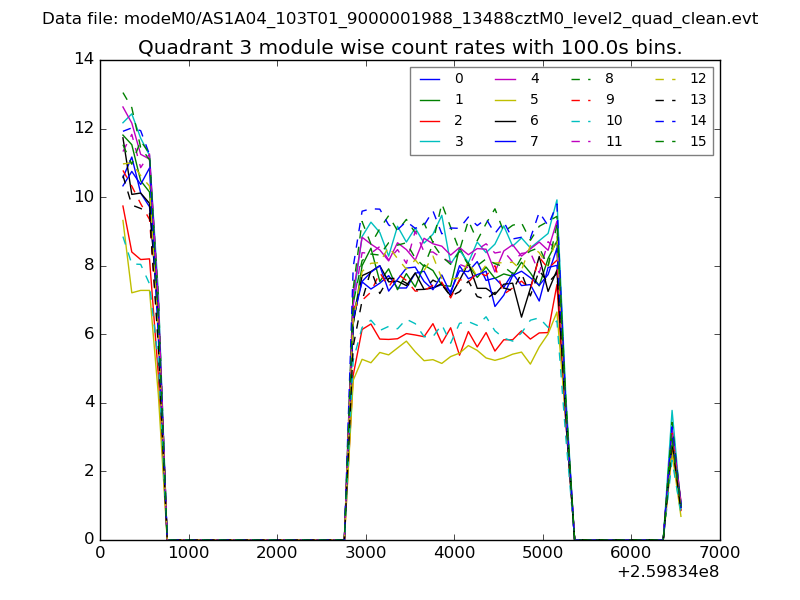
| Module-wise count rates for Quadrant A Data is divided into 100 sec bins |
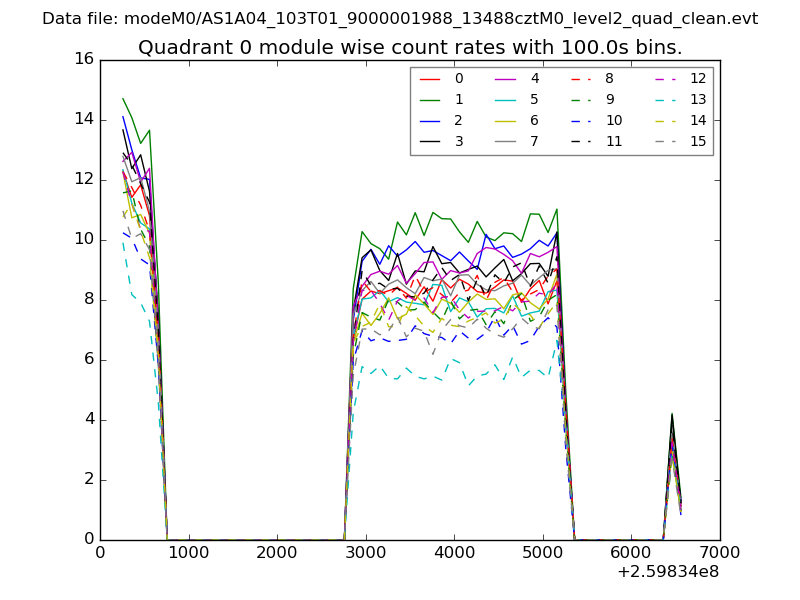 |
 |
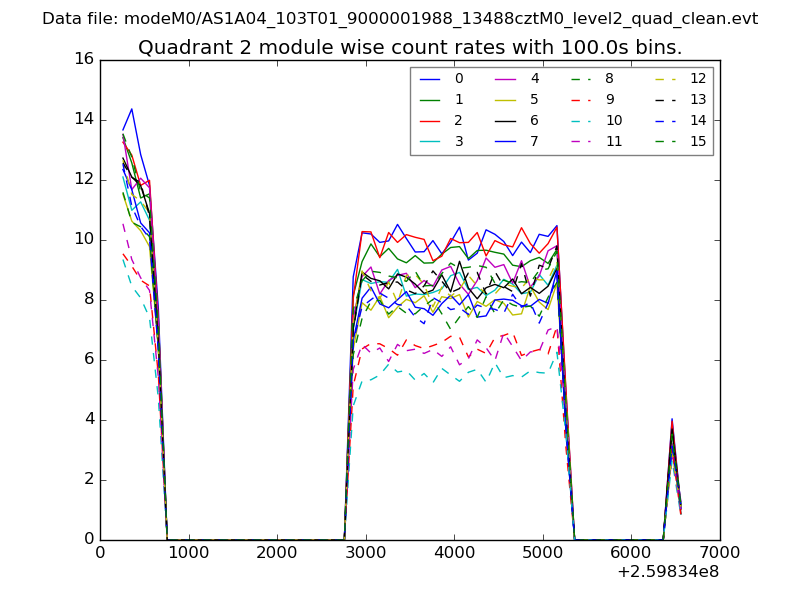
| Module-wise count rates for Quadrant B Data is divided into 100 sec bins |
 |
 |
| Module-wise count rates for Quadrant C Data is divided into 100 sec bins |
 |
 |
| Module-wise count rates for Quadrant D Data is divided into 100 sec bins |
 |
 |
| Parameter | Plot |
|---|---|
| CZT HV Monitor | 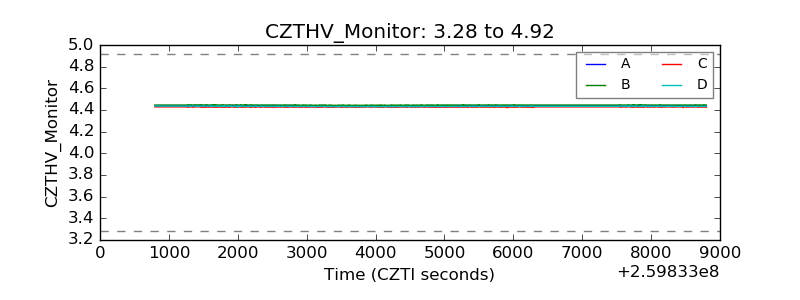 |
| D_VDD | 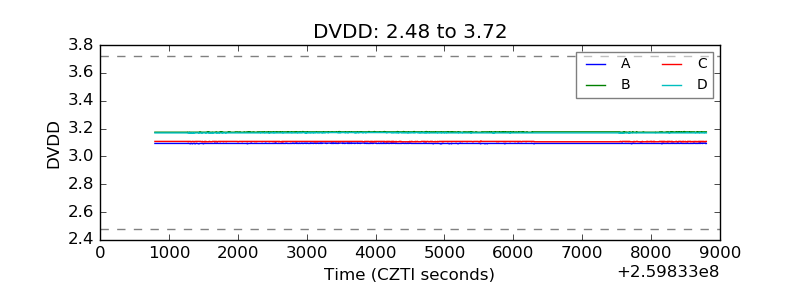 |
| Temperature 1 | 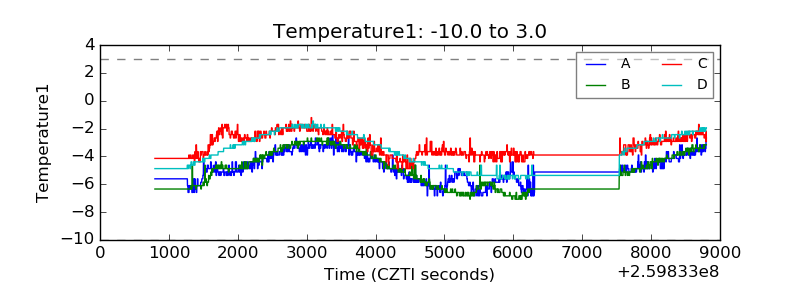 |
| Veto HV Monitor | 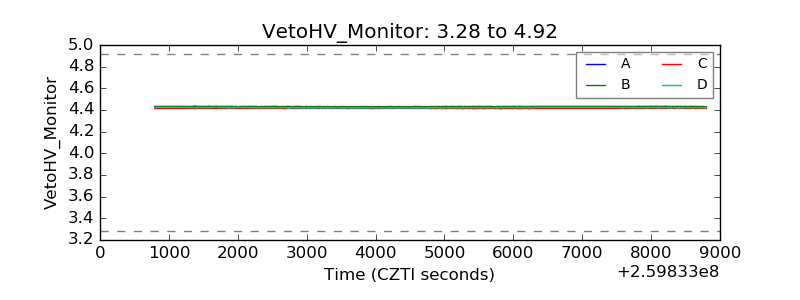 |
| Veto LLD | 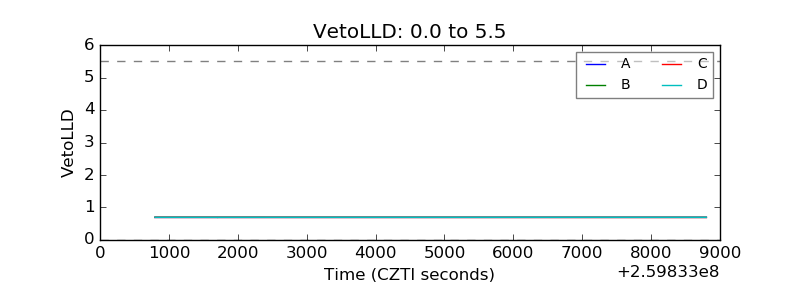 |
| Alpha Counter | 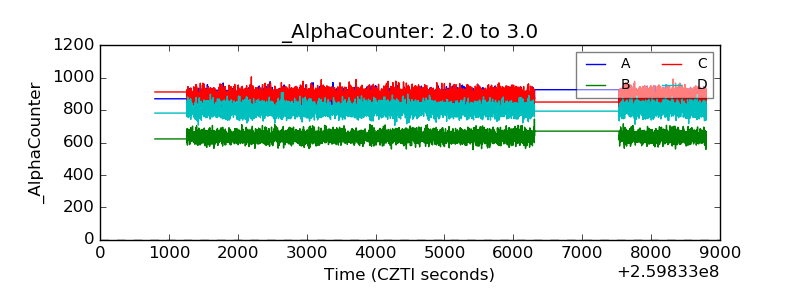 |
| _CPM_Rate | 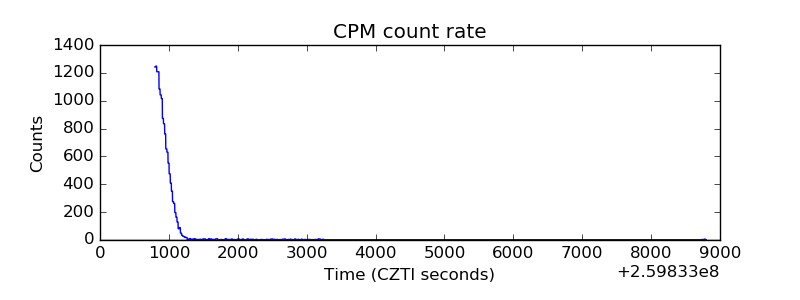 |
| CZT Counter | 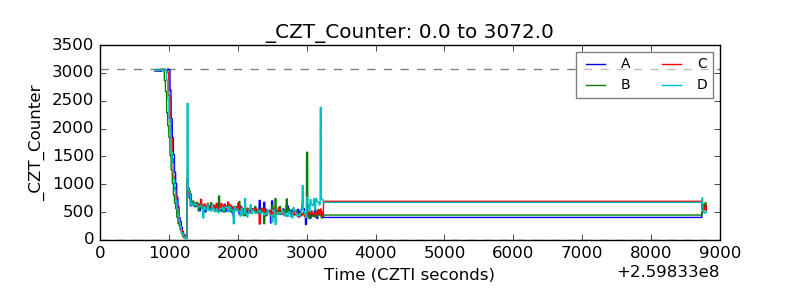 |
| +2.5 Volts monitor | 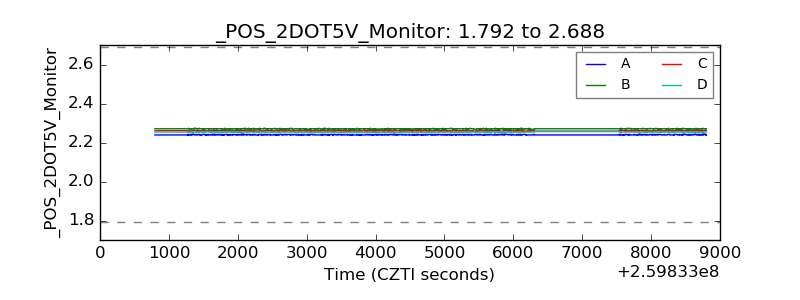 |
| +5 Volts monitor | 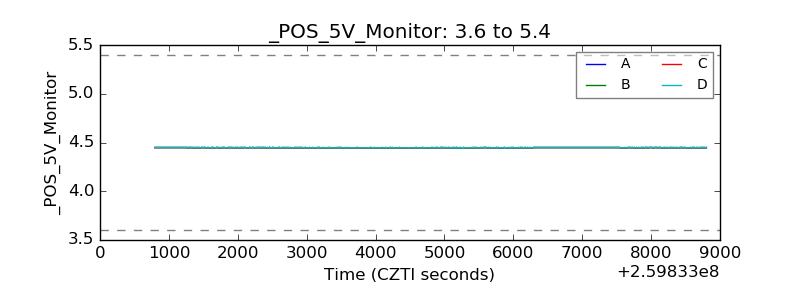 |
| _ROLL_ROT | 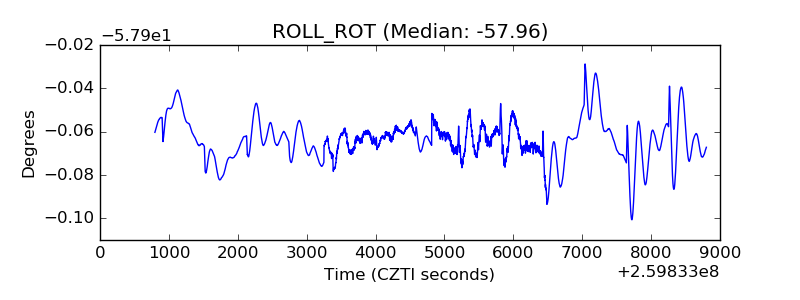 |
| _Roll_DEC | 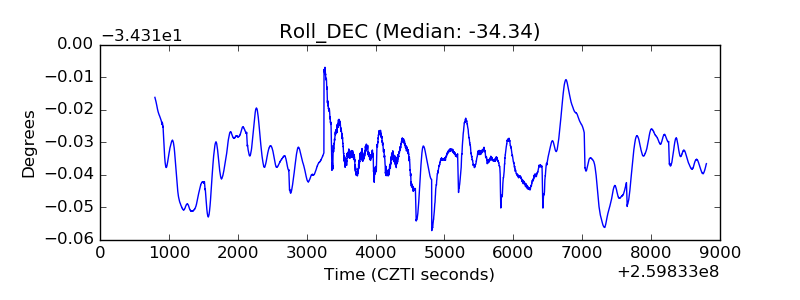 |
| _Roll_RA | 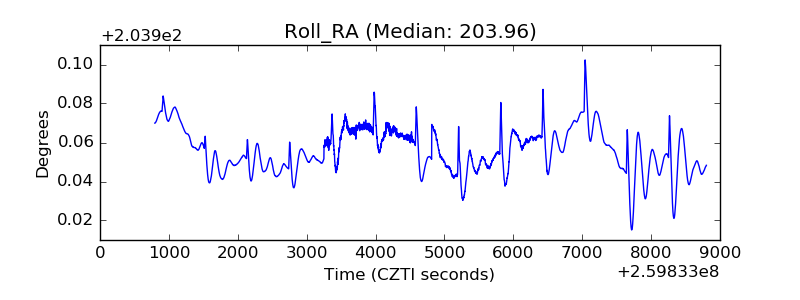 |
| Veto Counter | 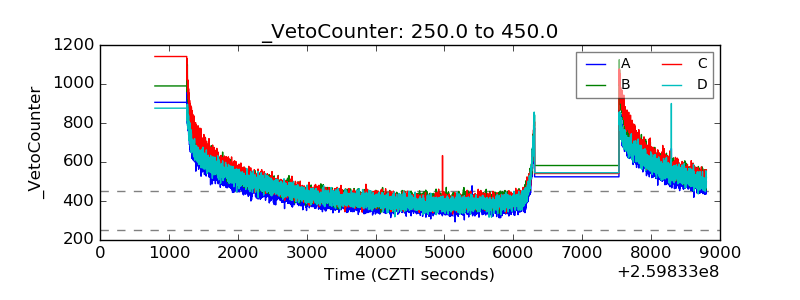 |