| Param | Original file | Final file |
|---|---|---|
| Filename | modeM0/AS1A04_103T01_9000001988_13492cztM0_level2.evt | modeM0/AS1A04_103T01_9000001988_13492cztM0_level2_quad_clean.evt |
| Size (bytes) | 190,552,320 | 34,807,680 |
| Size | 181.7 MB | 33.2 MB |
| Events in quadrant A | 1,384,422 | 217,147 |
| Events in quadrant B | 1,446,996 | 216,012 |
| Events in quadrant C | 1,385,756 | 217,800 |
| Events in quadrant D | 1,362,706 | 204,572 |
| Mode M0 | |||
|---|---|---|---|
| Quadrant | BADHDUFLAG | Total packets | Discarded packets |
| A | 0 | 13530 | 7732 |
| B | 0 | 14496 | 8486 |
| C | 0 | 13442 | 7591 |
| D | 0 | 13844 | 8073 |
| Mode SS | |||
|---|---|---|---|
| Quadrant | BADHDUFLAG | Total packets | Discarded packets |
| A | 0 | 132 | 70 |
| B | 0 | 134 | 78 |
| C | 0 | 132 | 72 |
| D | 0 | 134 | 78 |
| Mode M9 | |||
|---|---|---|---|
| Quadrant | BADHDUFLAG | Total packets | Discarded packets |
| A | 0 | 10 | 0 |
| B | 0 | 11 | 1 |
| C | 0 | 11 | 1 |
| D | 0 | 10 | 0 |
| Quadrant | Total seconds | Saturated seconds | Saturation percentage |
|---|---|---|---|
| A | 2763 | 51 | 1.845820% |
| B | 2711 | 78 | 2.877167% |
| C | 2777 | 34 | 1.224343% |
| D | 2737 | 24 | 0.876872% |
Noise dominated data is calculated using 1-second bins in cleaned event files. If a bin has >2000 counts, and if more than 50% of those come from <1% of pixels, then it is considered to be noise-dominated and hence unusable.
| Quadrant | # 1 sec bins | Bins with >0 counts | Bins with >2000 counts | High rate bins dominated by noise | Noise dominated (total time) | Noise dominated (detector-on time) | Marked lightcurve |
|---|---|---|---|---|---|---|---|
| A | 6591 | 3555 | 0 | 0 | 0.00% | 0.00% | 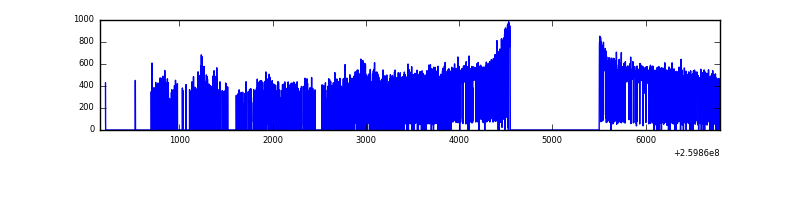 |
| B | 6651 | 3486 | 0 | 0 | 0.00% | 0.00% | 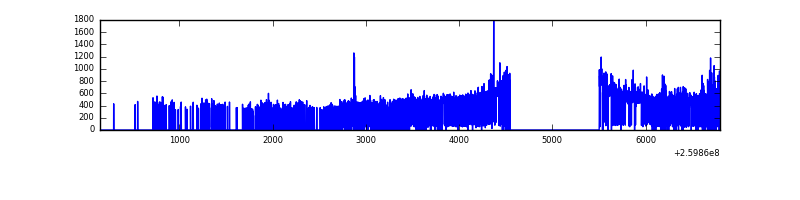 |
| C | 6227 | 3579 | 0 | 0 | 0.00% | 0.00% | 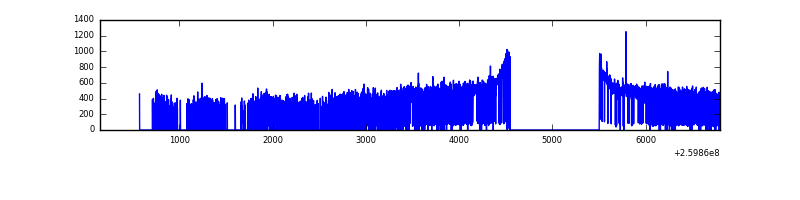 |
| D | 6540 | 3526 | 0 | 0 | 0.00% | 0.00% | 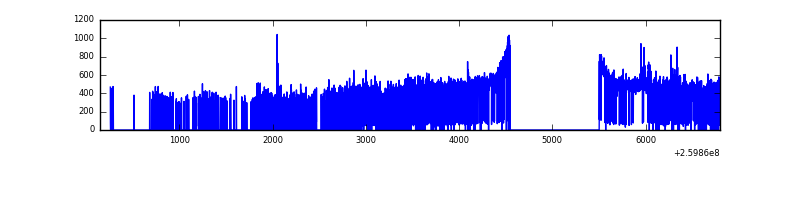 |
Top three noisy pixels from each quadrant. If the there are fewer than three noisy pixels in the level2.evt file, extra rows are filled as -1
| Pixel properties | Quadrant properties | ||||||
|---|---|---|---|---|---|---|---|
| Quadrant | DetID | PixID | Counts | Sigma | Mean | Median | Sigma |
| A | 8 | 15 | 17188 | 230.55 | 352 | 344 | 73.1 |
| A | 1 | 162 | 9725 | 128.4 | 352 | 344 | 73.1 |
| A | 0 | 226 | 3071 | 37.33 | 352 | 344 | 73.1 |
| B | 4 | 173 | 32925 | 484.99 | 346 | 337 | 67.2 |
| B | 3 | 64 | 30230 | 444.88 | 346 | 337 | 67.2 |
| B | 0 | 230 | 12776 | 185.12 | 346 | 337 | 67.2 |
| C | 3 | 233 | 28350 | 343.33 | 347 | 348 | 81.6 |
| C | 0 | 207 | 4421 | 49.94 | 347 | 348 | 81.6 |
| C | 13 | 61 | 2472 | 26.04 | 347 | 348 | 81.6 |
| D | 8 | 195 | 62622 | 761.88 | 337 | 326 | 81.8 |
| D | 2 | 136 | 15331 | 183.51 | 337 | 326 | 81.8 |
| D | 2 | 234 | 10542 | 124.94 | 337 | 326 | 81.8 |
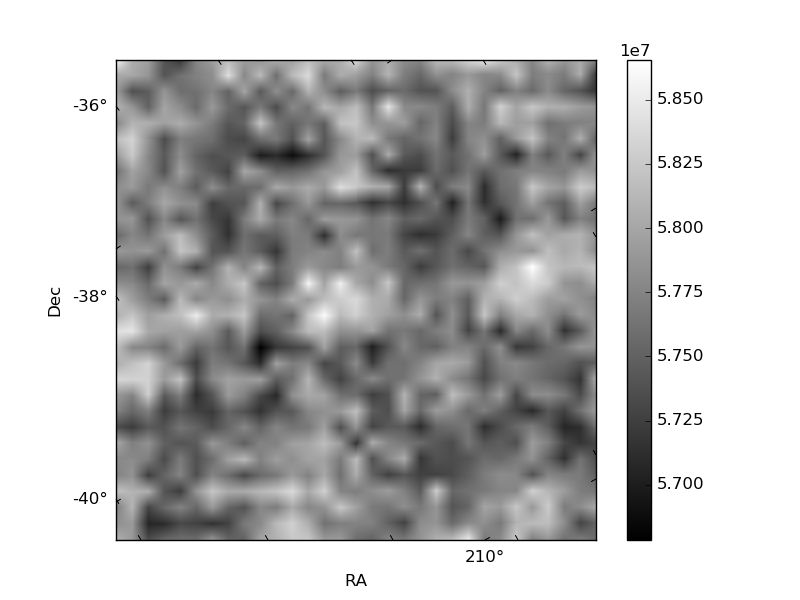
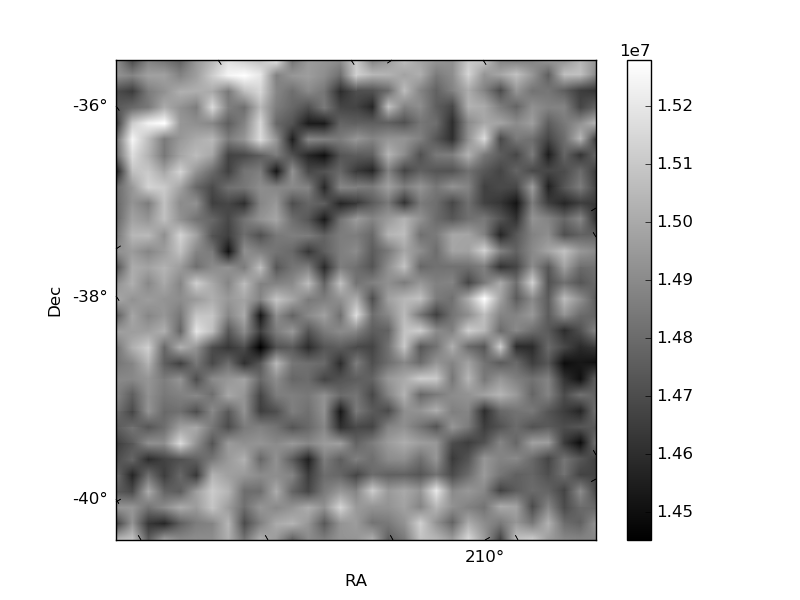
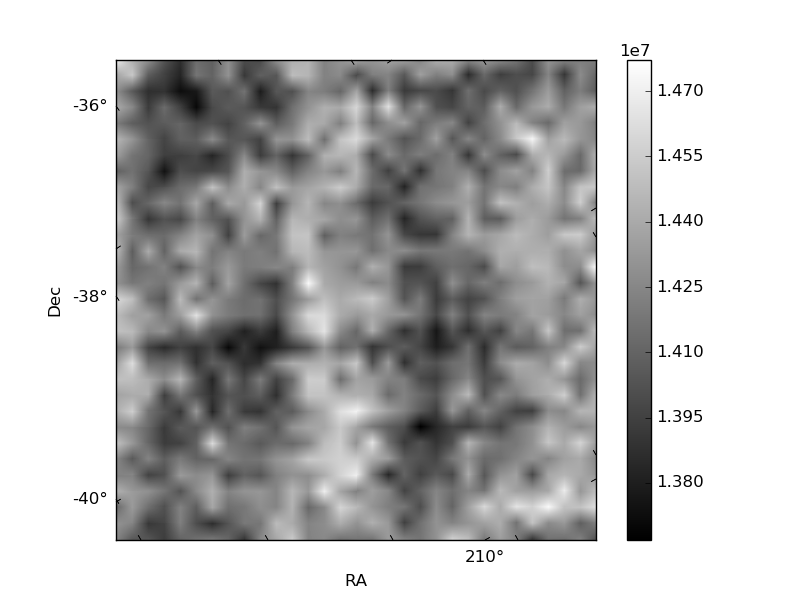
Histogram calculated using DETX and DETY for each event in the final _common_clean file
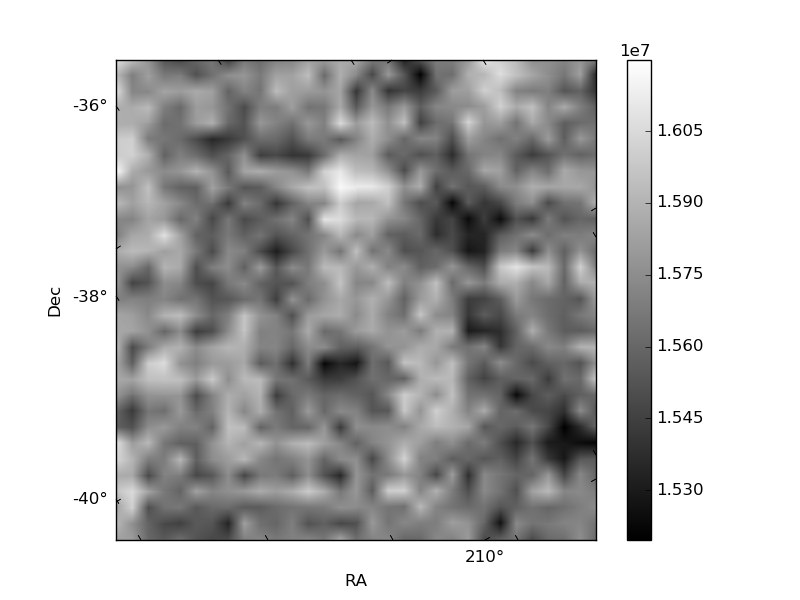
| Quadrant A | 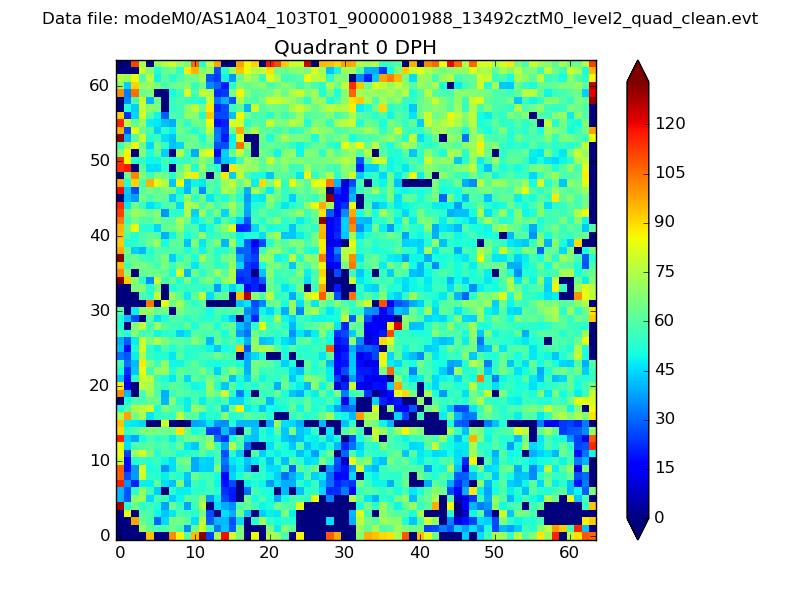 |
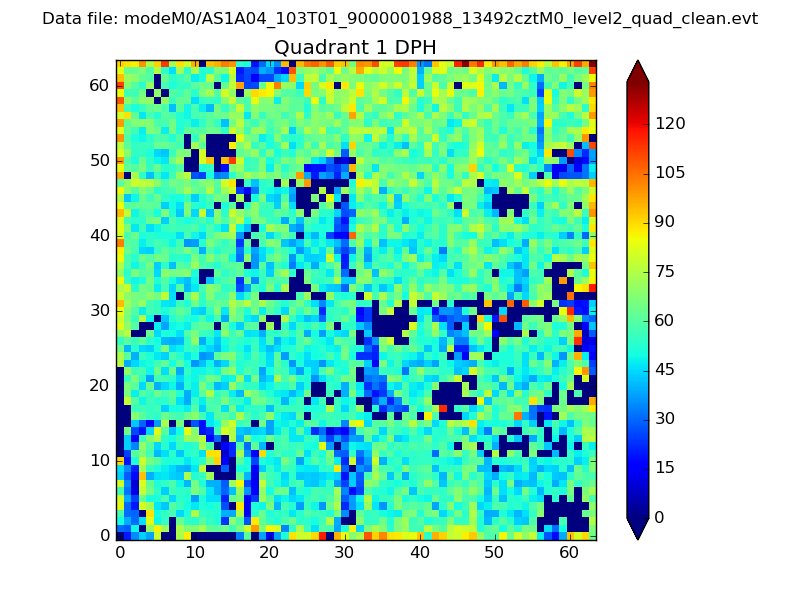 |
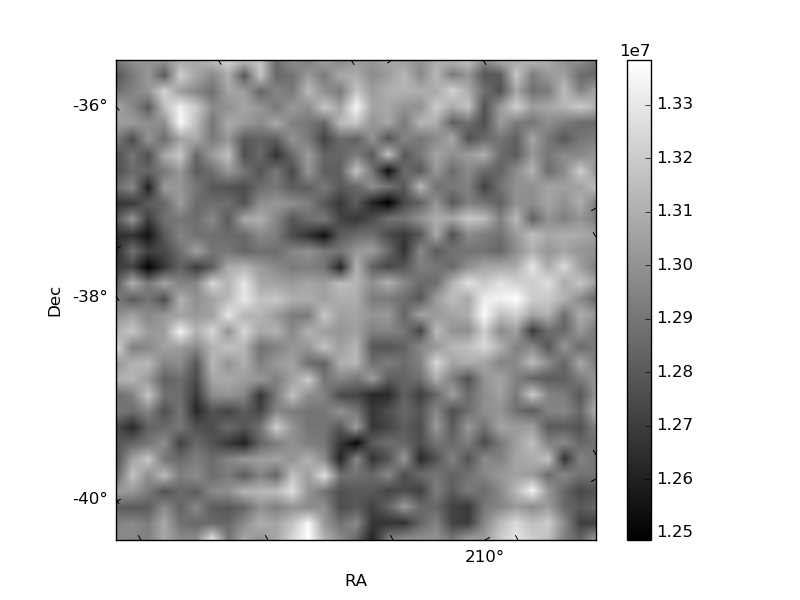
Quadrant B |
|---|---|---|---|
| Quadrant D | 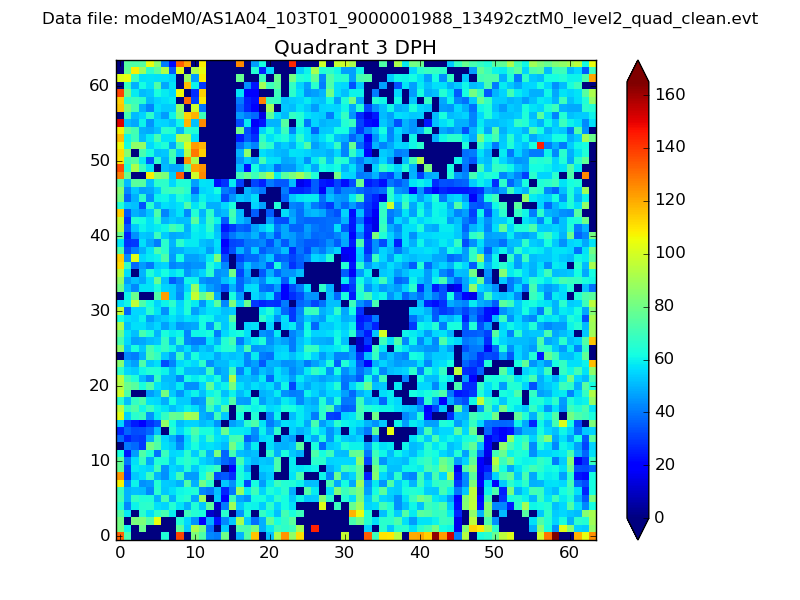 |
 |
Quadrant C |
| Plot type | Count rate plots | Images |
|---|---|---|
| Comparison with Poisson distribution Blue bars denote a histogram of data divided into 1 sec bins. Red curve is a Poisson curve with rate = median count rate of data. |
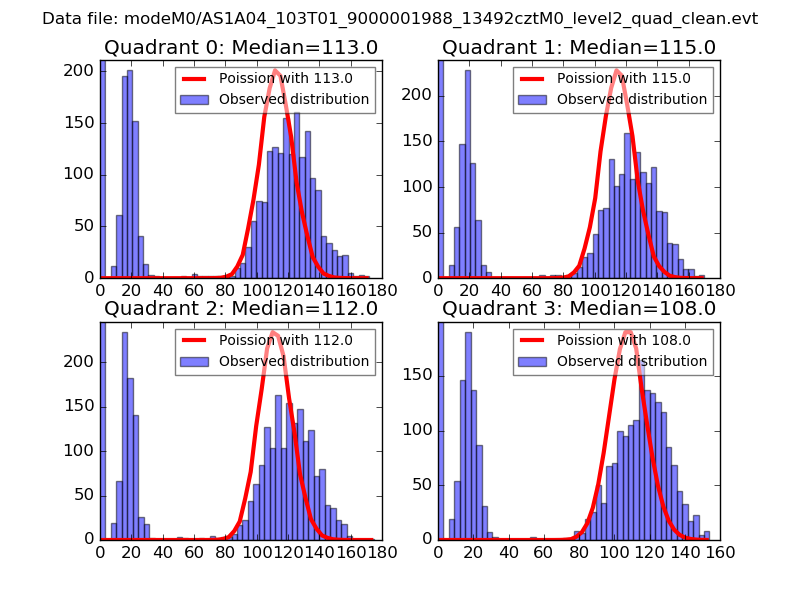 |
 |
| Quadrant-wise count rates Data is divided into 100 sec bins |
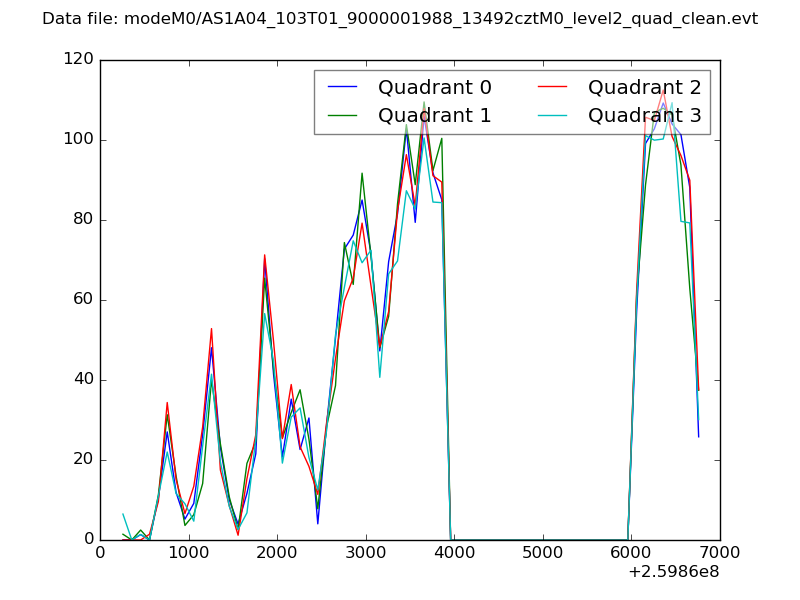 |
|
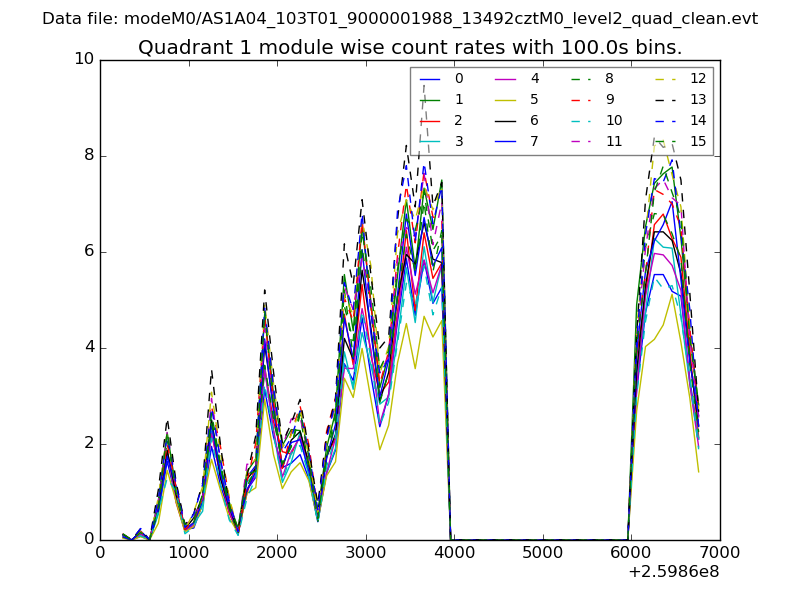
| Module-wise count rates for Quadrant A Data is divided into 100 sec bins |
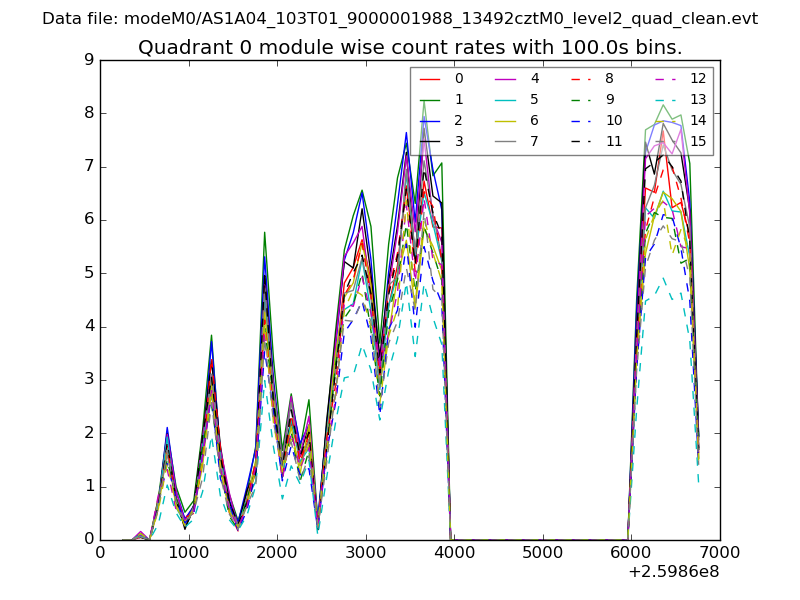 |
 |
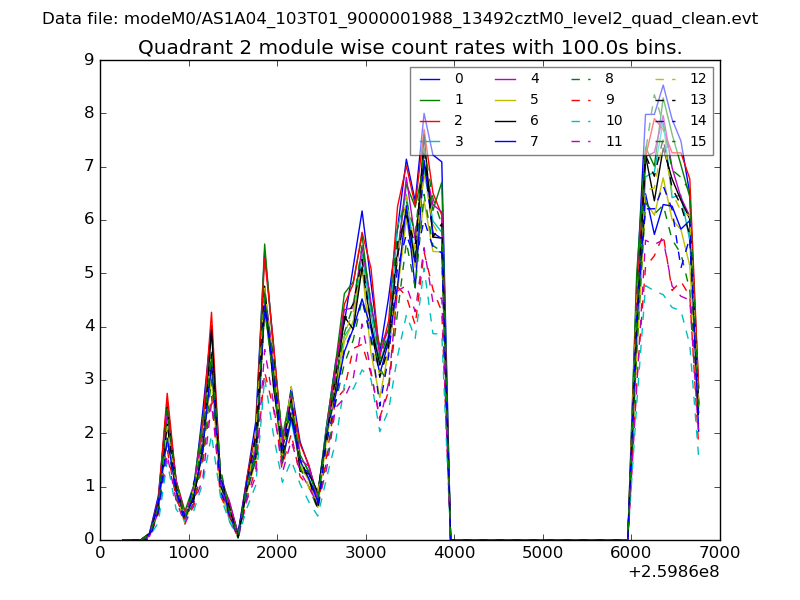
| Module-wise count rates for Quadrant B Data is divided into 100 sec bins |
 |
 |
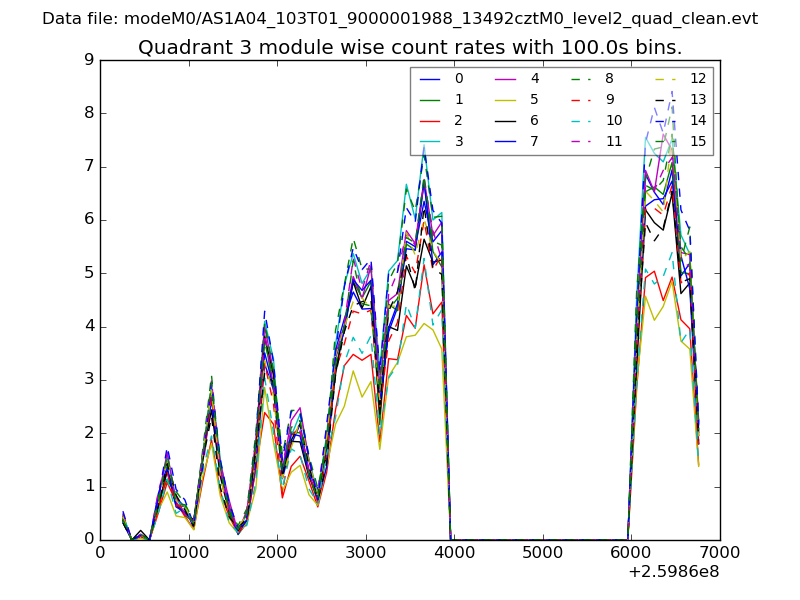
| Module-wise count rates for Quadrant C Data is divided into 100 sec bins |
 |
 |
| Module-wise count rates for Quadrant D Data is divided into 100 sec bins |
 |
 |
| Parameter | Plot |
|---|---|
| CZT HV Monitor | 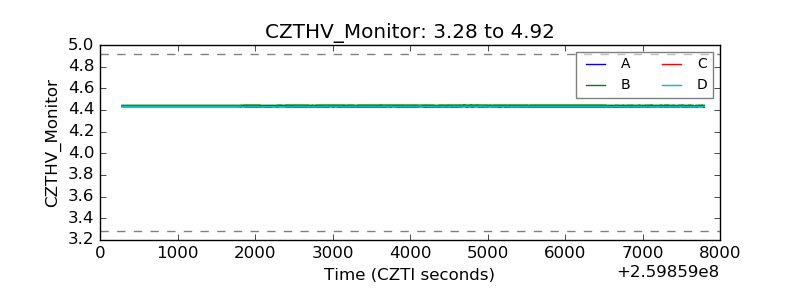 |
| D_VDD | 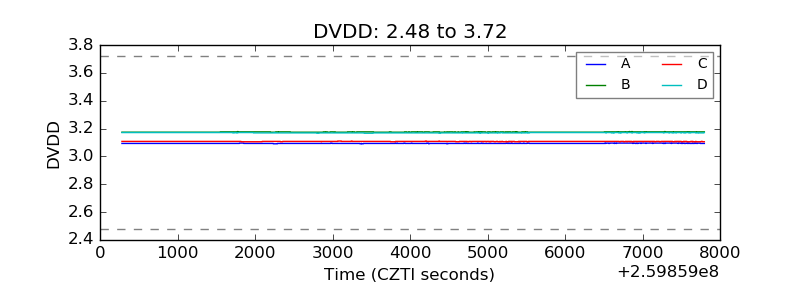 |
| Temperature 1 | 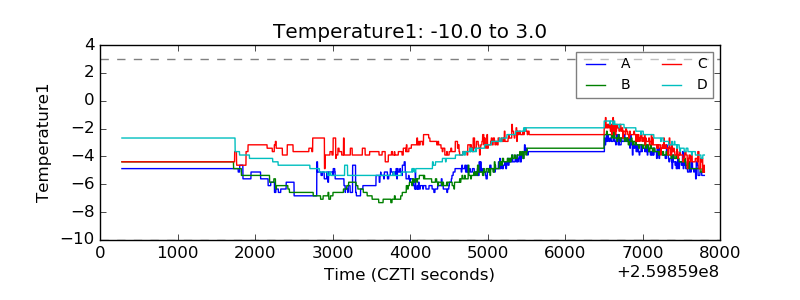 |
| Veto HV Monitor | 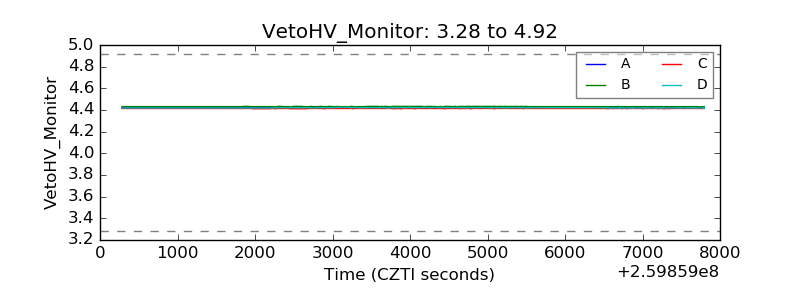 |
| Veto LLD | 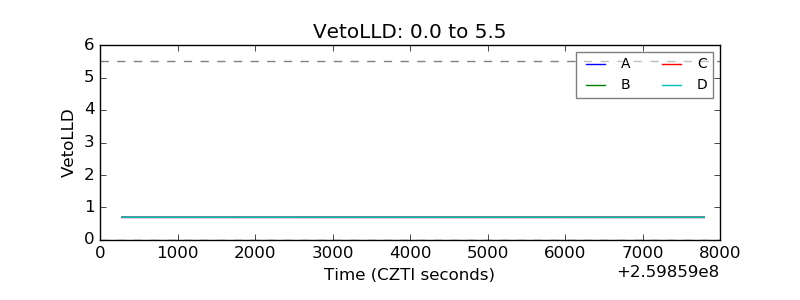 |
| Alpha Counter | 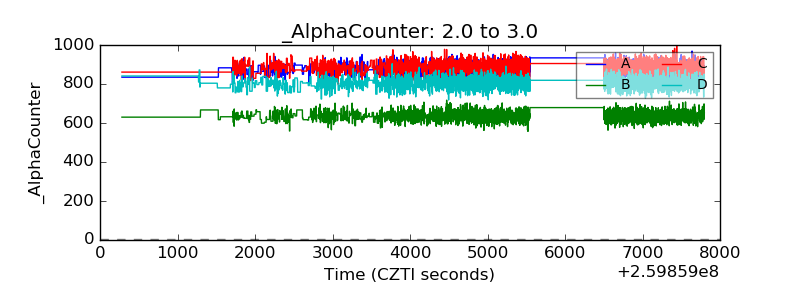 |
| _CPM_Rate | 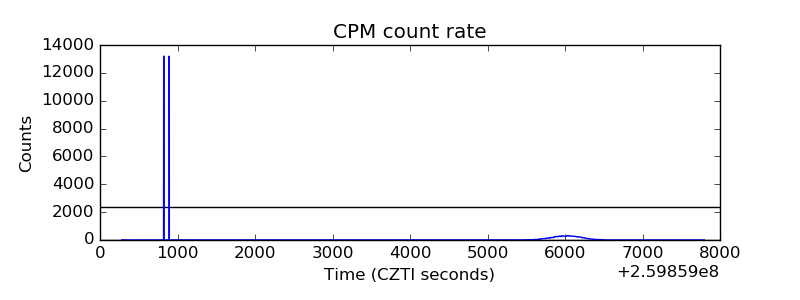 |
| CZT Counter | 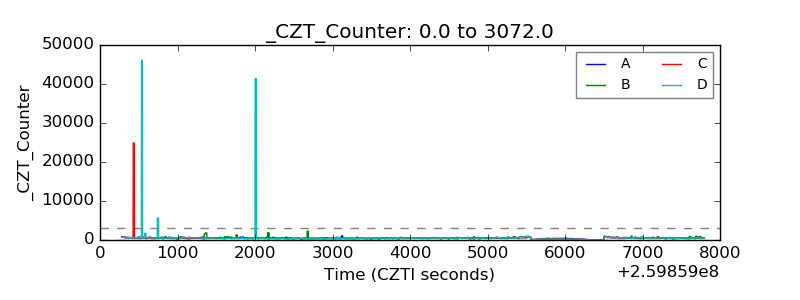 |
| +2.5 Volts monitor |  |
| +5 Volts monitor | 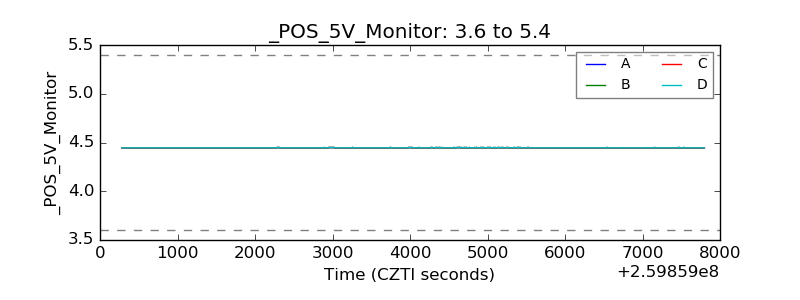 |
| _ROLL_ROT | 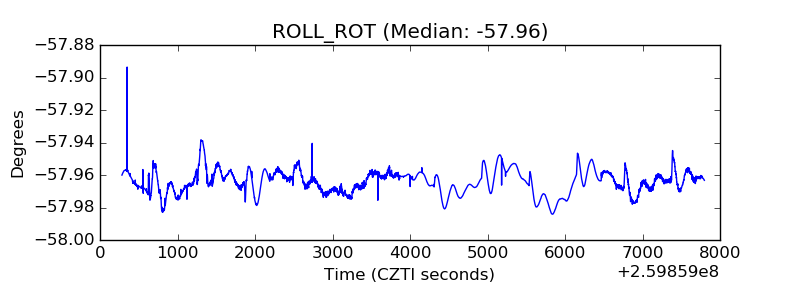 |
| _Roll_DEC | 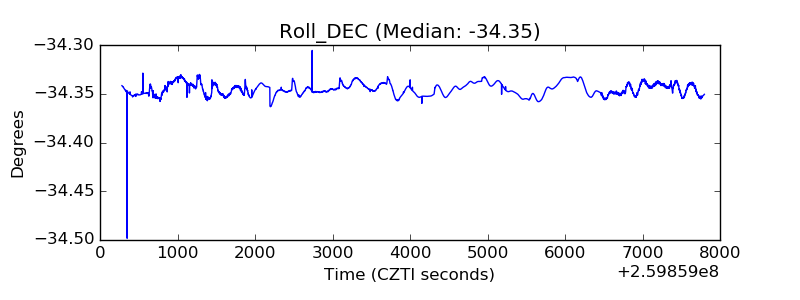 |
| _Roll_RA | 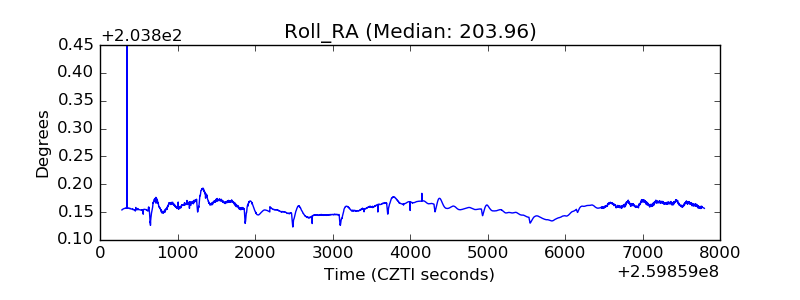 |
| Veto Counter | 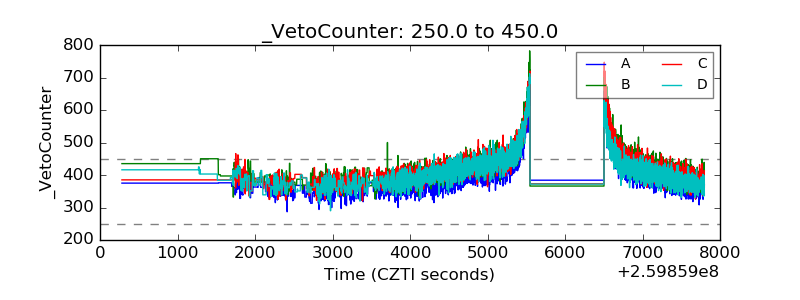 |