| Param | Original file | Final file |
|---|---|---|
| Filename | modeM0/AS1A04_103T01_9000001988_13493cztM0_level2.evt | modeM0/AS1A04_103T01_9000001988_13493cztM0_level2_quad_clean.evt |
| Size (bytes) | 505,681,920 | 101,848,320 |
| Size | 482.3 MB | 97.1 MB |
| Events in quadrant A | 3,542,062 | 646,489 |
| Events in quadrant B | 3,925,251 | 654,875 |
| Events in quadrant C | 3,577,013 | 643,052 |
| Events in quadrant D | 3,757,223 | 614,514 |
| Mode M0 | |||
|---|---|---|---|
| Quadrant | BADHDUFLAG | Total packets | Discarded packets |
| A | 0 | 15683 | 3 |
| B | 0 | 16695 | 2 |
| C | 0 | 15722 | 2 |
| D | 0 | 16247 | 2 |
| Mode SS | |||
|---|---|---|---|
| Quadrant | BADHDUFLAG | Total packets | Discarded packets |
| A | 0 | 154 | 0 |
| B | 0 | 154 | 0 |
| C | 0 | 154 | 0 |
| D | 0 | 154 | 0 |
| Mode M9 | |||
|---|---|---|---|
| Quadrant | BADHDUFLAG | Total packets | Discarded packets |
| A | 0 | 16 | 0 |
| B | 0 | 16 | 0 |
| C | 0 | 16 | 0 |
| D | 0 | 16 | 0 |
| Quadrant | Total seconds | Saturated seconds | Saturation percentage |
|---|---|---|---|
| A | 7557 | 96 | 1.270345% |
| B | 7557 | 176 | 2.328967% |
| C | 7557 | 59 | 0.780733% |
| D | 7557 | 46 | 0.608707% |
Noise dominated data is calculated using 1-second bins in cleaned event files. If a bin has >2000 counts, and if more than 50% of those come from <1% of pixels, then it is considered to be noise-dominated and hence unusable.
| Quadrant | # 1 sec bins | Bins with >0 counts | Bins with >2000 counts | High rate bins dominated by noise | Noise dominated (total time) | Noise dominated (detector-on time) | Marked lightcurve |
|---|---|---|---|---|---|---|---|
| A | 9088 | 7559 | 0 | 0 | 0.00% | 0.00% | 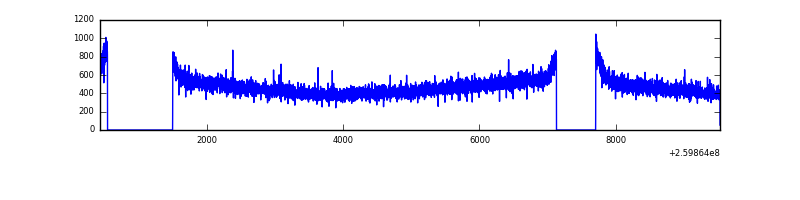 |
| B | 9088 | 7559 | 29 | 29 | 0.32% | 0.38% | 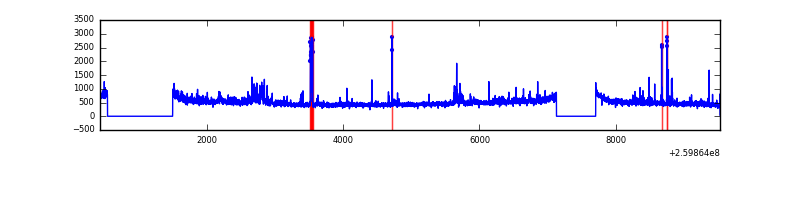 |
| C | 9088 | 7559 | 0 | 0 | 0.00% | 0.00% | 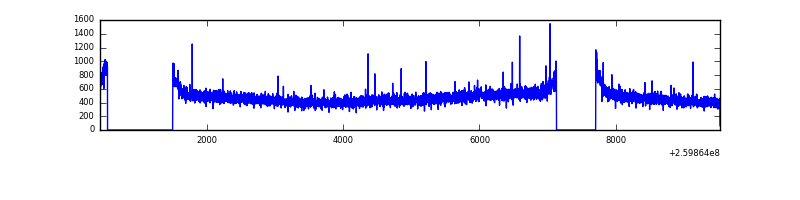 |
| D | 9088 | 7559 | 6 | 6 | 0.07% | 0.08% | 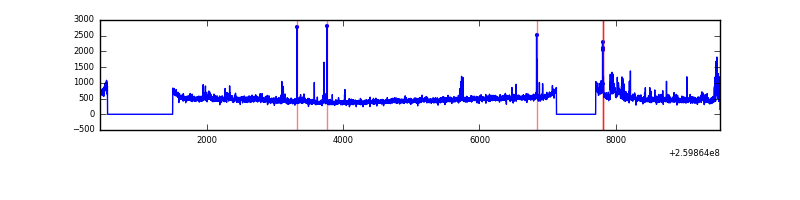 |
Top three noisy pixels from each quadrant. If the there are fewer than three noisy pixels in the level2.evt file, extra rows are filled as -1
| Pixel properties | Quadrant properties | ||||||
|---|---|---|---|---|---|---|---|
| Quadrant | DetID | PixID | Counts | Sigma | Mean | Median | Sigma |
| A | 1 | 162 | 16815 | 85.04 | 915 | 895 | 187.2 |
| A | 0 | 226 | 8141 | 38.7 | 915 | 895 | 187.2 |
| A | 12 | 194 | 6879 | 31.96 | 915 | 895 | 187.2 |
| B | 3 | 64 | 154761 | 880.17 | 915 | 893 | 174.8 |
| B | 10 | 245 | 69756 | 393.92 | 915 | 893 | 174.8 |
| B | 4 | 173 | 56150 | 316.09 | 915 | 893 | 174.8 |
| C | 3 | 233 | 85636 | 412.86 | 888 | 894 | 205.3 |
| C | 0 | 207 | 23387 | 109.58 | 888 | 894 | 205.3 |
| C | 13 | 61 | 6436 | 27.0 | 888 | 894 | 205.3 |
| D | 8 | 195 | 231143 | 1095.44 | 876 | 852 | 210.2 |
| D | 13 | 122 | 85302 | 401.71 | 876 | 852 | 210.2 |
| D | 2 | 234 | 40434 | 188.28 | 876 | 852 | 210.2 |
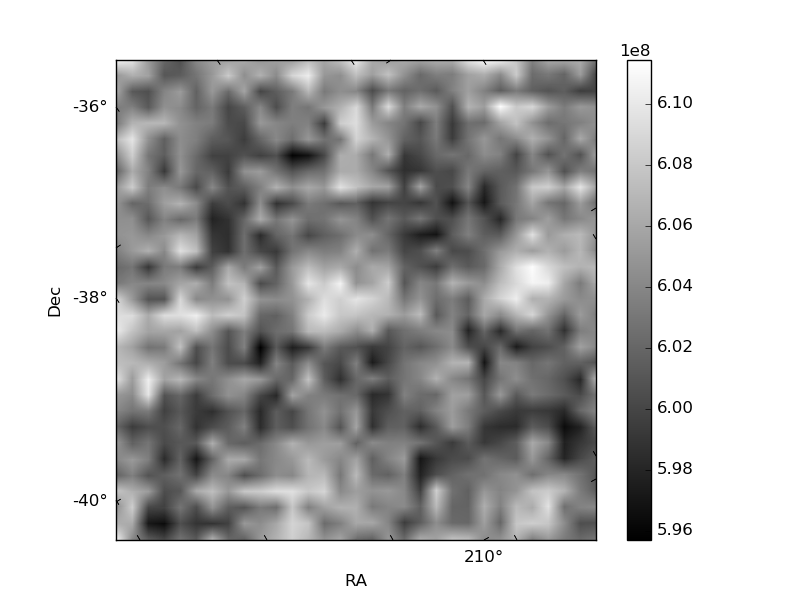
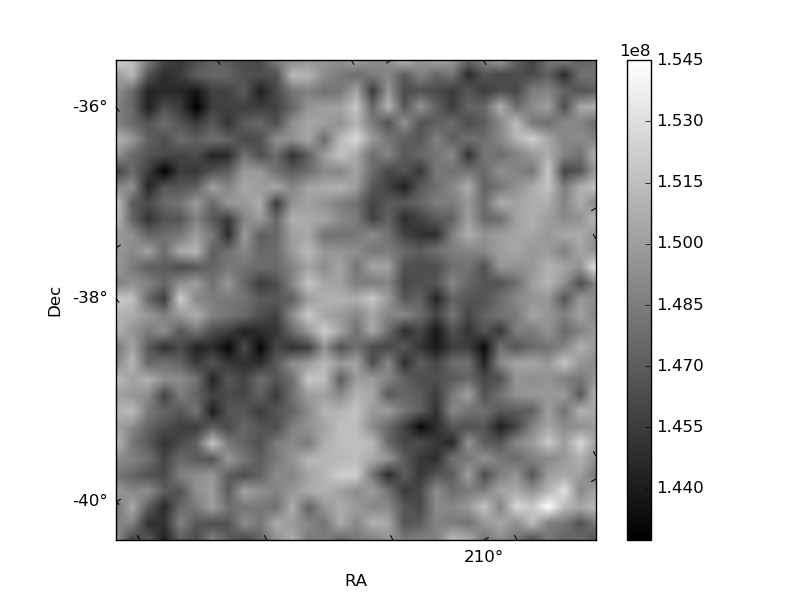
Histogram calculated using DETX and DETY for each event in the final _common_clean file
| Quadrant A | 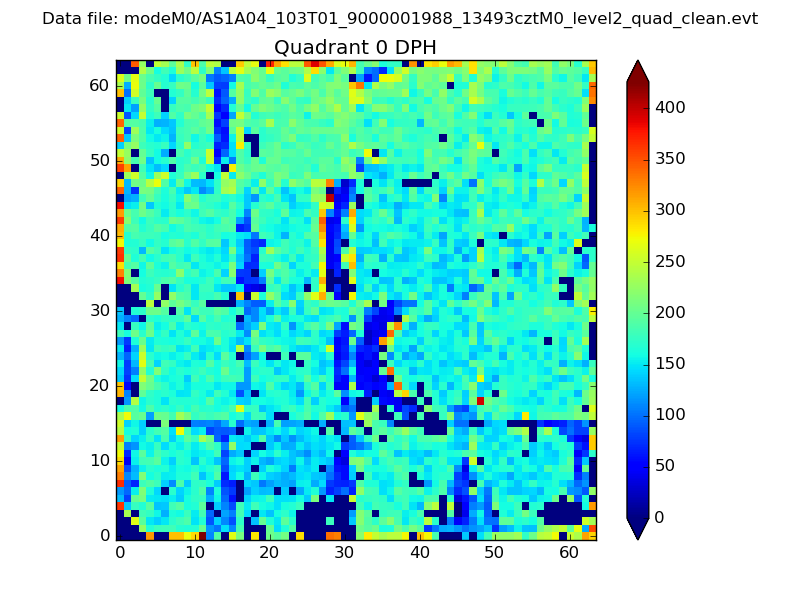 |
 |
Quadrant B |
|---|---|---|---|
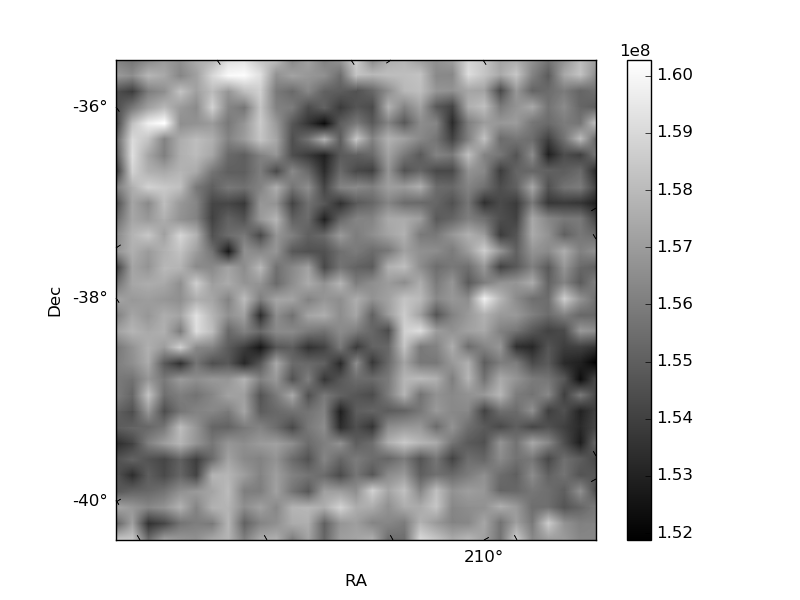
| Quadrant D | 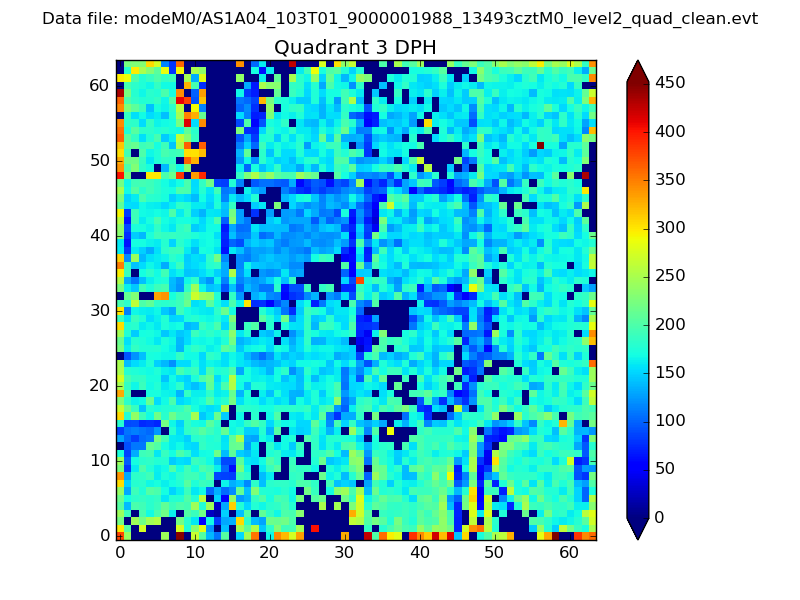 |
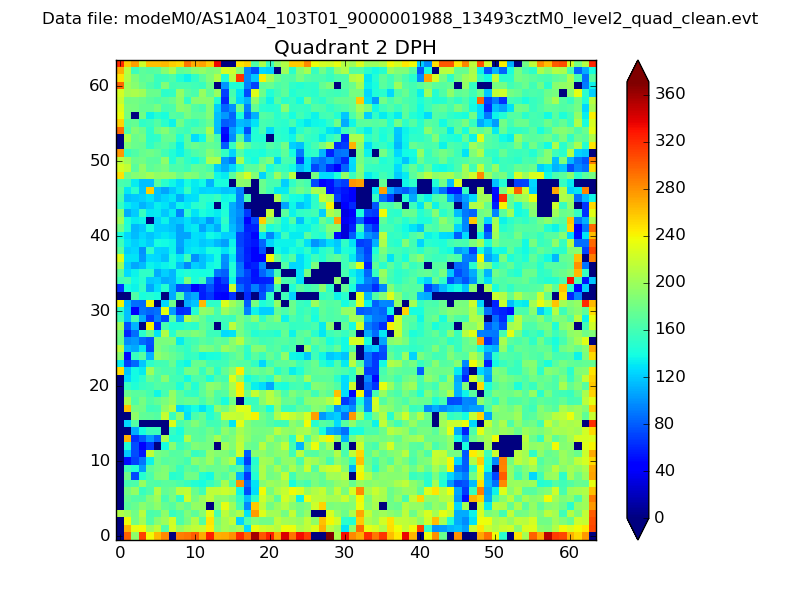 |
Quadrant C |
| Plot type | Count rate plots | Images |
|---|---|---|
| Comparison with Poisson distribution Blue bars denote a histogram of data divided into 1 sec bins. Red curve is a Poisson curve with rate = median count rate of data. |
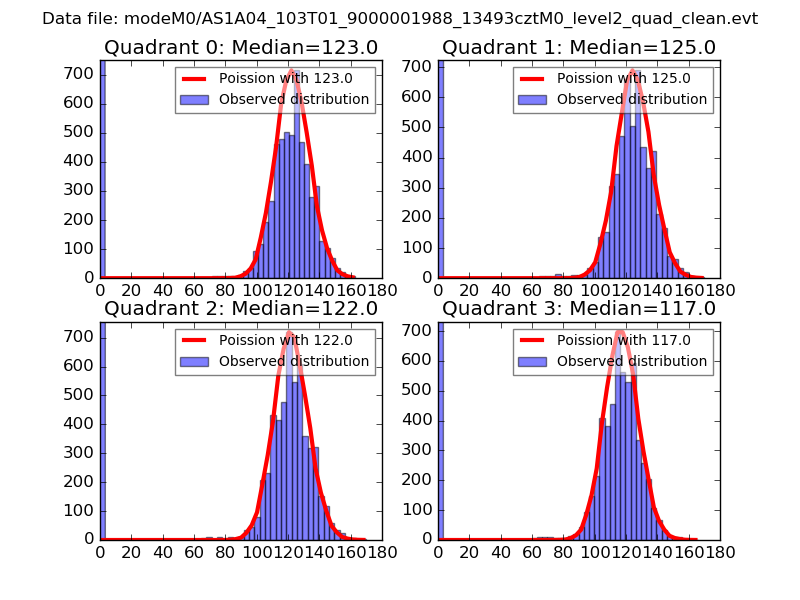 |
 |
| Quadrant-wise count rates Data is divided into 100 sec bins |
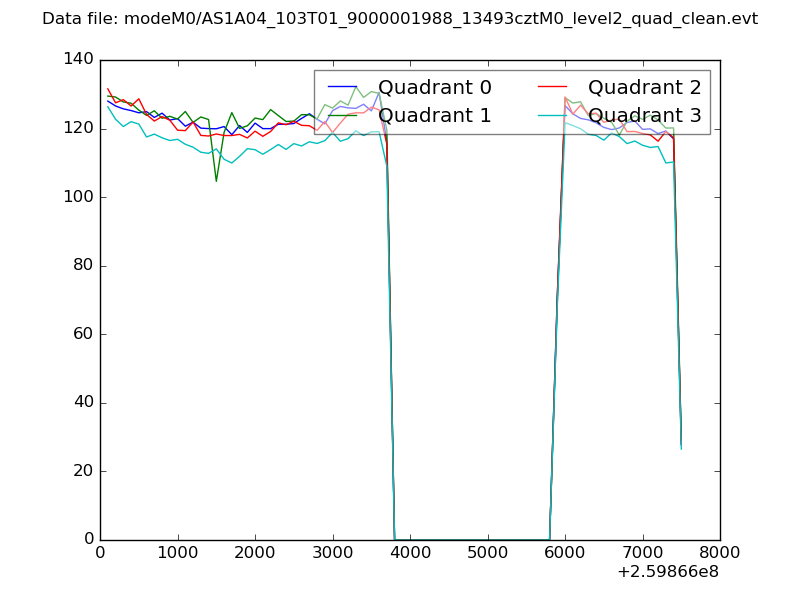 |
|
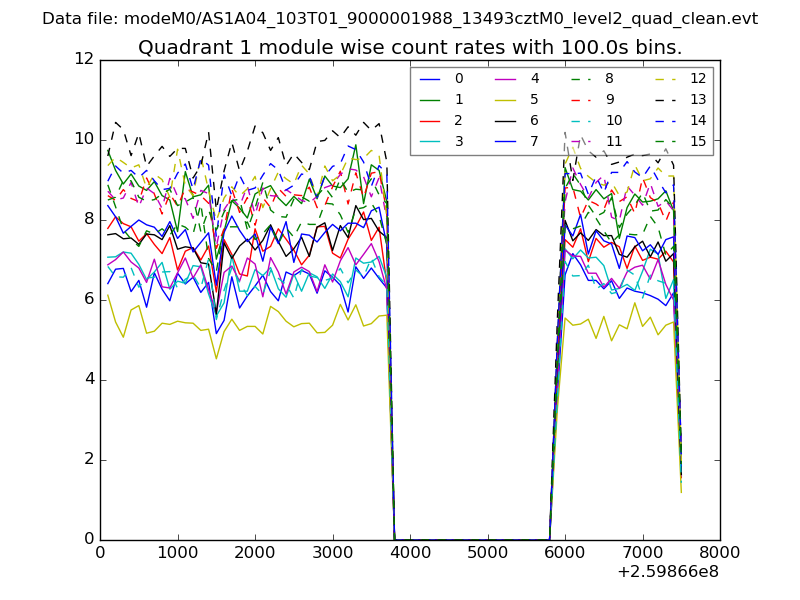
| Module-wise count rates for Quadrant A Data is divided into 100 sec bins |
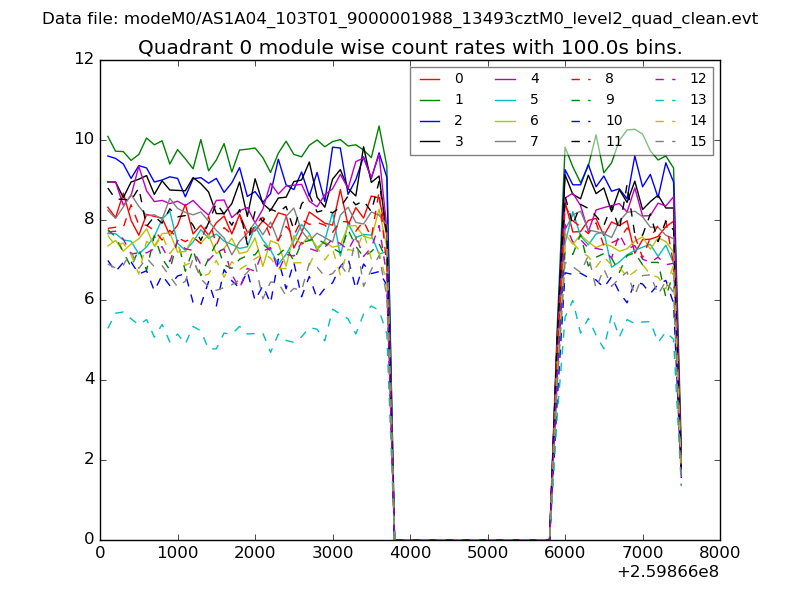 |
 |
| Module-wise count rates for Quadrant B Data is divided into 100 sec bins |
 |
 |
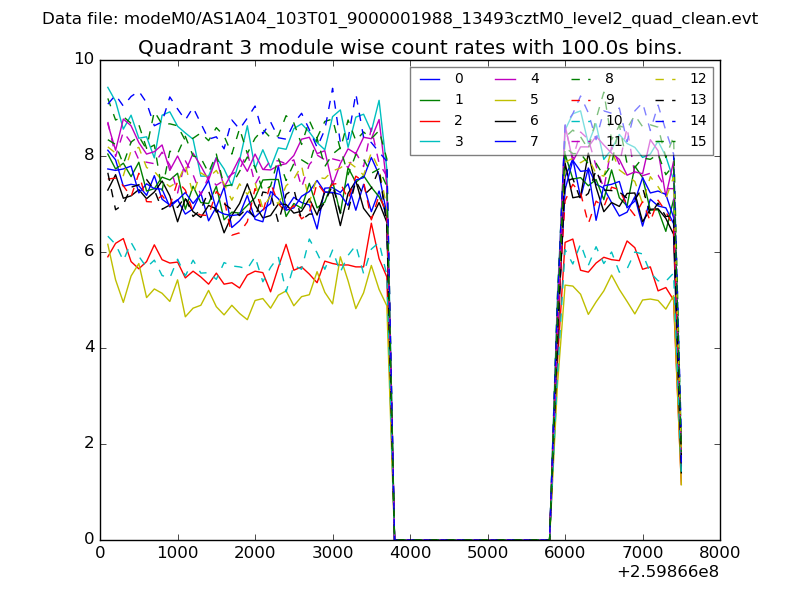
| Module-wise count rates for Quadrant C Data is divided into 100 sec bins |
 |
 |
| Module-wise count rates for Quadrant D Data is divided into 100 sec bins |
 |
 |
| Parameter | Plot |
|---|---|
| CZT HV Monitor | 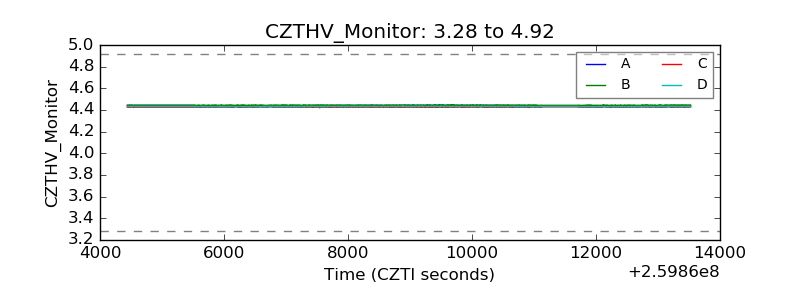 |
| D_VDD | 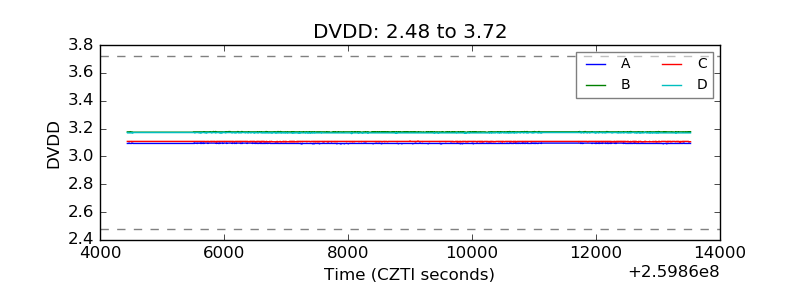 |
| Temperature 1 | 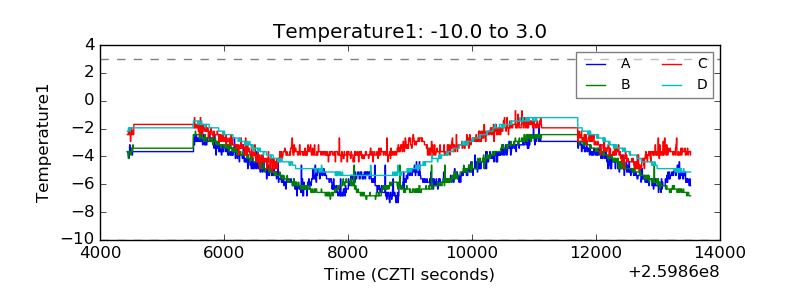 |
| Veto HV Monitor | 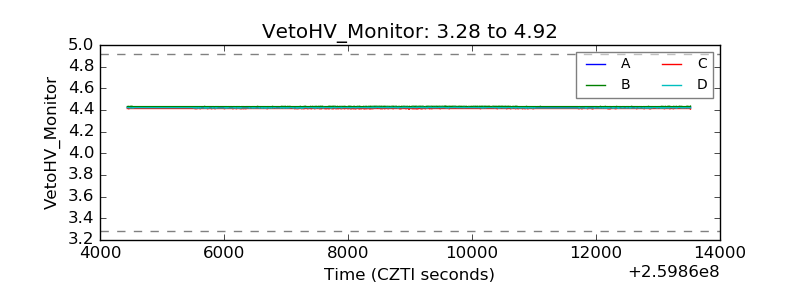 |
| Veto LLD | 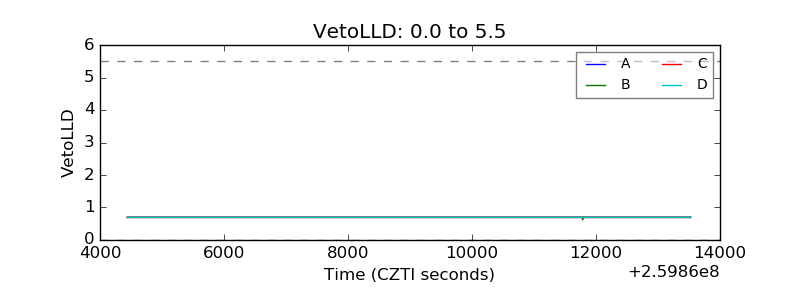 |
| Alpha Counter | 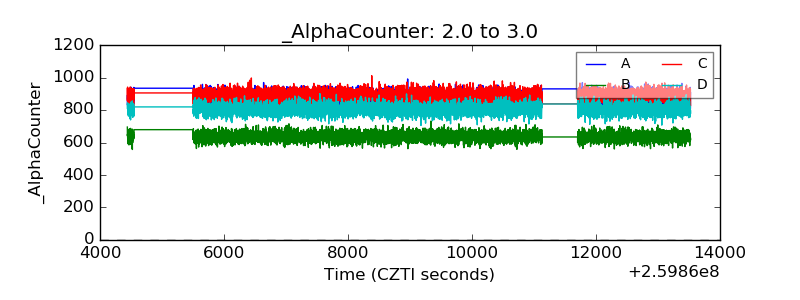 |
| _CPM_Rate | 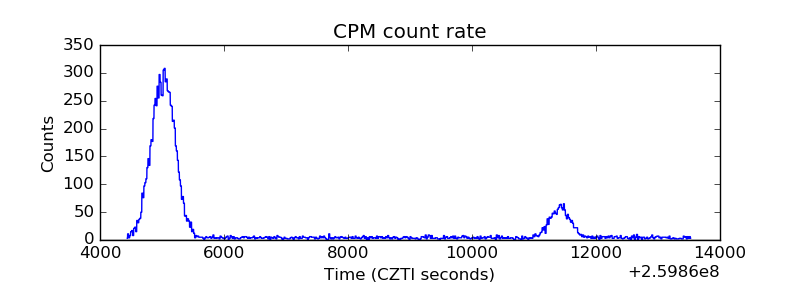 |
| CZT Counter | 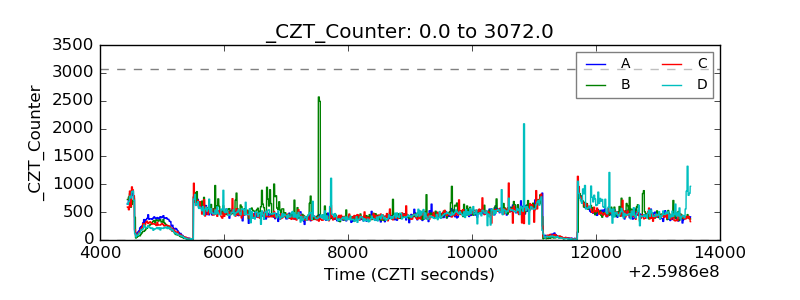 |
| +2.5 Volts monitor |  |
| +5 Volts monitor | 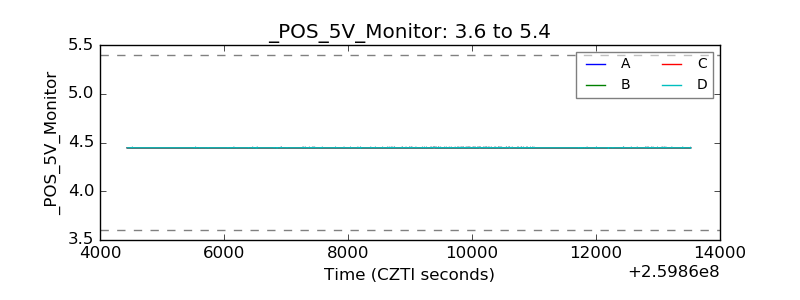 |
| _ROLL_ROT | 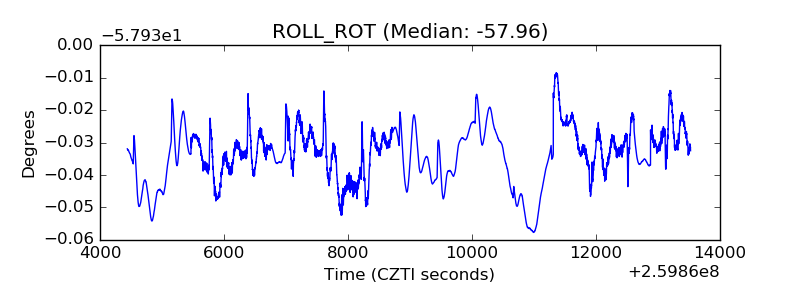 |
| _Roll_DEC | 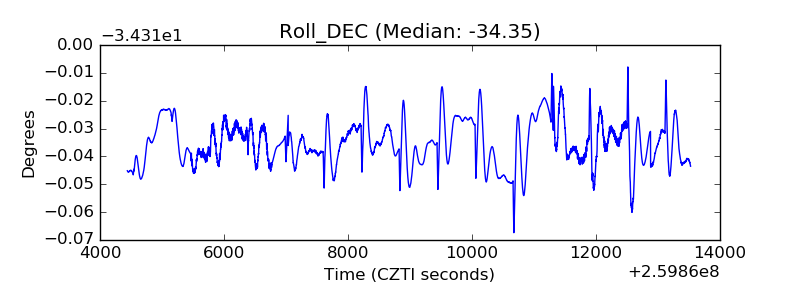 |
| _Roll_RA | 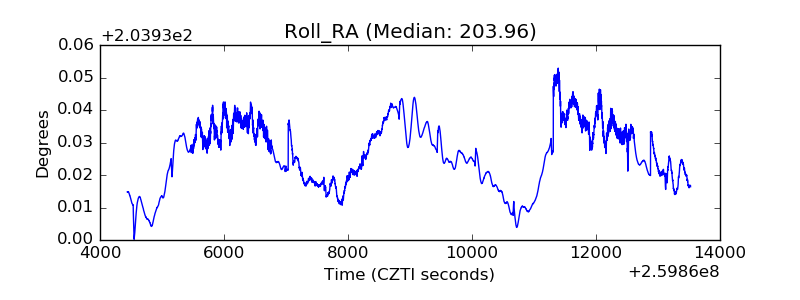 |
| Veto Counter |  |