| Param | Original file | Final file |
|---|---|---|
| Filename | modeM0/AS1A04_103T01_9000001988_13494cztM0_level2.evt | modeM0/AS1A04_103T01_9000001988_13494cztM0_level2_quad_clean.evt |
| Size (bytes) | 498,853,440 | 101,649,600 |
| Size | 475.7 MB | 96.9 MB |
| Events in quadrant A | 3,540,056 | 645,931 |
| Events in quadrant B | 3,691,418 | 656,971 |
| Events in quadrant C | 3,495,185 | 644,058 |
| Events in quadrant D | 3,876,315 | 614,322 |
| Mode M0 | |||
|---|---|---|---|
| Quadrant | BADHDUFLAG | Total packets | Discarded packets |
| A | 0 | 15585 | 2 |
| B | 0 | 15927 | 1 |
| C | 0 | 15370 | 1 |
| D | 0 | 16558 | 1 |
| Mode SS | |||
|---|---|---|---|
| Quadrant | BADHDUFLAG | Total packets | Discarded packets |
| A | 0 | 152 | 0 |
| B | 0 | 152 | 0 |
| C | 0 | 152 | 0 |
| D | 0 | 152 | 0 |
| Mode M9 | |||
|---|---|---|---|
| Quadrant | BADHDUFLAG | Total packets | Discarded packets |
| A | 0 | 2 | 0 |
| B | 0 | 2 | 0 |
| C | 0 | 2 | 0 |
| D | 0 | 2 | 0 |
| Quadrant | Total seconds | Saturated seconds | Saturation percentage |
|---|---|---|---|
| A | 7426 | 58 | 0.781040% |
| B | 7426 | 108 | 1.454350% |
| C | 7426 | 37 | 0.498249% |
| D | 7426 | 37 | 0.498249% |
Noise dominated data is calculated using 1-second bins in cleaned event files. If a bin has >2000 counts, and if more than 50% of those come from <1% of pixels, then it is considered to be noise-dominated and hence unusable.
| Quadrant | # 1 sec bins | Bins with >0 counts | Bins with >2000 counts | High rate bins dominated by noise | Noise dominated (total time) | Noise dominated (detector-on time) | Marked lightcurve |
|---|---|---|---|---|---|---|---|
| A | 7692 | 7428 | 0 | 0 | 0.00% | 0.00% | 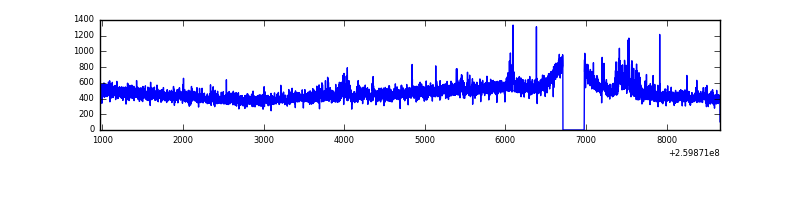 |
| B | 7692 | 7427 | 22 | 22 | 0.29% | 0.30% | 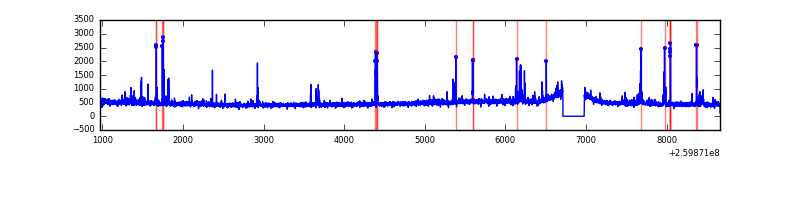 |
| C | 7692 | 7428 | 2 | 2 | 0.03% | 0.03% | 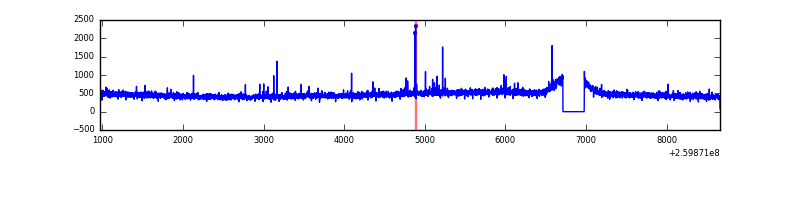 |
| D | 7692 | 7428 | 63 | 63 | 0.82% | 0.85% | 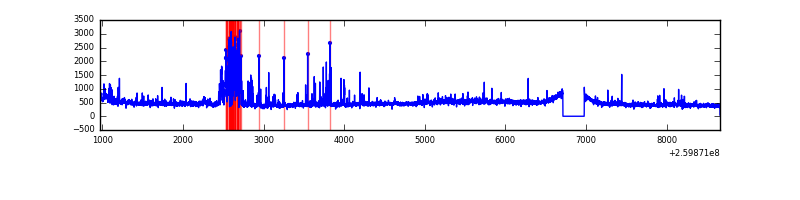 |
Top three noisy pixels from each quadrant. If the there are fewer than three noisy pixels in the level2.evt file, extra rows are filled as -1
| Pixel properties | Quadrant properties | ||||||
|---|---|---|---|---|---|---|---|
| Quadrant | DetID | PixID | Counts | Sigma | Mean | Median | Sigma |
| A | 8 | 15 | 136557 | 749.06 | 879 | 860 | 181.2 |
| A | 1 | 162 | 17019 | 89.2 | 879 | 860 | 181.2 |
| A | 0 | 226 | 7722 | 37.88 | 879 | 860 | 181.2 |
| B | 10 | 245 | 109930 | 645.19 | 883 | 860 | 169.1 |
| B | 3 | 64 | 50267 | 292.26 | 883 | 860 | 169.1 |
| B | 4 | 173 | 27938 | 160.18 | 883 | 860 | 169.1 |
| C | 3 | 233 | 110839 | 552.55 | 854 | 857 | 199.0 |
| C | 0 | 207 | 54878 | 271.4 | 854 | 857 | 199.0 |
| C | 13 | 61 | 6335 | 27.52 | 854 | 857 | 199.0 |
| D | 7 | 223 | 292051 | 1432.14 | 843 | 819 | 203.4 |
| D | 8 | 195 | 178434 | 873.42 | 843 | 819 | 203.4 |
| D | 13 | 249 | 128735 | 629.03 | 843 | 819 | 203.4 |
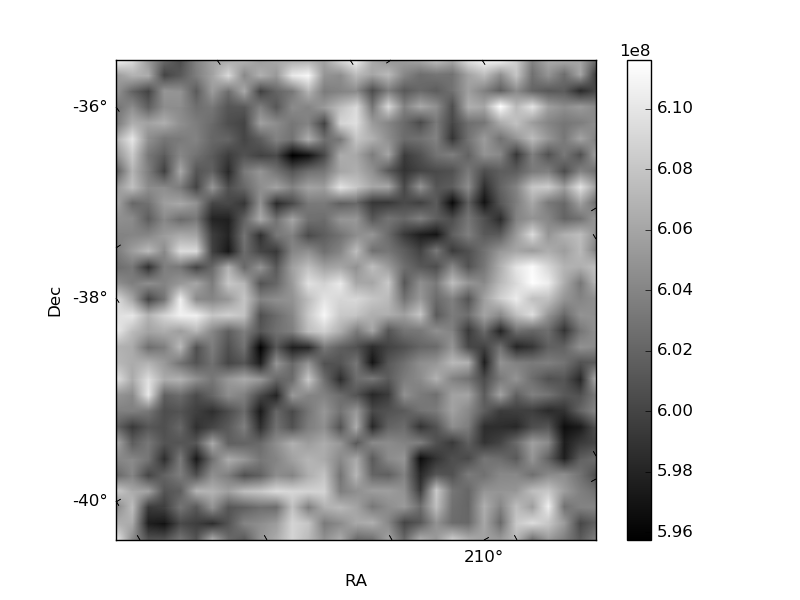
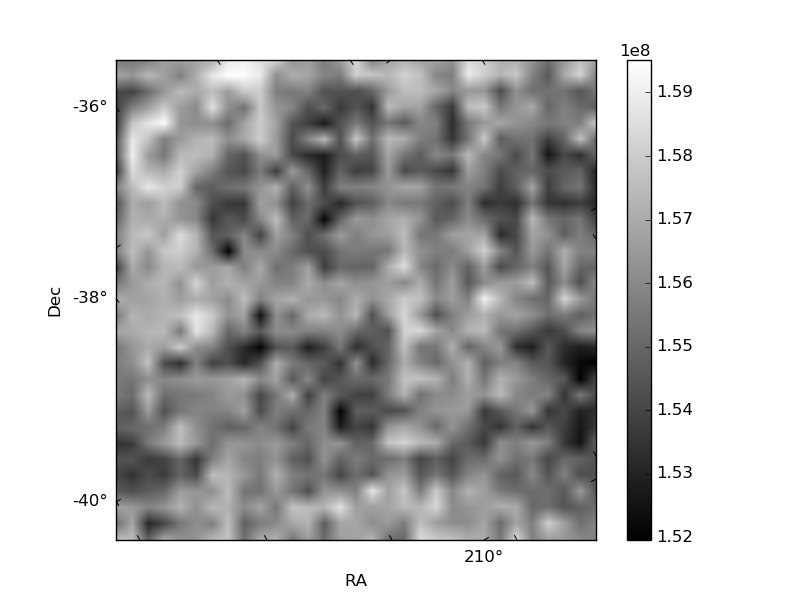
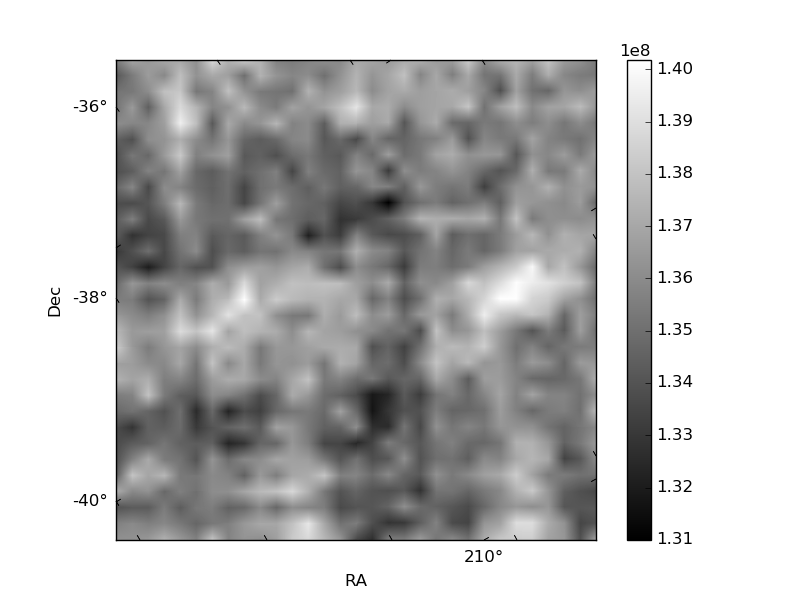
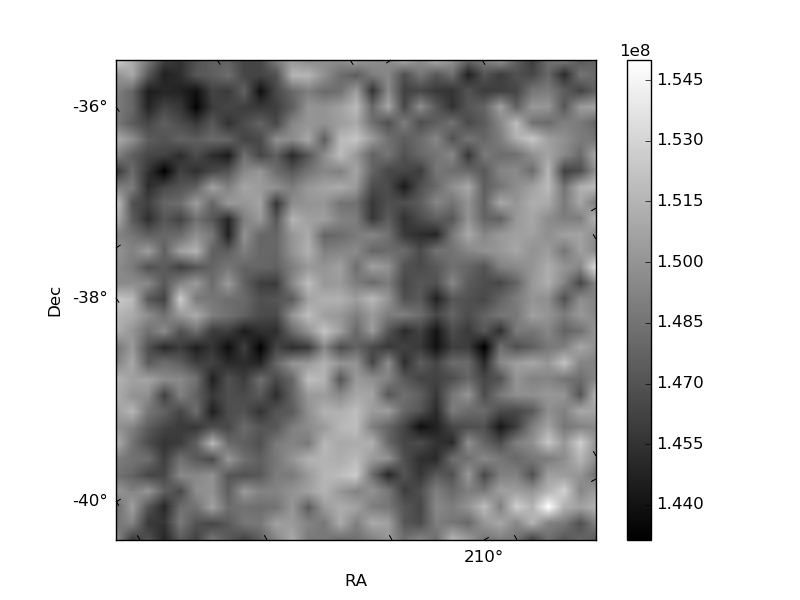
Histogram calculated using DETX and DETY for each event in the final _common_clean file
| Quadrant A | 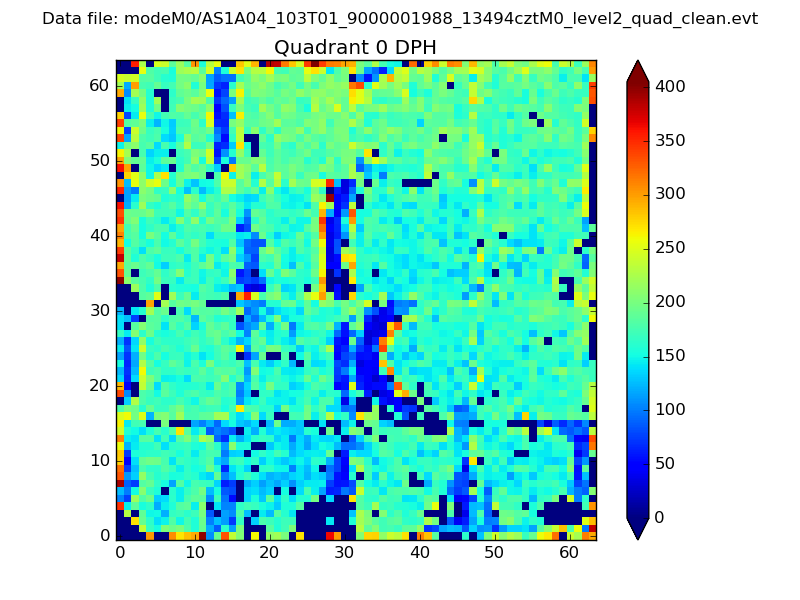 |
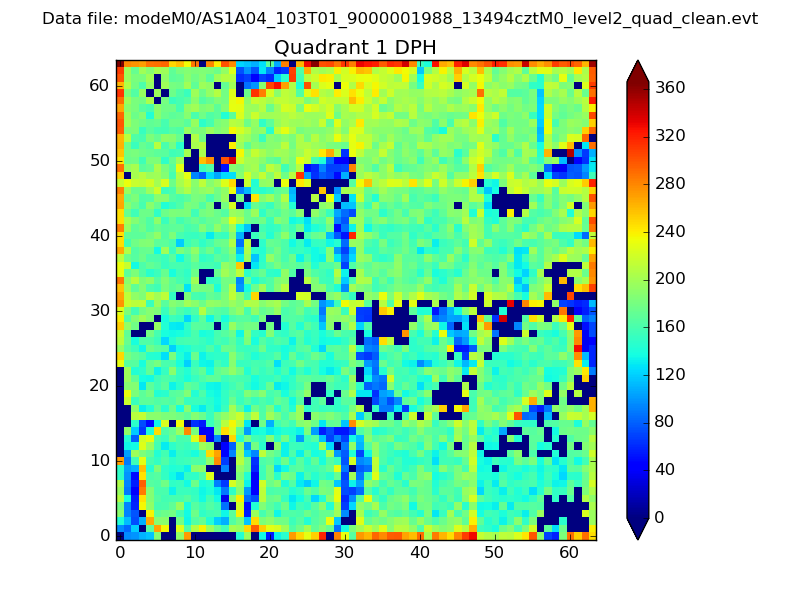 |
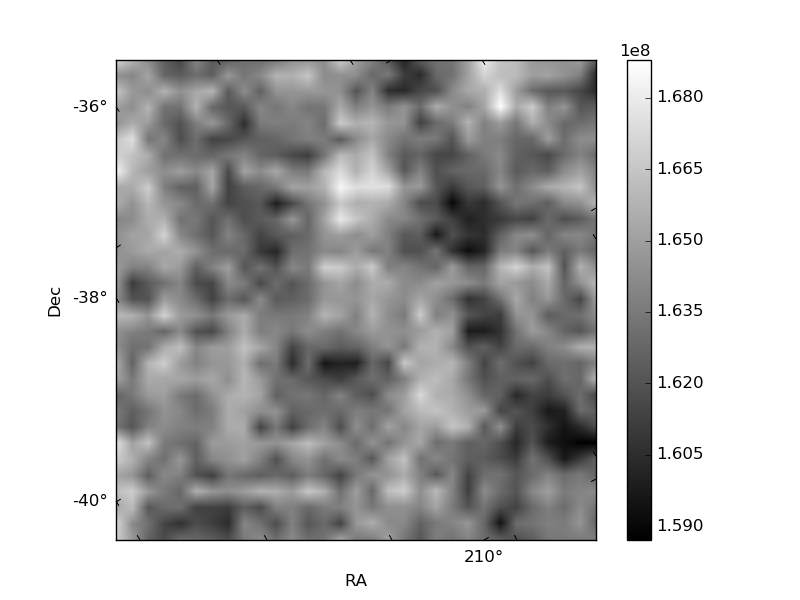
Quadrant B |
|---|---|---|---|
| Quadrant D | 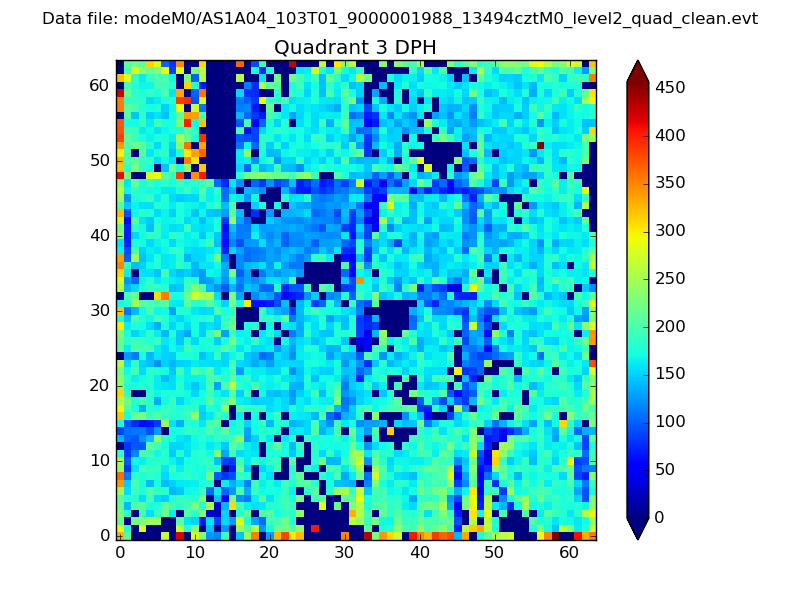 |
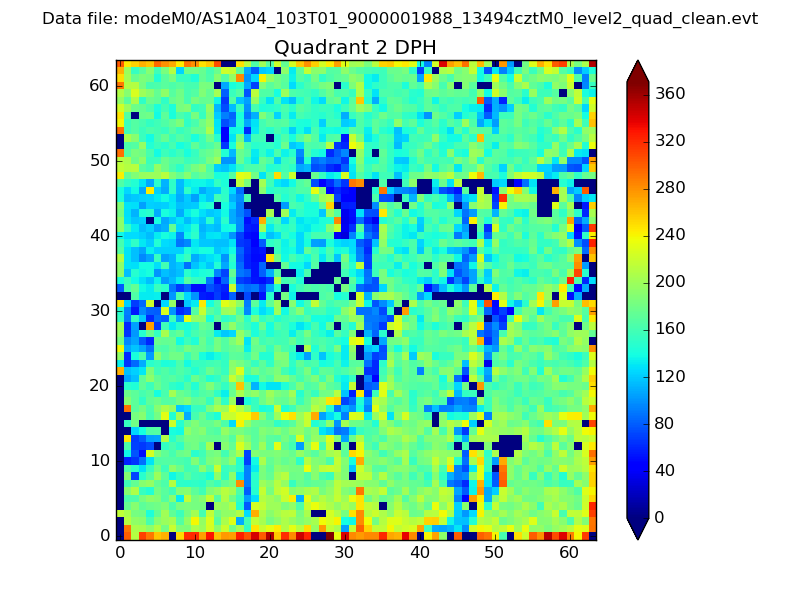 |
Quadrant C |
| Plot type | Count rate plots | Images |
|---|---|---|
| Comparison with Poisson distribution Blue bars denote a histogram of data divided into 1 sec bins. Red curve is a Poisson curve with rate = median count rate of data. |
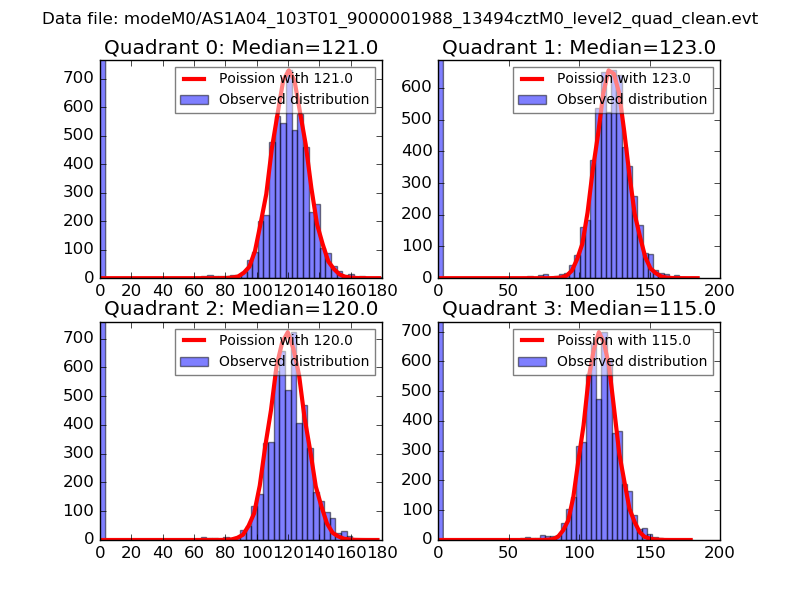 |
 |
| Quadrant-wise count rates Data is divided into 100 sec bins |
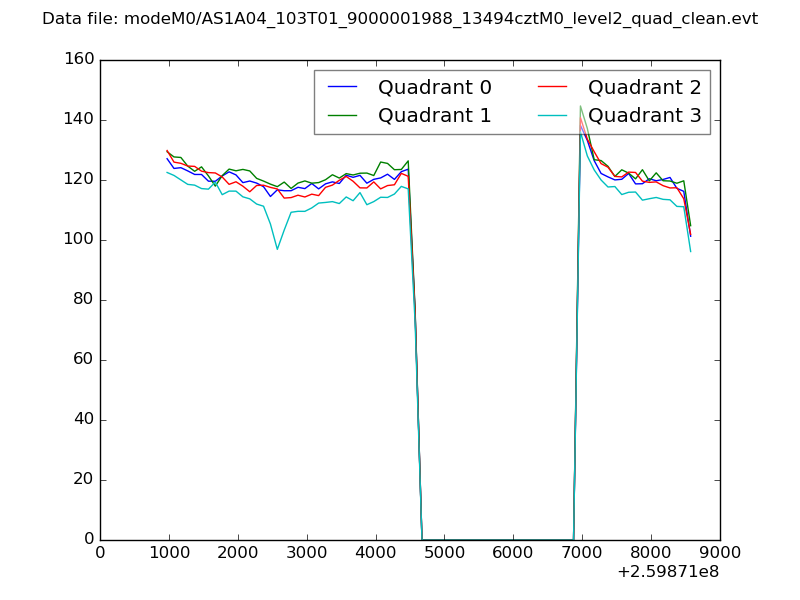 |
|
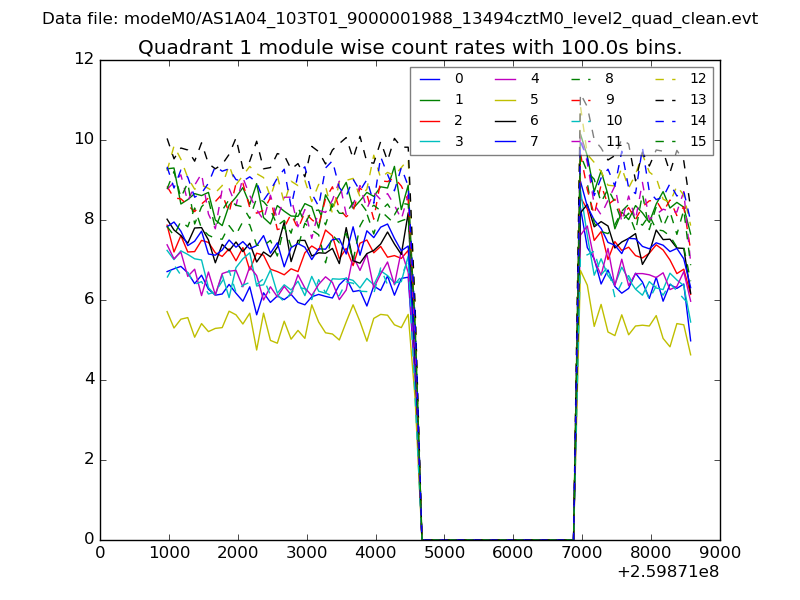
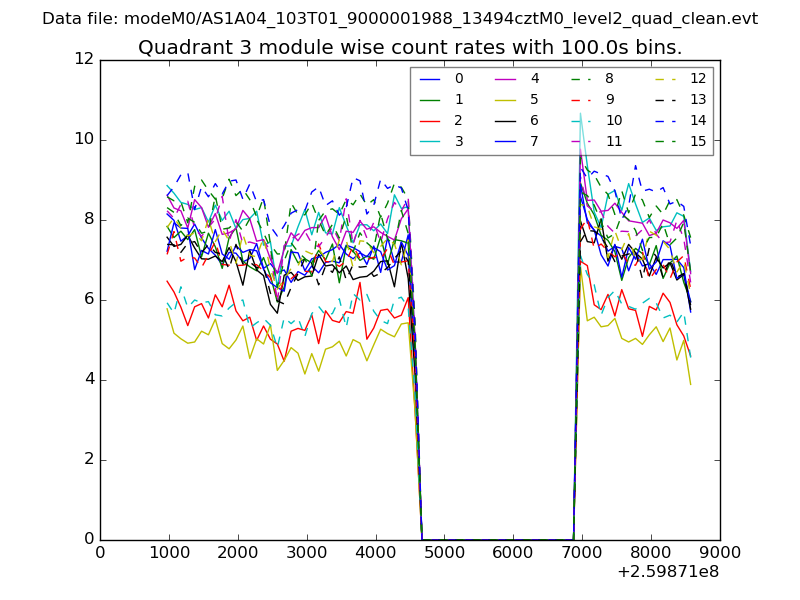
| Module-wise count rates for Quadrant A Data is divided into 100 sec bins |
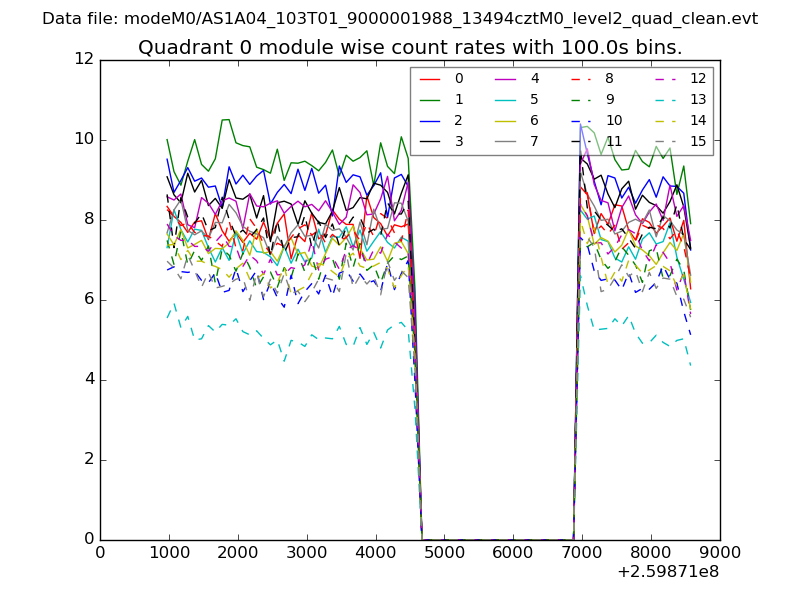 |
 |
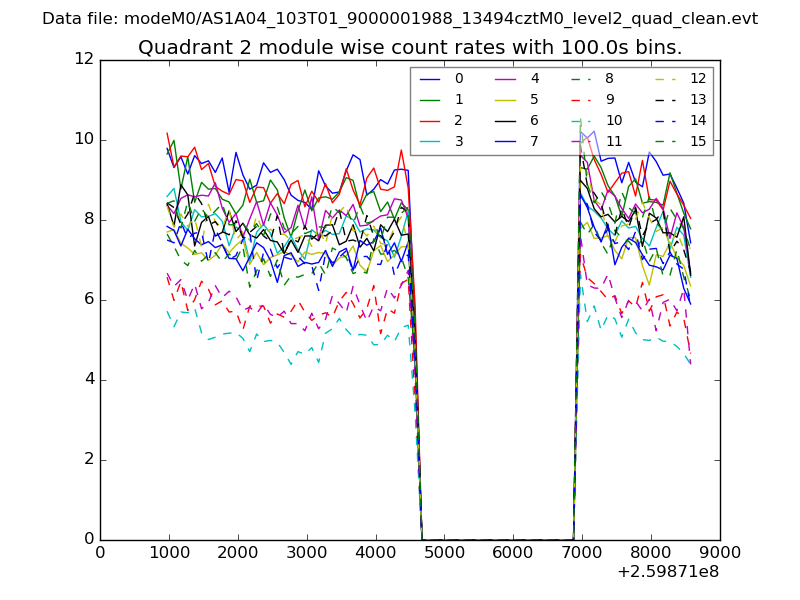
| Module-wise count rates for Quadrant B Data is divided into 100 sec bins |
 |
 |
| Module-wise count rates for Quadrant C Data is divided into 100 sec bins |
 |
 |
| Module-wise count rates for Quadrant D Data is divided into 100 sec bins |
 |
 |
| Parameter | Plot |
|---|---|
| CZT HV Monitor | 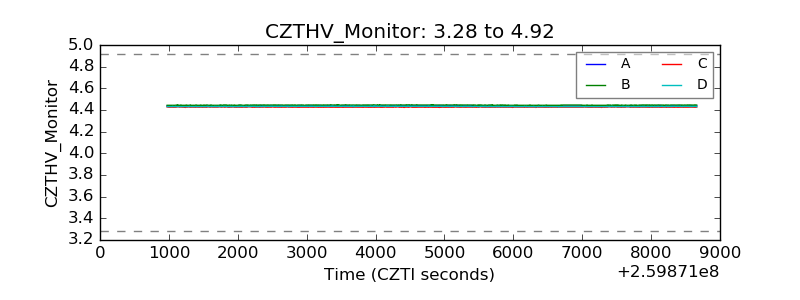 |
| D_VDD | 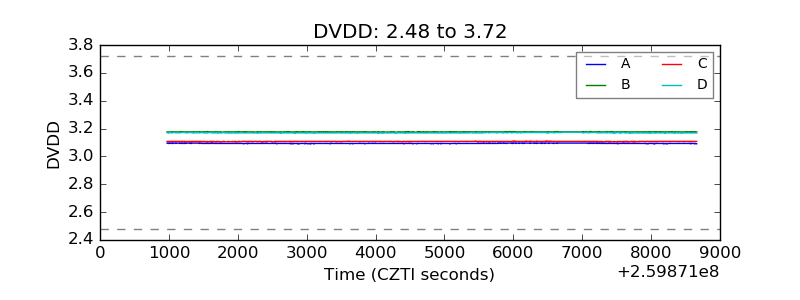 |
| Temperature 1 | 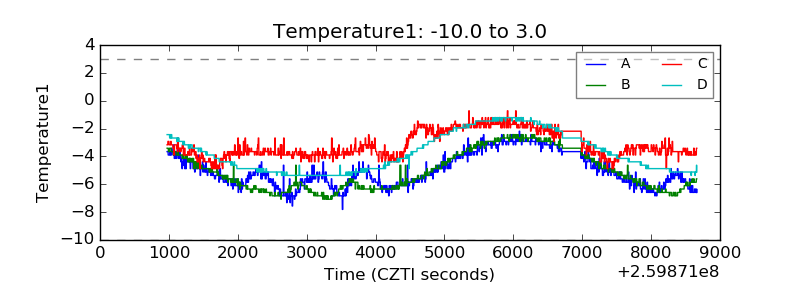 |
| Veto HV Monitor | 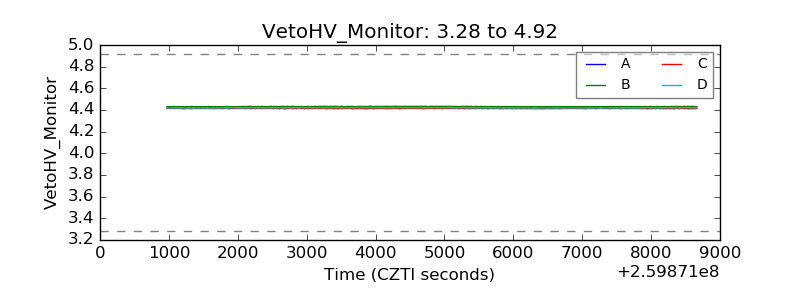 |
| Veto LLD | 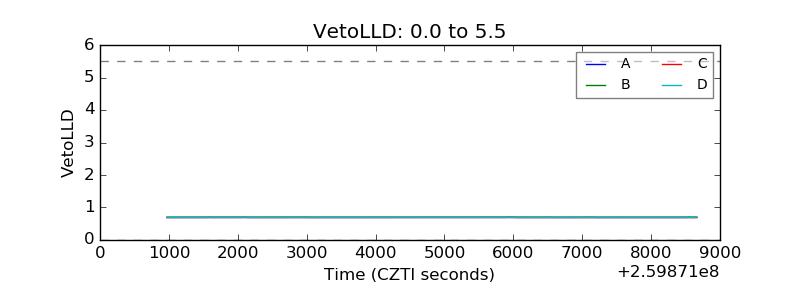 |
| Alpha Counter | 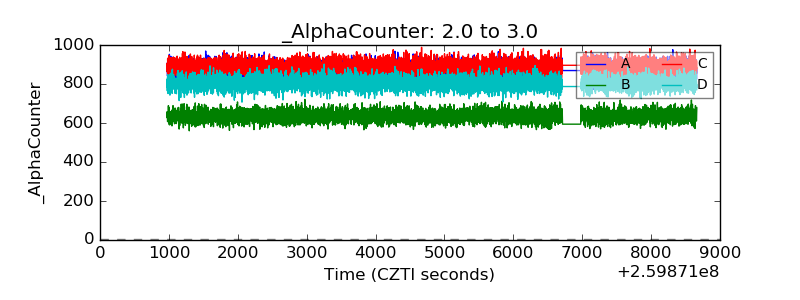 |
| _CPM_Rate | 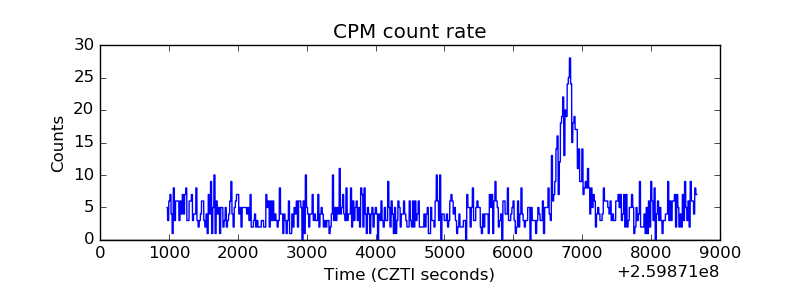 |
| CZT Counter | 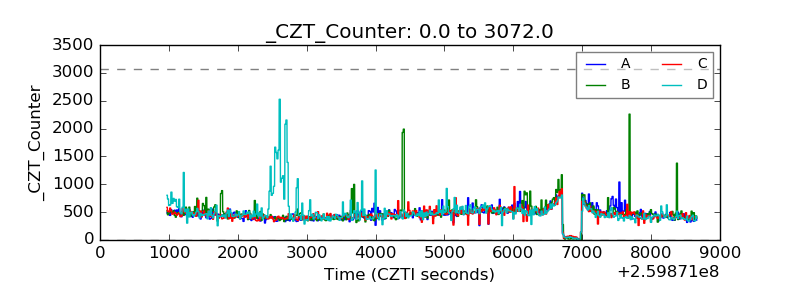 |
| +2.5 Volts monitor |  |
| +5 Volts monitor |  |
| _ROLL_ROT | 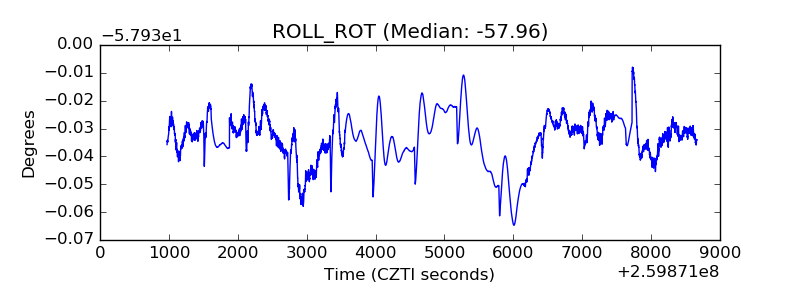 |
| _Roll_DEC | 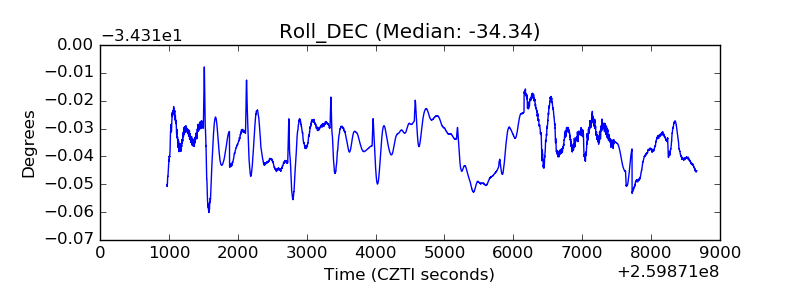 |
| _Roll_RA | 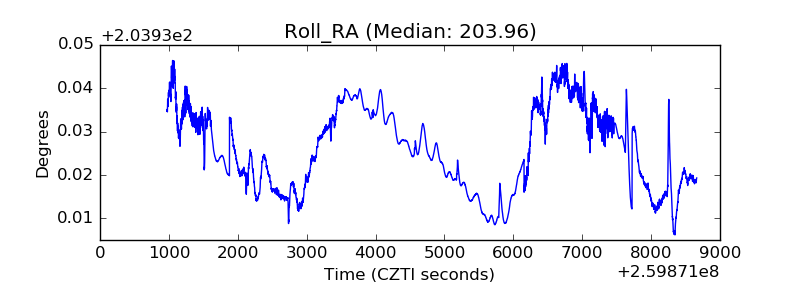 |
| Veto Counter | 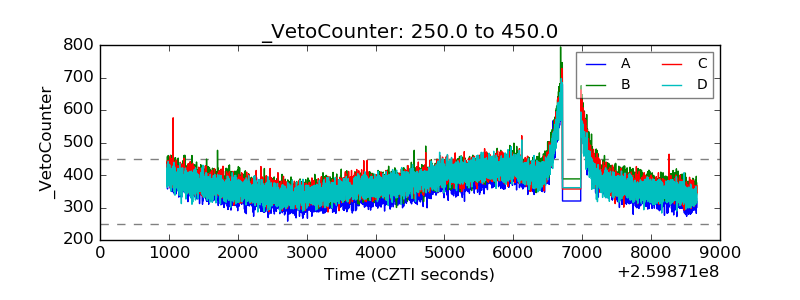 |