| Param | Original file | Final file |
|---|---|---|
| Filename | modeM0/AS1A04_103T01_9000001988_13495cztM0_level2.evt | modeM0/AS1A04_103T01_9000001988_13495cztM0_level2_quad_clean.evt |
| Size (bytes) | 522,659,520 | 106,182,720 |
| Size | 498.4 MB | 101.3 MB |
| Events in quadrant A | 3,827,689 | 667,858 |
| Events in quadrant B | 4,031,531 | 681,187 |
| Events in quadrant C | 3,787,658 | 666,934 |
| Events in quadrant D | 3,632,587 | 637,714 |
| Mode M0 | |||
|---|---|---|---|
| Quadrant | BADHDUFLAG | Total packets | Discarded packets |
| A | 0 | 16972 | 3 |
| B | 0 | 17380 | 2 |
| C | 0 | 16733 | 2 |
| D | 0 | 16728 | 2 |
| Mode SS | |||
|---|---|---|---|
| Quadrant | BADHDUFLAG | Total packets | Discarded packets |
| A | 0 | 166 | 0 |
| B | 0 | 166 | 0 |
| C | 0 | 166 | 0 |
| D | 0 | 166 | 0 |
| Mode M9 | |||
|---|---|---|---|
| Quadrant | BADHDUFLAG | Total packets | Discarded packets |
| A | 0 | 6 | 0 |
| B | 0 | 6 | 0 |
| C | 0 | 6 | 0 |
| D | 0 | 6 | 0 |
| Quadrant | Total seconds | Saturated seconds | Saturation percentage |
|---|---|---|---|
| A | 8086 | 66 | 0.816226% |
| B | 8086 | 113 | 1.397477% |
| C | 8086 | 47 | 0.581252% |
| D | 8086 | 21 | 0.259708% |
Noise dominated data is calculated using 1-second bins in cleaned event files. If a bin has >2000 counts, and if more than 50% of those come from <1% of pixels, then it is considered to be noise-dominated and hence unusable.
| Quadrant | # 1 sec bins | Bins with >0 counts | Bins with >2000 counts | High rate bins dominated by noise | Noise dominated (total time) | Noise dominated (detector-on time) | Marked lightcurve |
|---|---|---|---|---|---|---|---|
| A | 8727 | 8089 | 0 | 0 | 0.00% | 0.00% | 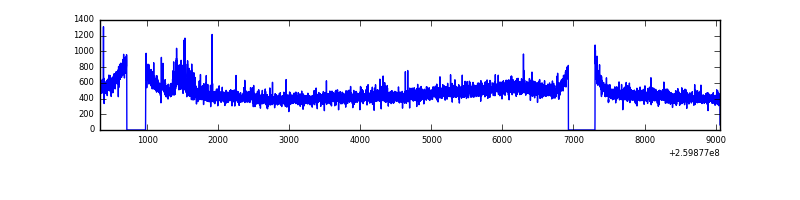 |
| B | 8727 | 8088 | 18 | 18 | 0.21% | 0.22% | 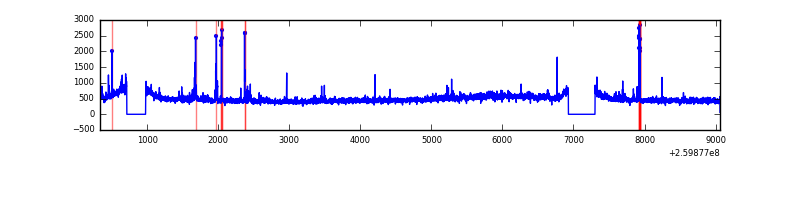 |
| C | 8727 | 8089 | 0 | 0 | 0.00% | 0.00% | 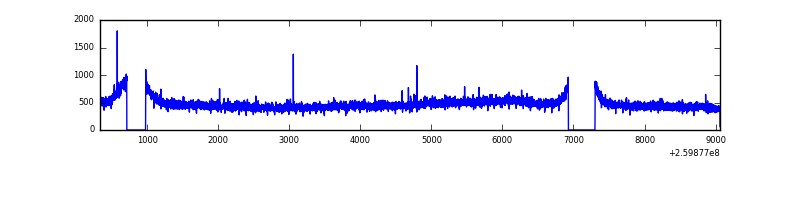 |
| D | 8727 | 8089 | 11 | 11 | 0.13% | 0.14% | 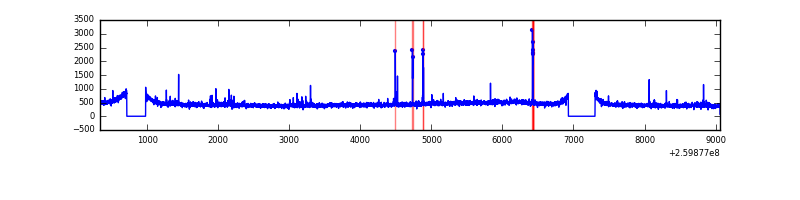 |
Top three noisy pixels from each quadrant. If the there are fewer than three noisy pixels in the level2.evt file, extra rows are filled as -1
| Pixel properties | Quadrant properties | ||||||
|---|---|---|---|---|---|---|---|
| Quadrant | DetID | PixID | Counts | Sigma | Mean | Median | Sigma |
| A | 8 | 15 | 95496 | 475.32 | 963 | 940 | 198.9 |
| A | 1 | 162 | 18569 | 88.62 | 963 | 940 | 198.9 |
| A | 0 | 226 | 8537 | 38.19 | 963 | 940 | 198.9 |
| B | 3 | 64 | 69644 | 368.61 | 967 | 940 | 186.4 |
| B | 10 | 245 | 68812 | 364.15 | 967 | 940 | 186.4 |
| B | 10 | 244 | 55091 | 290.53 | 967 | 940 | 186.4 |
| C | 3 | 233 | 117987 | 535.44 | 937 | 940 | 218.6 |
| C | 0 | 207 | 12827 | 54.38 | 937 | 940 | 218.6 |
| C | 13 | 61 | 6840 | 26.99 | 937 | 940 | 218.6 |
| D | 13 | 249 | 55309 | 242.9 | 926 | 898 | 224.0 |
| D | 8 | 195 | 44045 | 192.62 | 926 | 898 | 224.0 |
| D | 2 | 234 | 31560 | 136.88 | 926 | 898 | 224.0 |
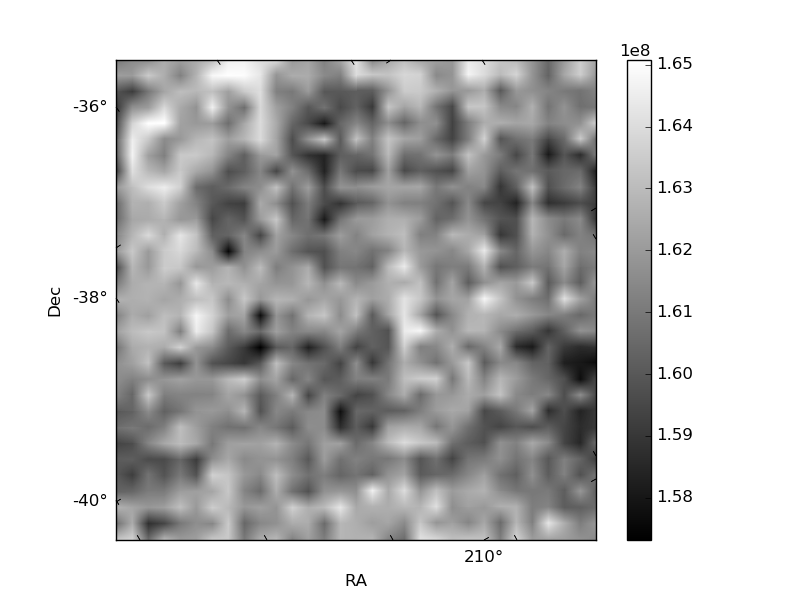
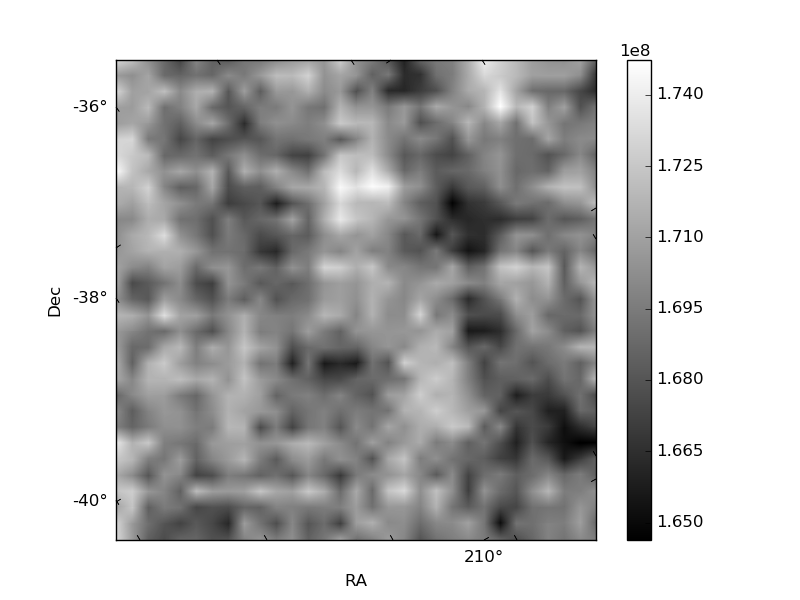
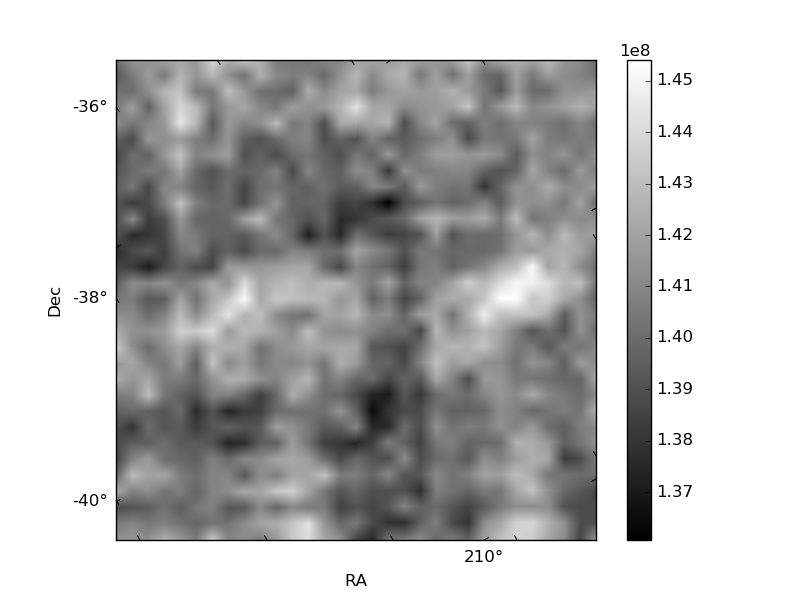
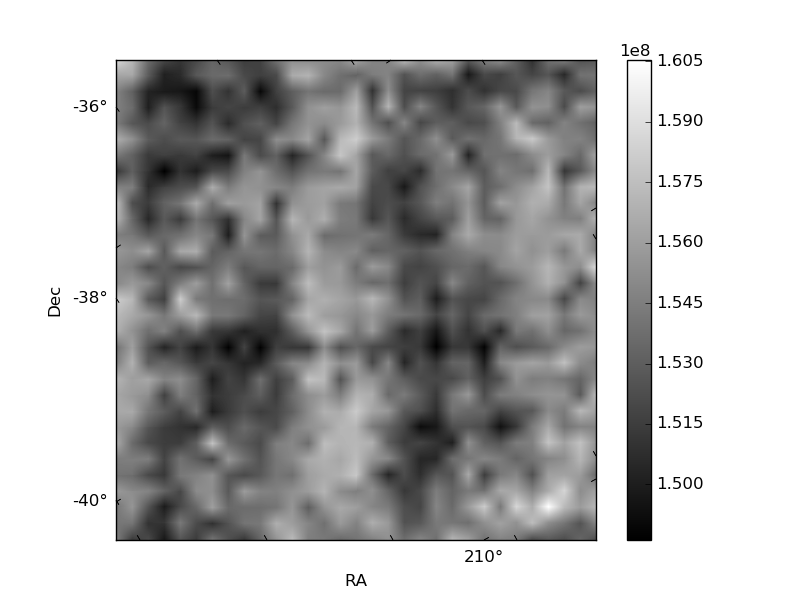
Histogram calculated using DETX and DETY for each event in the final _common_clean file
| Quadrant A | 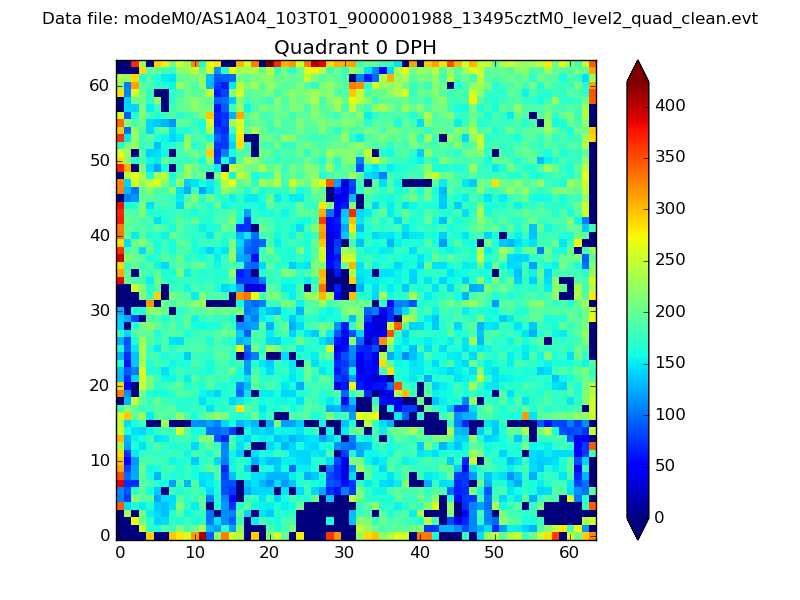 |
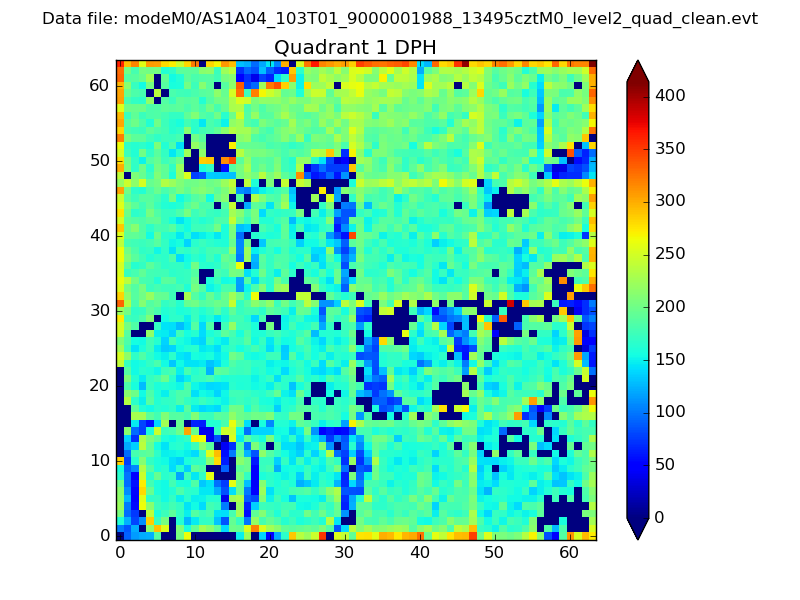 |
Quadrant B |
|---|---|---|---|
| Quadrant D | 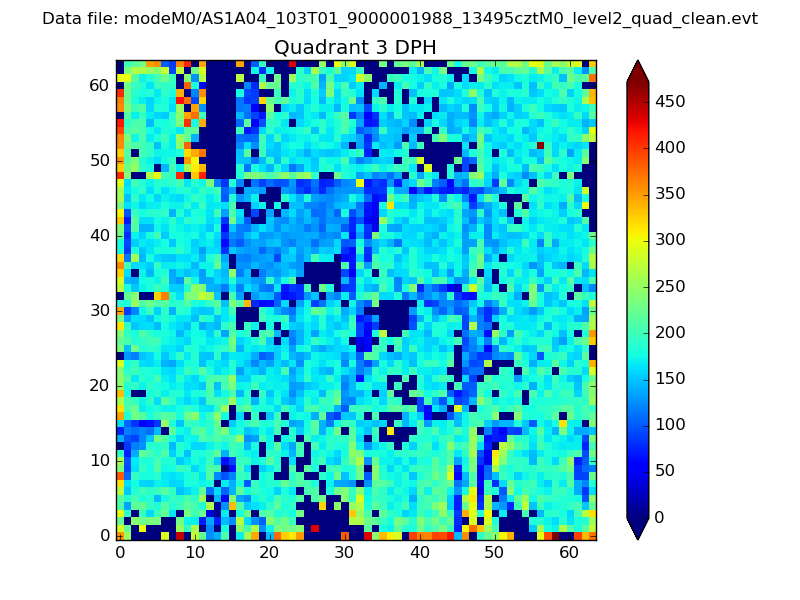 |
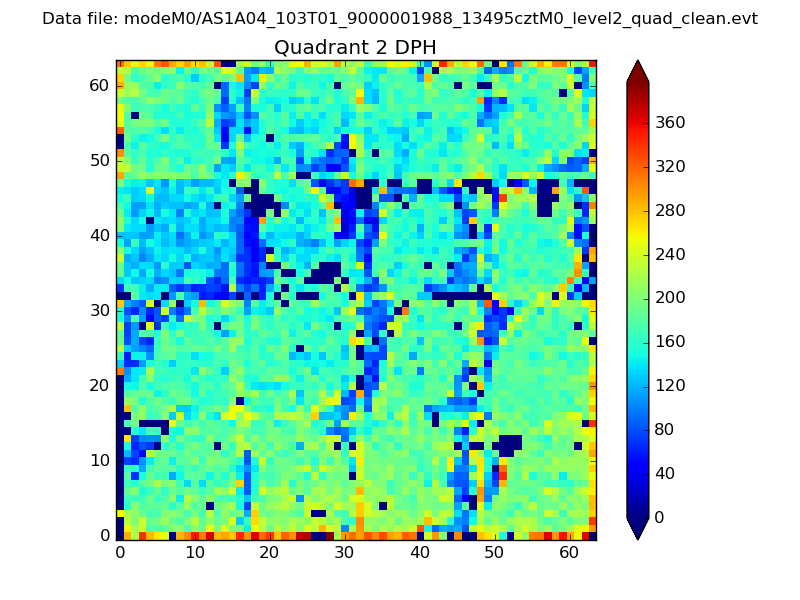 |
Quadrant C |
| Plot type | Count rate plots | Images |
|---|---|---|
| Comparison with Poisson distribution Blue bars denote a histogram of data divided into 1 sec bins. Red curve is a Poisson curve with rate = median count rate of data. |
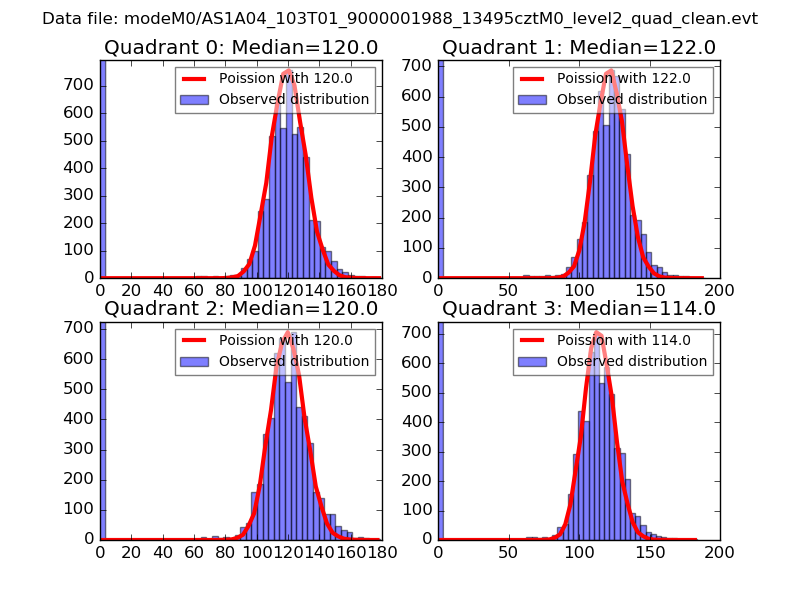 |
 |
| Quadrant-wise count rates Data is divided into 100 sec bins |
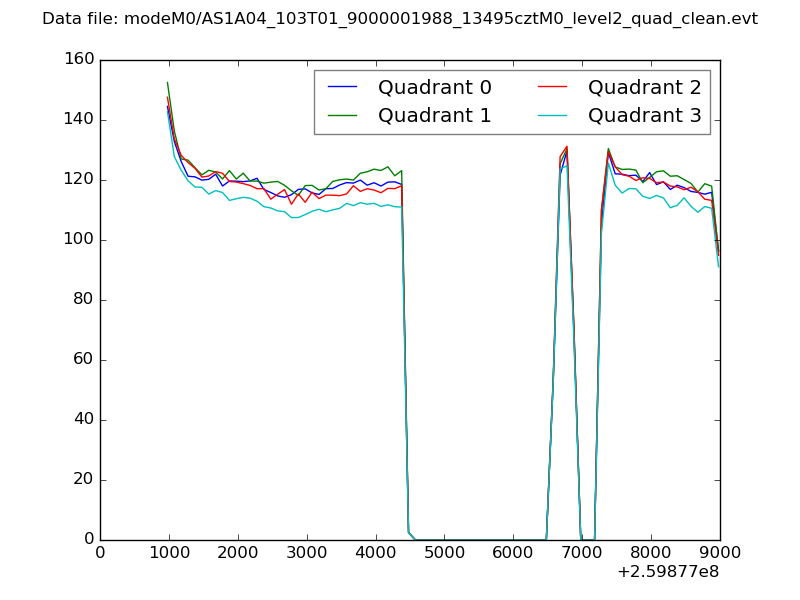 |
|
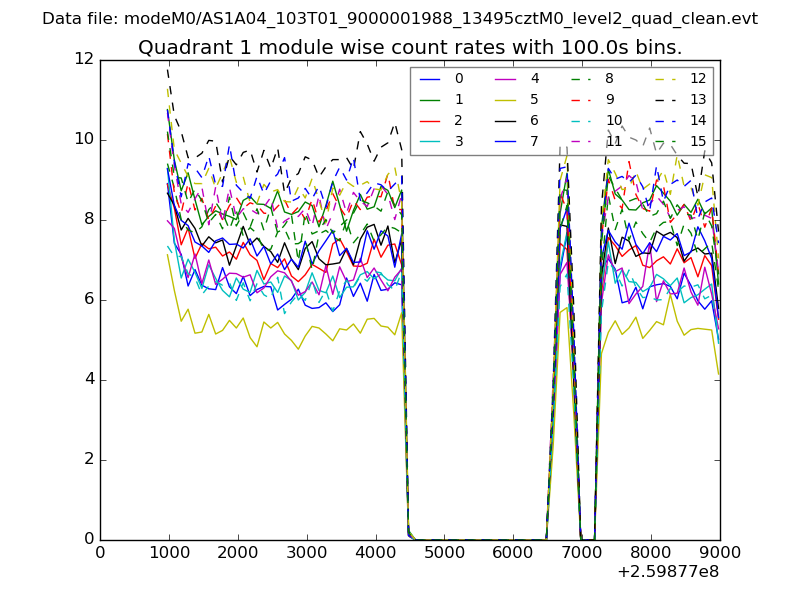
| Module-wise count rates for Quadrant A Data is divided into 100 sec bins |
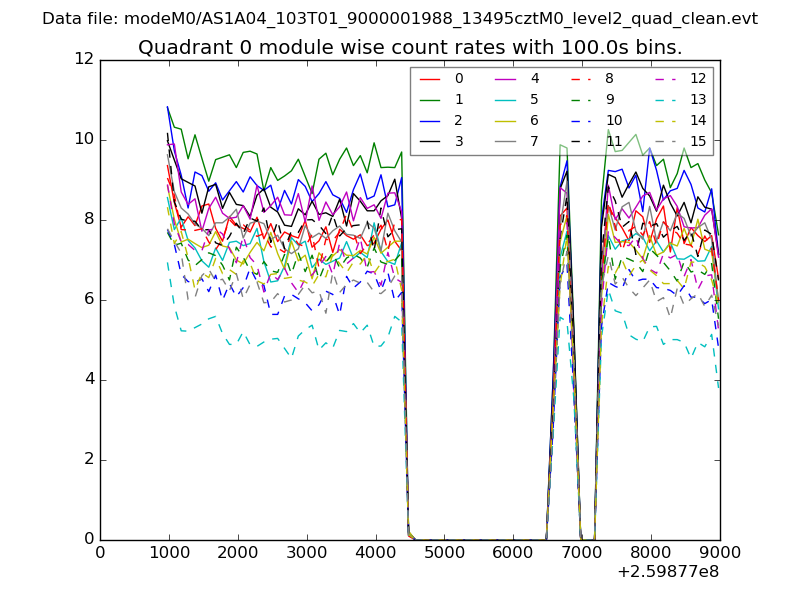 |
 |
| Module-wise count rates for Quadrant B Data is divided into 100 sec bins |
 |
 |
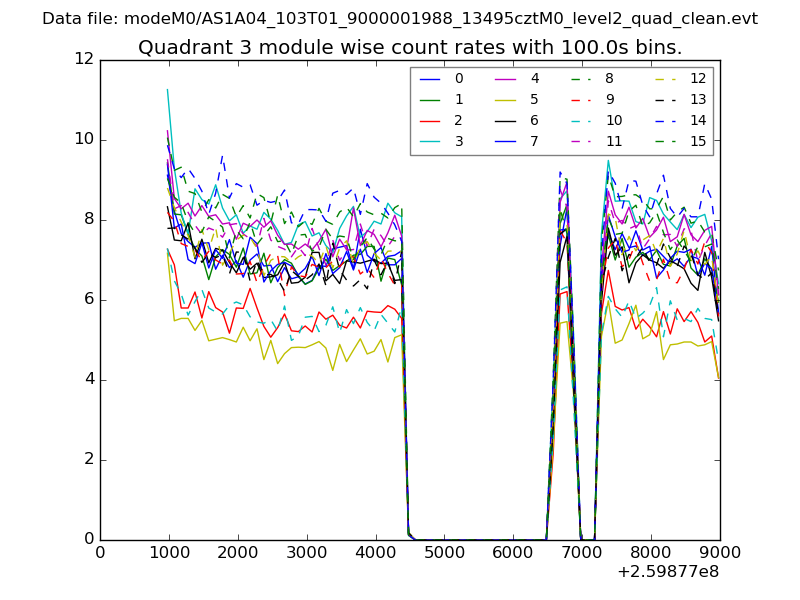
| Module-wise count rates for Quadrant C Data is divided into 100 sec bins |
 |
 |
| Module-wise count rates for Quadrant D Data is divided into 100 sec bins |
 |
 |
| Parameter | Plot |
|---|---|
| CZT HV Monitor | 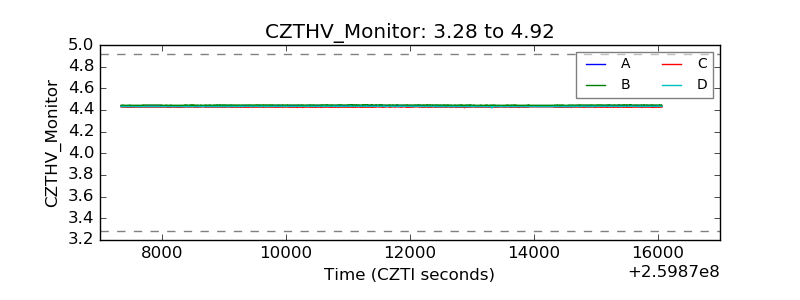 |
| D_VDD | 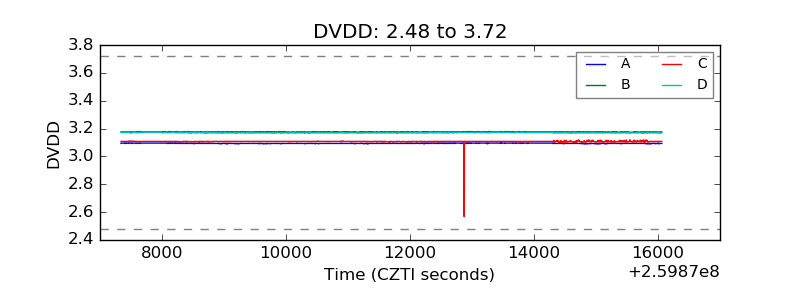 |
| Temperature 1 | 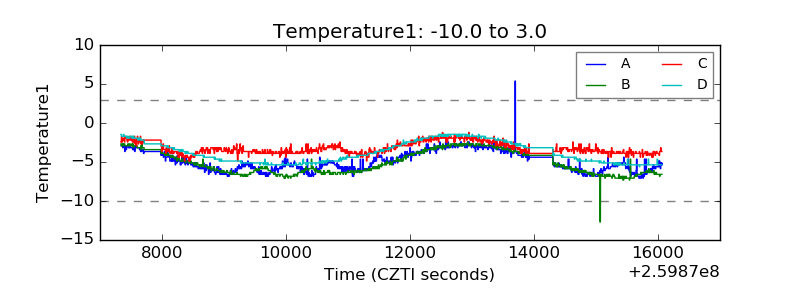 |
| Veto HV Monitor | 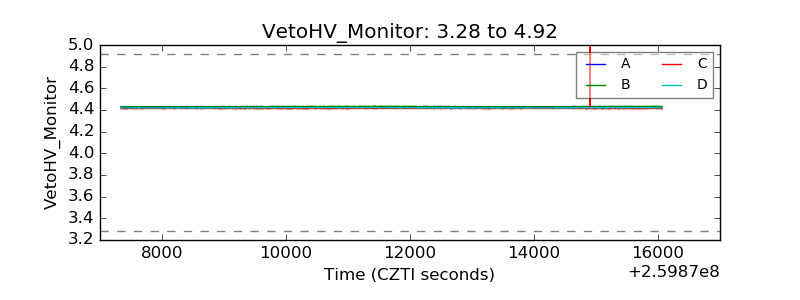 |
| Veto LLD |  |
| Alpha Counter | 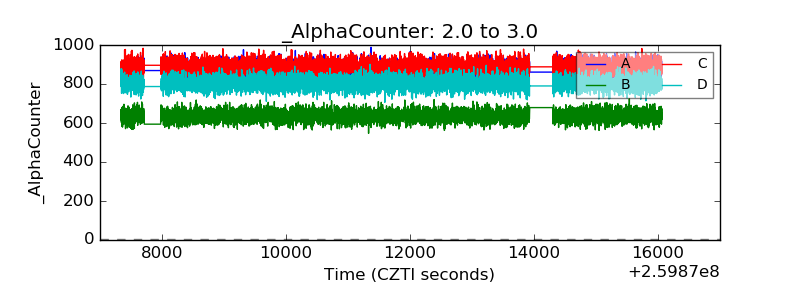 |
| _CPM_Rate | 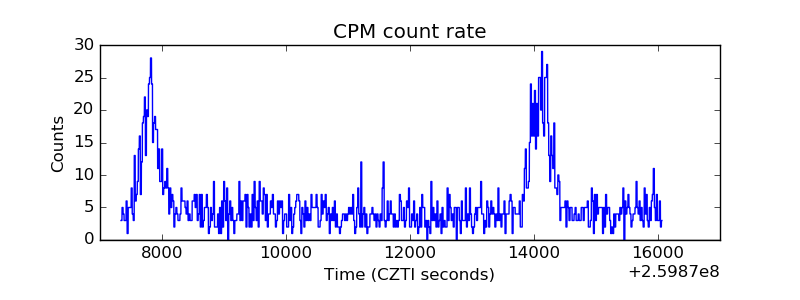 |
| CZT Counter |  |
| +2.5 Volts monitor |  |
| +5 Volts monitor | 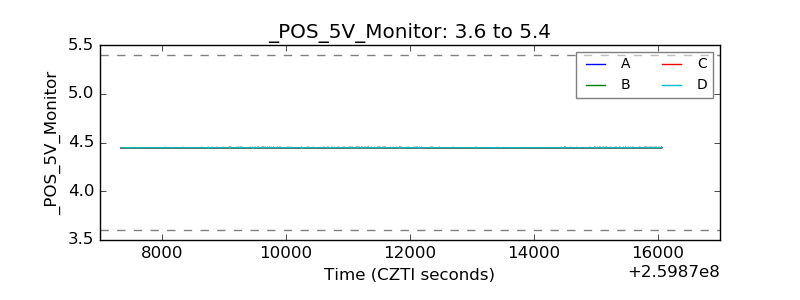 |
| _ROLL_ROT | 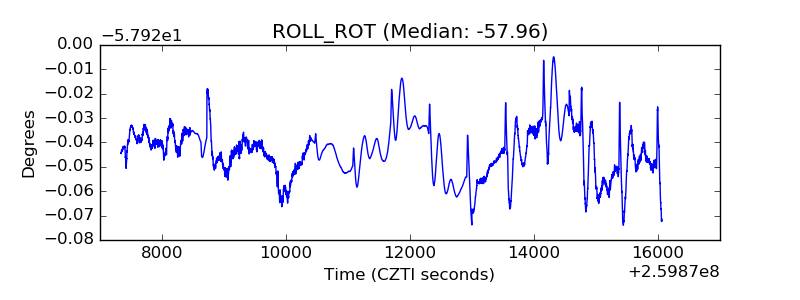 |
| _Roll_DEC | 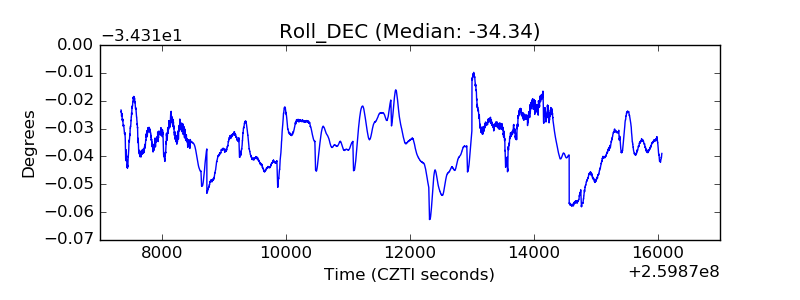 |
| _Roll_RA |  |
| Veto Counter | 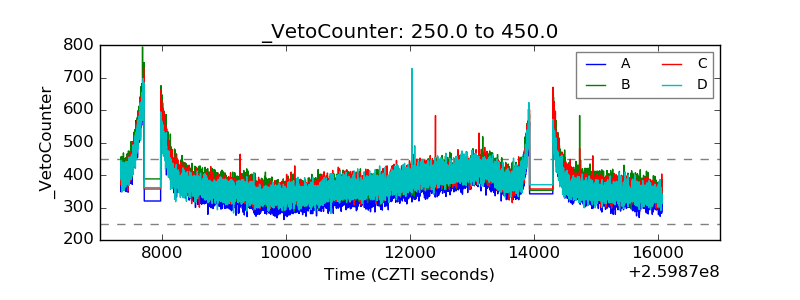 |