| Param | Original file | Final file |
|---|---|---|
| Filename | modeM0/AS1A04_103T01_9000001988_13498cztM0_level2.evt | modeM0/AS1A04_103T01_9000001988_13498cztM0_level2_quad_clean.evt |
| Size (bytes) | 2,657,661,120 | 516,980,160 |
| Size | 2.5 GB | 493.0 MB |
| Events in quadrant A | 18,691,332 | 3,268,994 |
| Events in quadrant B | 20,385,851 | 3,305,747 |
| Events in quadrant C | 18,725,450 | 3,237,143 |
| Events in quadrant D | 19,974,832 | 3,092,155 |
| Mode M0 | |||
|---|---|---|---|
| Quadrant | BADHDUFLAG | Total packets | Discarded packets |
| A | 0 | 82568 | 8 |
| B | 0 | 87236 | 7 |
| C | 0 | 82232 | 7 |
| D | 0 | 86820 | 7 |
| Mode SS | |||
|---|---|---|---|
| Quadrant | BADHDUFLAG | Total packets | Discarded packets |
| A | 0 | 816 | 0 |
| B | 0 | 816 | 0 |
| C | 0 | 816 | 0 |
| D | 0 | 816 | 0 |
| Mode M9 | |||
|---|---|---|---|
| Quadrant | BADHDUFLAG | Total packets | Discarded packets |
| A | 0 | 40 | 0 |
| B | 0 | 40 | 0 |
| C | 0 | 40 | 0 |
| D | 0 | 40 | 0 |
| Quadrant | Total seconds | Saturated seconds | Saturation percentage |
|---|---|---|---|
| A | 40128 | 241 | 0.600578% |
| B | 40128 | 644 | 1.604864% |
| C | 40128 | 209 | 0.520833% |
| D | 40128 | 273 | 0.680323% |
Noise dominated data is calculated using 1-second bins in cleaned event files. If a bin has >2000 counts, and if more than 50% of those come from <1% of pixels, then it is considered to be noise-dominated and hence unusable.
| Quadrant | # 1 sec bins | Bins with >0 counts | Bins with >2000 counts | High rate bins dominated by noise | Noise dominated (total time) | Noise dominated (detector-on time) | Marked lightcurve |
|---|---|---|---|---|---|---|---|
| A | 44169 | 40133 | 0 | 0 | 0.00% | 0.00% | 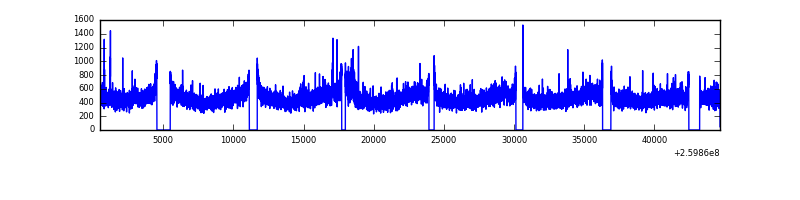 |
| B | 44169 | 40132 | 233 | 233 | 0.53% | 0.58% | 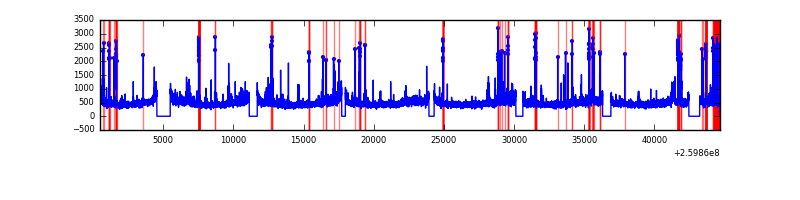 |
| C | 44169 | 40133 | 3 | 3 | 0.01% | 0.01% |  |
| D | 44169 | 40133 | 191 | 191 | 0.43% | 0.48% | 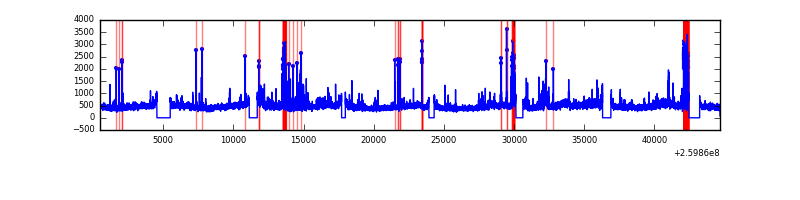 |
Top three noisy pixels from each quadrant. If the there are fewer than three noisy pixels in the level2.evt file, extra rows are filled as -1
| Pixel properties | Quadrant properties | ||||||
|---|---|---|---|---|---|---|---|
| Quadrant | DetID | PixID | Counts | Sigma | Mean | Median | Sigma |
| A | 8 | 15 | 279107 | 286.67 | 4744 | 4637 | 957.5 |
| A | 1 | 162 | 113992 | 114.21 | 4744 | 4637 | 957.5 |
| A | 0 | 226 | 41954 | 38.98 | 4744 | 4637 | 957.5 |
| B | 3 | 64 | 907101 | 1007.91 | 4745 | 4627 | 895.4 |
| B | 10 | 245 | 379027 | 418.14 | 4745 | 4627 | 895.4 |
| B | 4 | 173 | 202267 | 220.73 | 4745 | 4627 | 895.4 |
| C | 3 | 233 | 518791 | 479.9 | 4642 | 4669 | 1071.3 |
| C | 0 | 207 | 114842 | 102.84 | 4642 | 4669 | 1071.3 |
| C | 13 | 61 | 33811 | 27.2 | 4642 | 4669 | 1071.3 |
| D | 8 | 195 | 1414465 | 1287.93 | 4580 | 4456 | 1094.8 |
| D | 12 | 110 | 310709 | 279.74 | 4580 | 4456 | 1094.8 |
| D | 7 | 223 | 298434 | 268.52 | 4580 | 4456 | 1094.8 |
Histogram calculated using DETX and DETY for each event in the final _common_clean file
| Quadrant A |  |
 |
Quadrant B |
|---|---|---|---|
| Quadrant D |  |
 |
Quadrant C |
| Plot type | Count rate plots | Images |
|---|---|---|
| Comparison with Poisson distribution Blue bars denote a histogram of data divided into 1 sec bins. Red curve is a Poisson curve with rate = median count rate of data. |
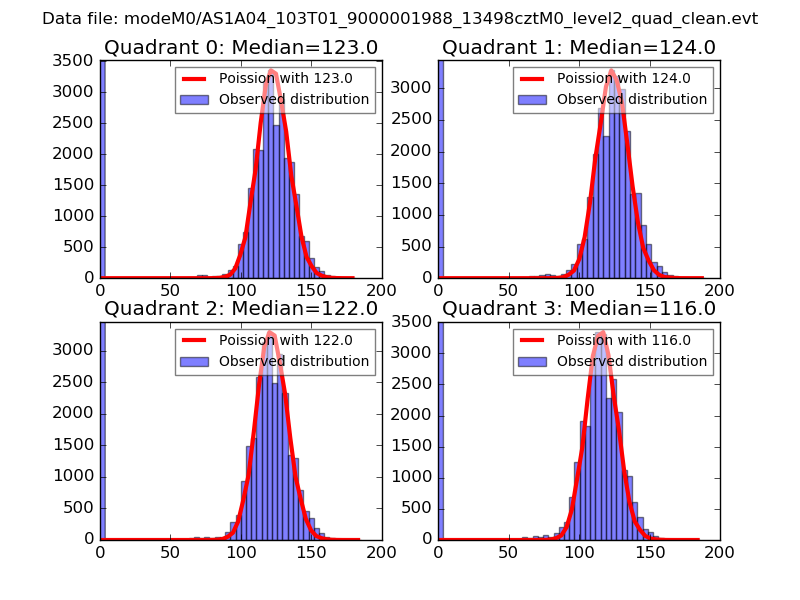 |
 |
| Quadrant-wise count rates Data is divided into 100 sec bins |
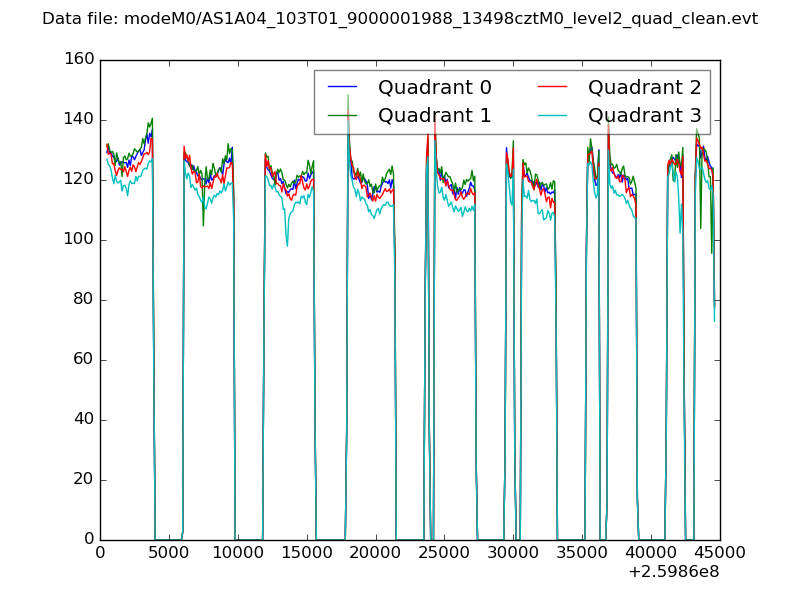 |
|
| Module-wise count rates for Quadrant A Data is divided into 100 sec bins |
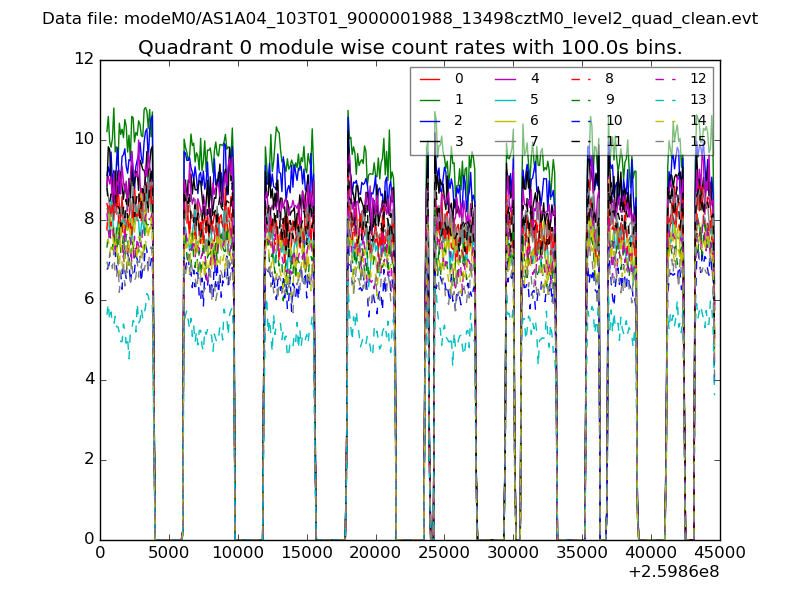 |
 |
| Module-wise count rates for Quadrant B Data is divided into 100 sec bins |
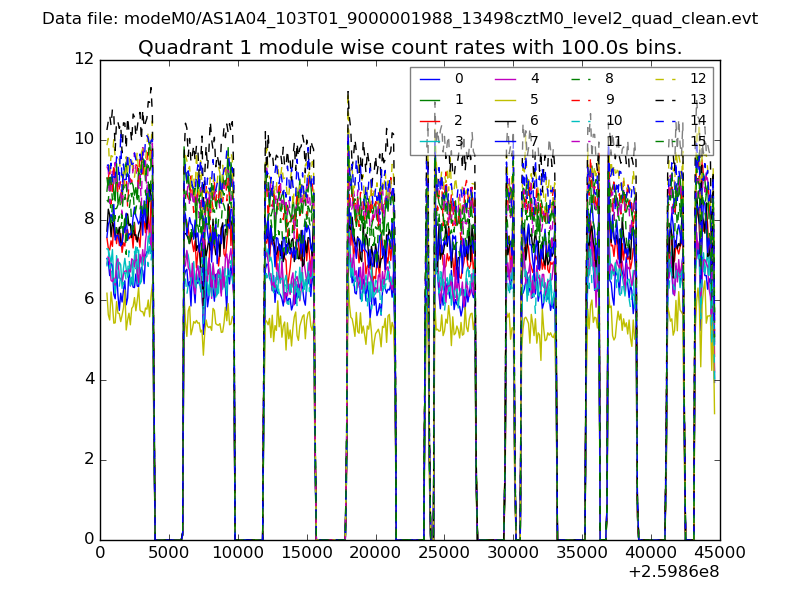 |
 |
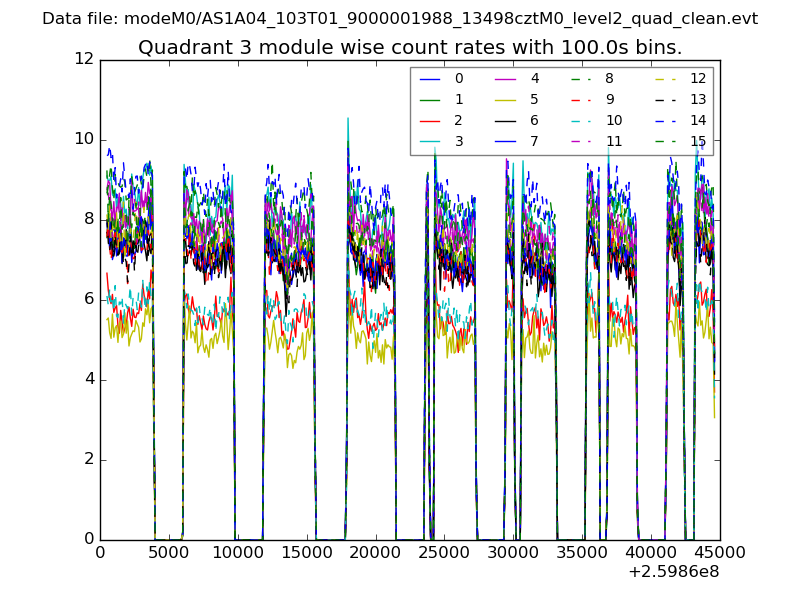
| Module-wise count rates for Quadrant C Data is divided into 100 sec bins |
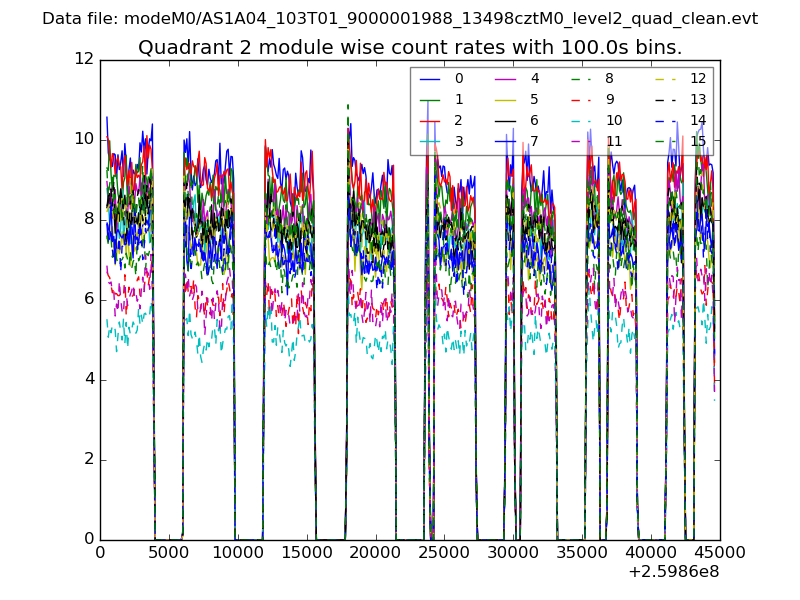 |
 |
| Module-wise count rates for Quadrant D Data is divided into 100 sec bins |
 |
 |
| Parameter | Plot |
|---|---|
| CZT HV Monitor | 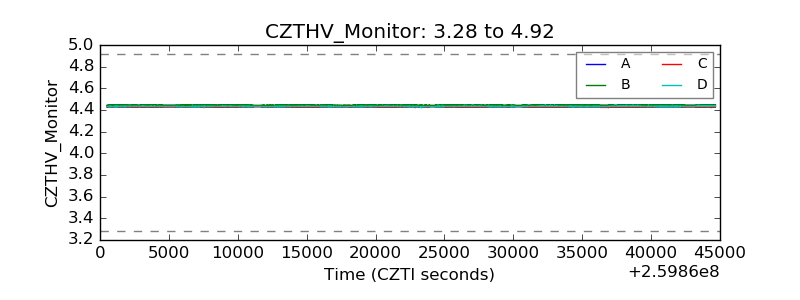 |
| D_VDD |  |
| Temperature 1 |  |
| Veto HV Monitor |  |
| Veto LLD |  |
| Alpha Counter | 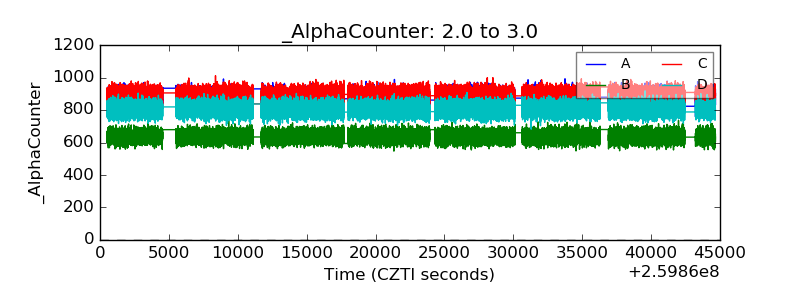 |
| _CPM_Rate | 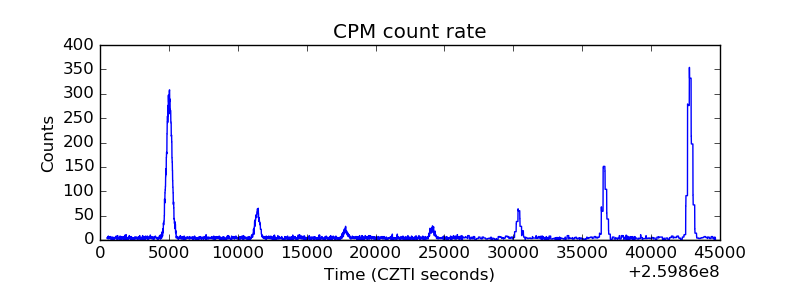 |
| CZT Counter |  |
| +2.5 Volts monitor |  |
| +5 Volts monitor |  |
| _ROLL_ROT |  |
| _Roll_DEC |  |
| _Roll_RA |  |
| Veto Counter | 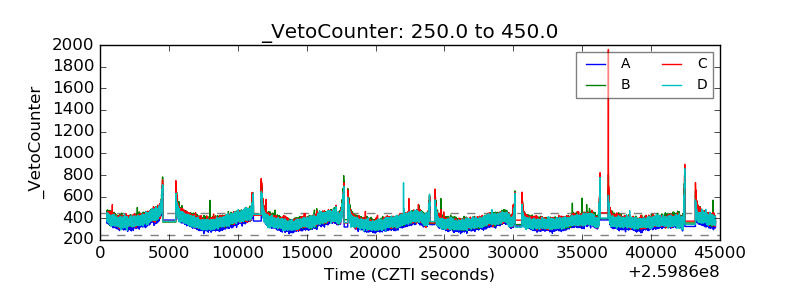 |