| Param | Original file | Final file |
|---|---|---|
| Filename | modeM0/AS1A04_103T01_9000001988_13499cztM0_level2.evt | modeM0/AS1A04_103T01_9000001988_13499cztM0_level2_quad_clean.evt |
| Size (bytes) | 466,136,640 | 86,325,120 |
| Size | 444.5 MB | 82.3 MB |
| Events in quadrant A | 3,016,774 | 548,294 |
| Events in quadrant B | 3,894,277 | 547,953 |
| Events in quadrant C | 3,071,886 | 548,839 |
| Events in quadrant D | 3,696,624 | 519,756 |
| Mode M0 | |||
|---|---|---|---|
| Quadrant | BADHDUFLAG | Total packets | Discarded packets |
| A | 0 | 13101 | 2 |
| B | 0 | 15736 | 1 |
| C | 0 | 13138 | 1 |
| D | 0 | 15369 | 1 |
| Mode SS | |||
|---|---|---|---|
| Quadrant | BADHDUFLAG | Total packets | Discarded packets |
| A | 0 | 130 | 0 |
| B | 0 | 130 | 0 |
| C | 0 | 130 | 0 |
| D | 0 | 130 | 0 |
| Mode M9 | |||
|---|---|---|---|
| Quadrant | BADHDUFLAG | Total packets | Discarded packets |
| A | 0 | 9 | 0 |
| B | 0 | 9 | 0 |
| C | 0 | 9 | 0 |
| D | 0 | 9 | 0 |
| Quadrant | Total seconds | Saturated seconds | Saturation percentage |
|---|---|---|---|
| A | 6442 | 65 | 1.009003% |
| B | 6442 | 224 | 3.477181% |
| C | 6442 | 58 | 0.900342% |
| D | 6442 | 72 | 1.117665% |
Noise dominated data is calculated using 1-second bins in cleaned event files. If a bin has >2000 counts, and if more than 50% of those come from <1% of pixels, then it is considered to be noise-dominated and hence unusable.
| Quadrant | # 1 sec bins | Bins with >0 counts | Bins with >2000 counts | High rate bins dominated by noise | Noise dominated (total time) | Noise dominated (detector-on time) | Marked lightcurve |
|---|---|---|---|---|---|---|---|
| A | 7343 | 6443 | 0 | 0 | 0.00% | 0.00% | 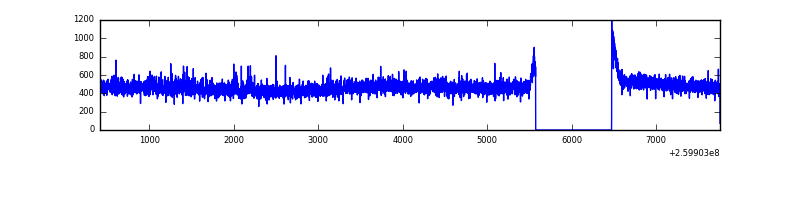 |
| B | 7343 | 6443 | 122 | 122 | 1.66% | 1.89% | 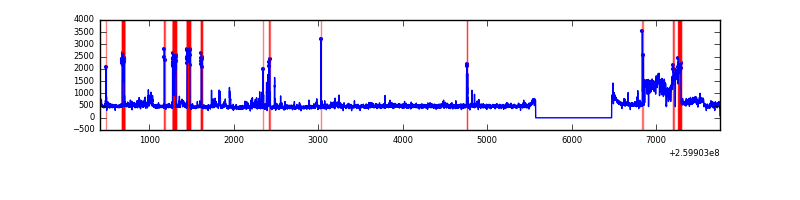 |
| C | 7343 | 6443 | 0 | 0 | 0.00% | 0.00% | 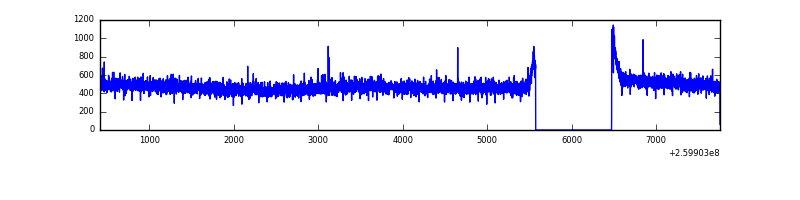 |
| D | 7343 | 6443 | 21 | 21 | 0.29% | 0.33% | 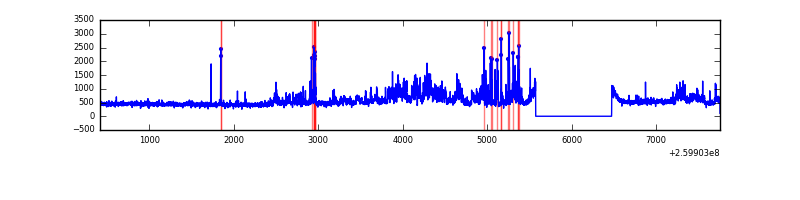 |
Top three noisy pixels from each quadrant. If the there are fewer than three noisy pixels in the level2.evt file, extra rows are filled as -1
| Pixel properties | Quadrant properties | ||||||
|---|---|---|---|---|---|---|---|
| Quadrant | DetID | PixID | Counts | Sigma | Mean | Median | Sigma |
| A | 1 | 162 | 23416 | 144.86 | 772 | 758 | 156.4 |
| A | 8 | 15 | 12623 | 75.86 | 772 | 758 | 156.4 |
| A | 1 | 178 | 7741 | 44.64 | 772 | 758 | 156.4 |
| B | 3 | 64 | 738515 | 5047.69 | 763 | 744 | 146.2 |
| B | 10 | 245 | 107679 | 731.63 | 763 | 744 | 146.2 |
| B | 4 | 173 | 29169 | 194.48 | 763 | 744 | 146.2 |
| C | 3 | 233 | 101661 | 573.62 | 760 | 765 | 175.9 |
| C | 0 | 207 | 5919 | 29.3 | 760 | 765 | 175.9 |
| C | 13 | 61 | 5436 | 26.56 | 760 | 765 | 175.9 |
| D | 8 | 195 | 692474 | 3844.23 | 749 | 729 | 179.9 |
| D | 12 | 110 | 95147 | 524.71 | 749 | 729 | 179.9 |
| D | 13 | 122 | 30766 | 166.92 | 749 | 729 | 179.9 |
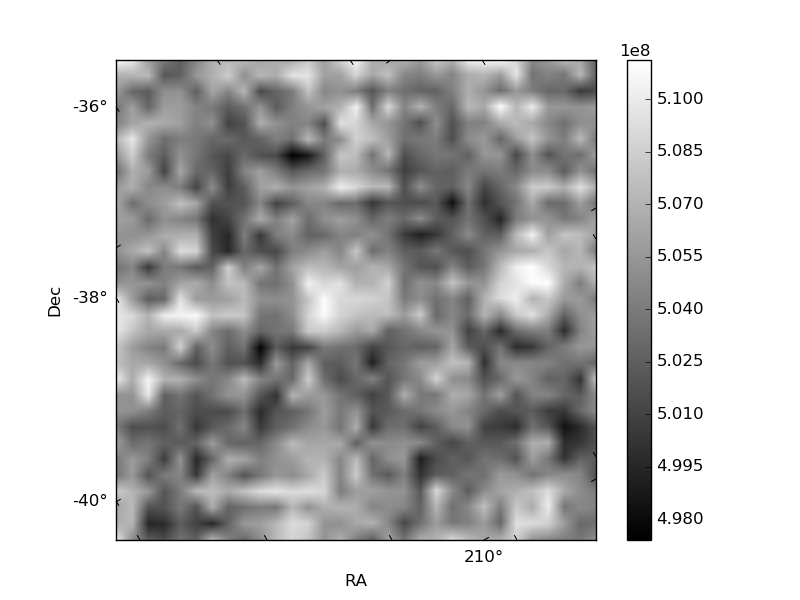
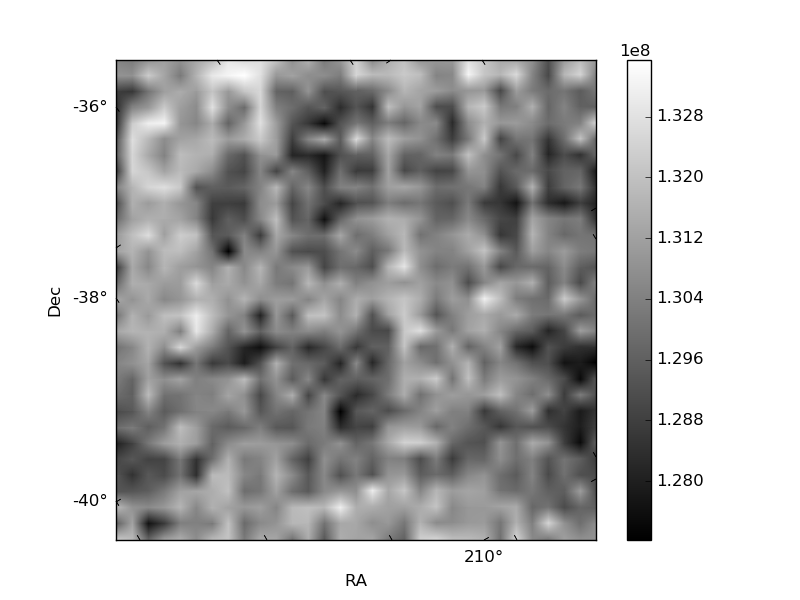
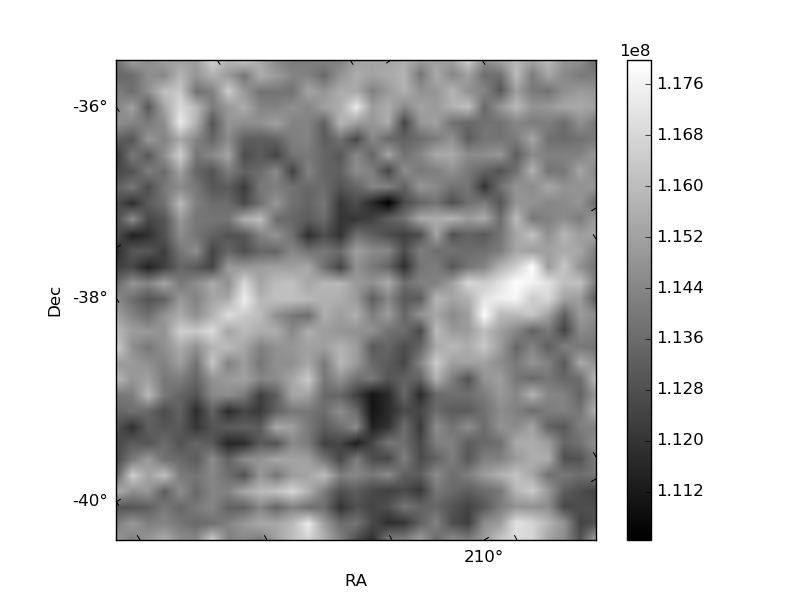
Histogram calculated using DETX and DETY for each event in the final _common_clean file
| Quadrant A | 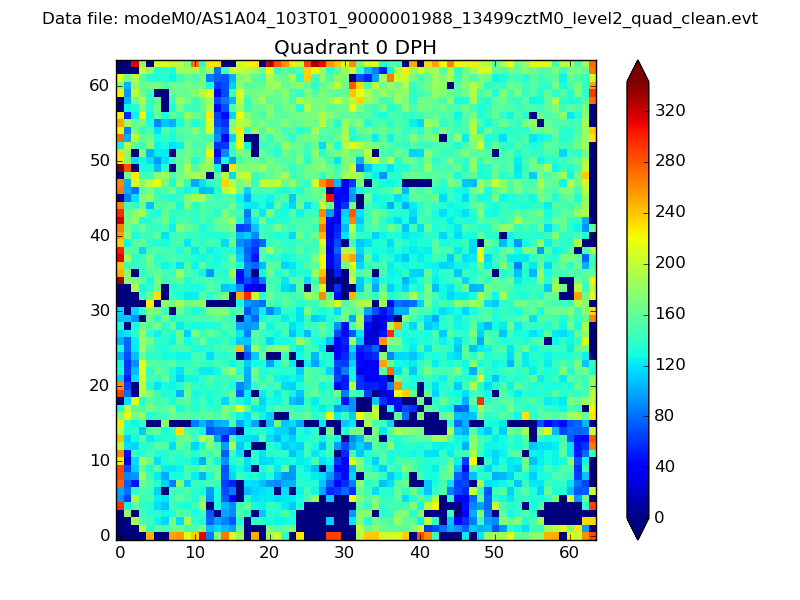 |
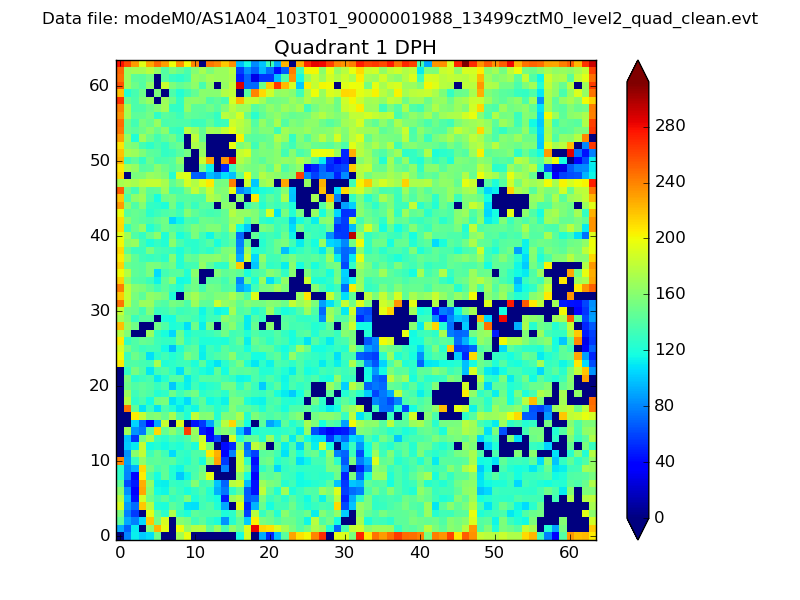 |
Quadrant B |
|---|---|---|---|
| Quadrant D | 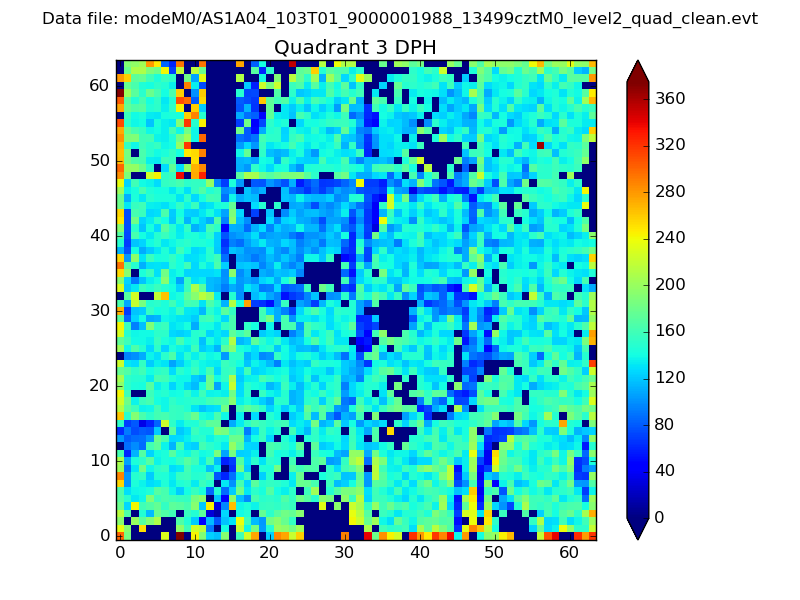 |
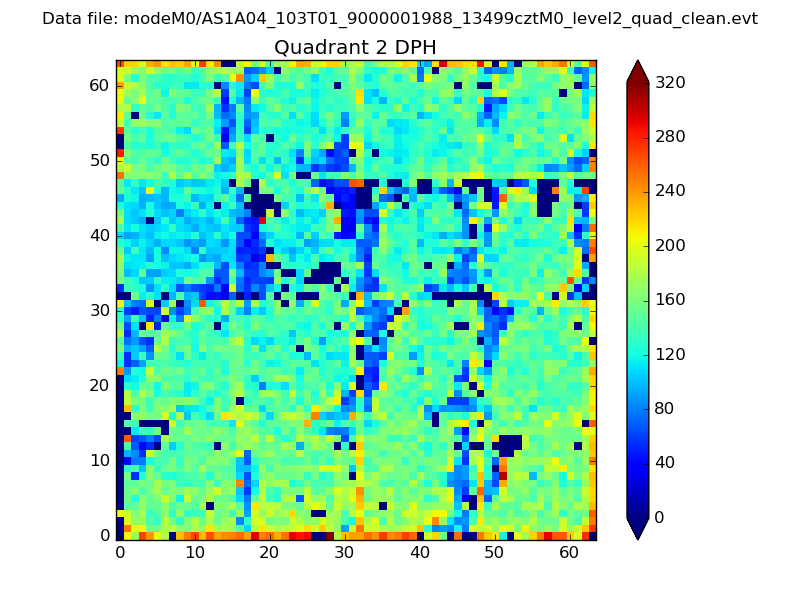 |
Quadrant C |
| Plot type | Count rate plots | Images |
|---|---|---|
| Comparison with Poisson distribution Blue bars denote a histogram of data divided into 1 sec bins. Red curve is a Poisson curve with rate = median count rate of data. |
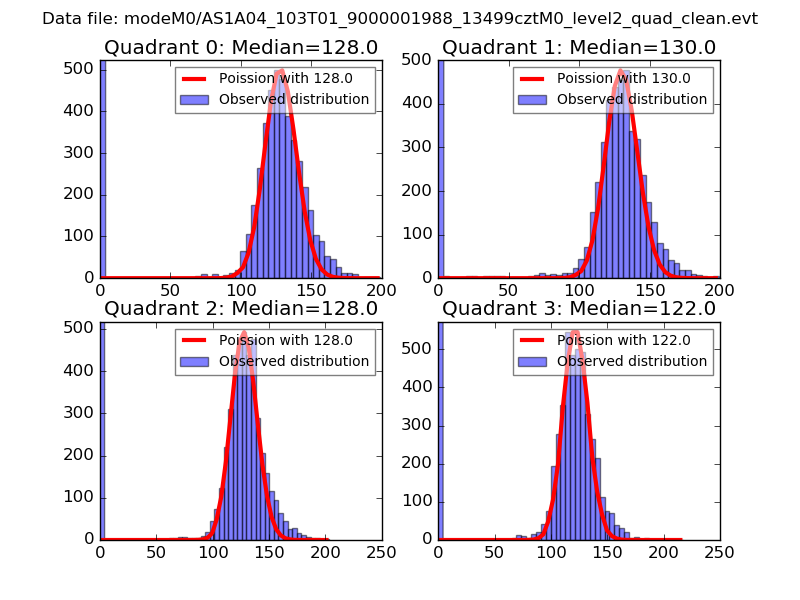 |
 |
| Quadrant-wise count rates Data is divided into 100 sec bins |
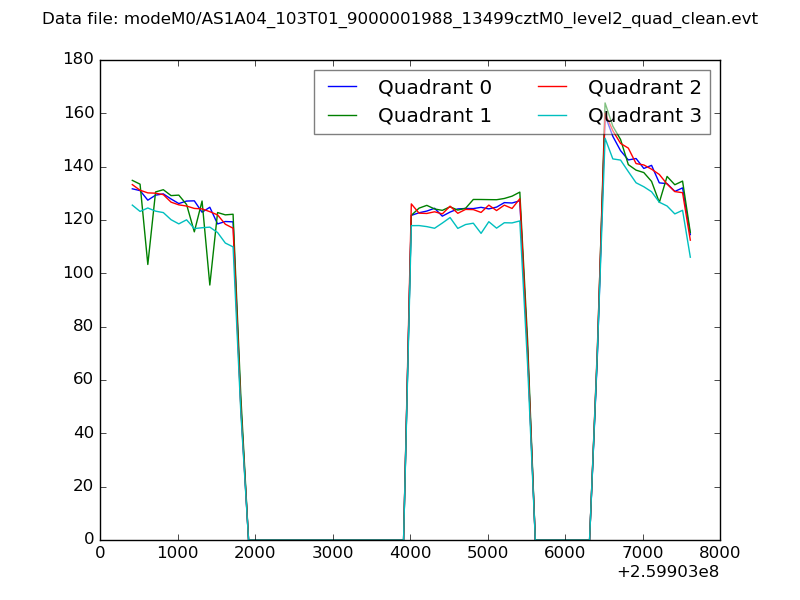 |
|
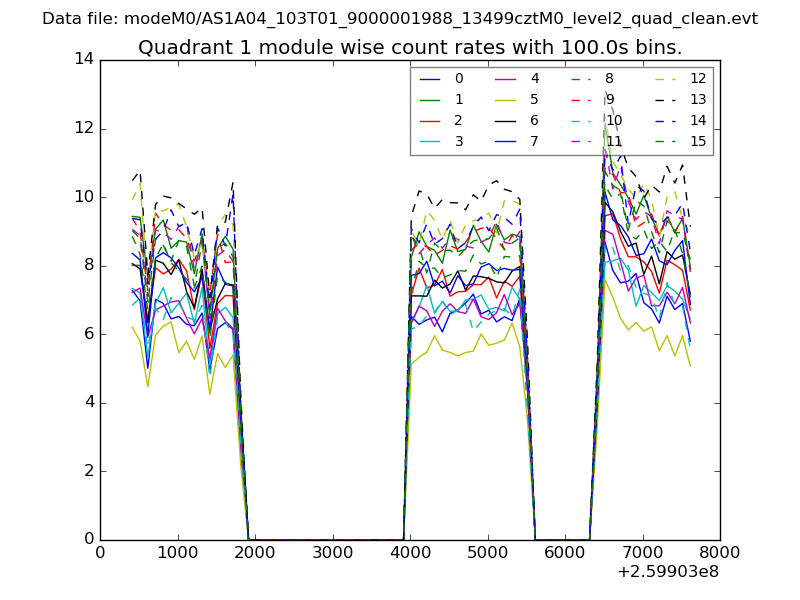
| Module-wise count rates for Quadrant A Data is divided into 100 sec bins |
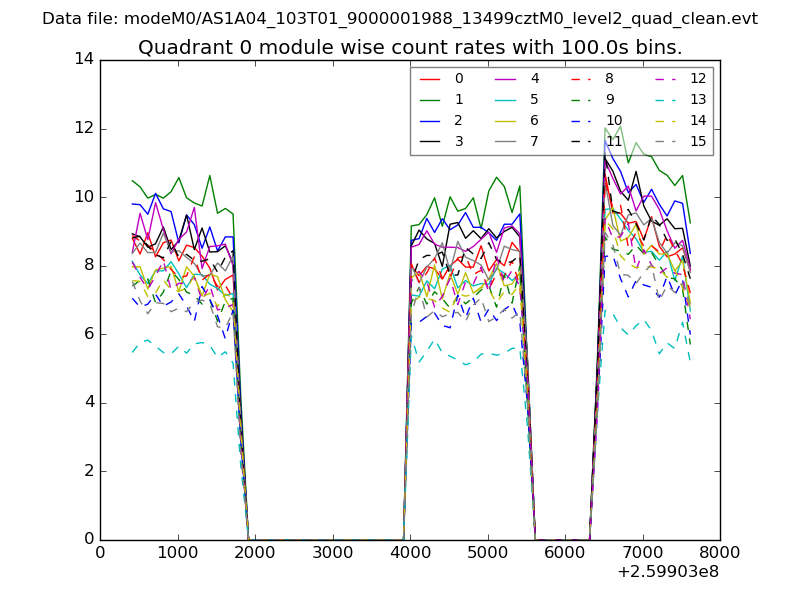 |
 |
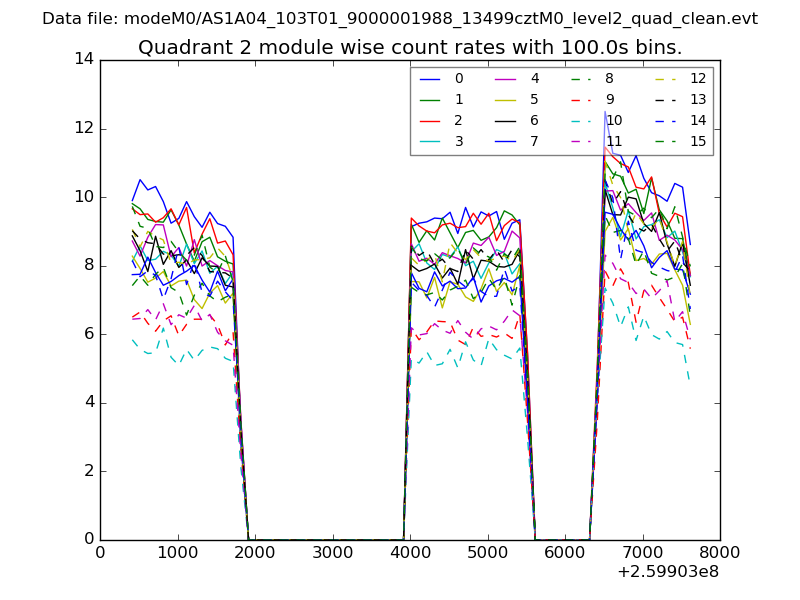
| Module-wise count rates for Quadrant B Data is divided into 100 sec bins |
 |
 |
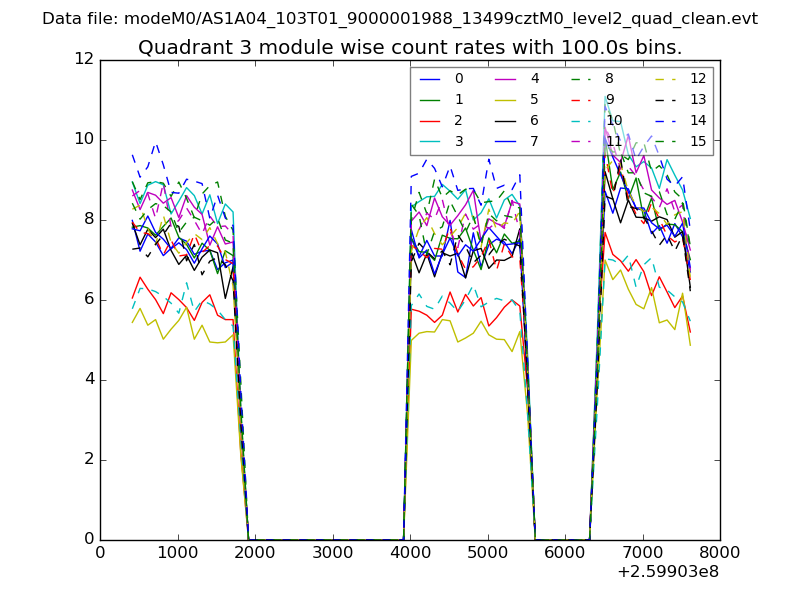
| Module-wise count rates for Quadrant C Data is divided into 100 sec bins |
 |
 |
| Module-wise count rates for Quadrant D Data is divided into 100 sec bins |
 |
 |
| Parameter | Plot |
|---|---|
| CZT HV Monitor | 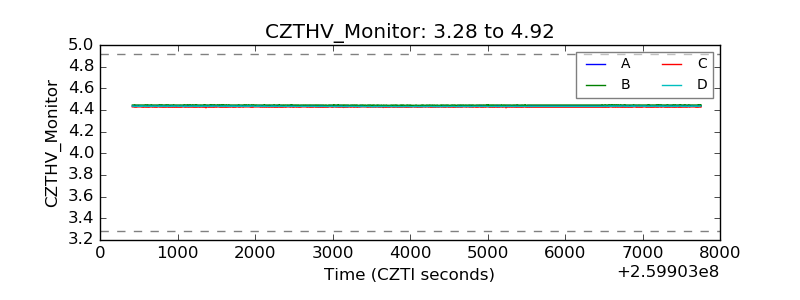 |
| D_VDD | 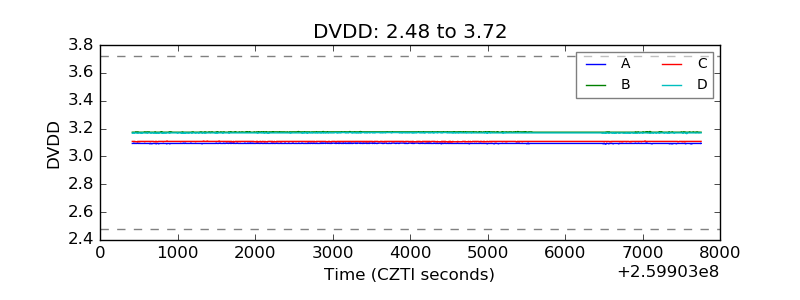 |
| Temperature 1 | 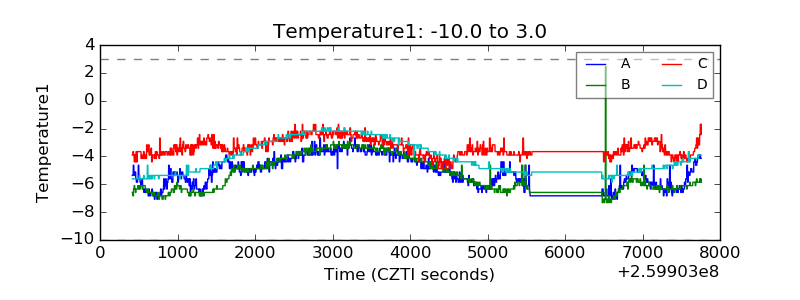 |
| Veto HV Monitor | 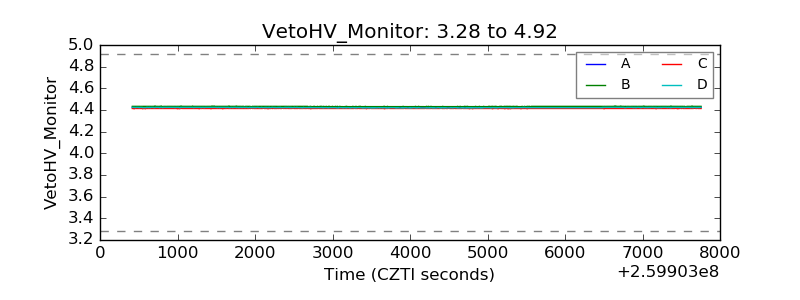 |
| Veto LLD | 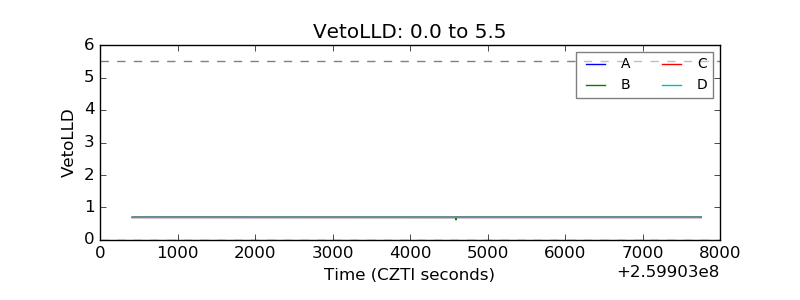 |
| Alpha Counter | 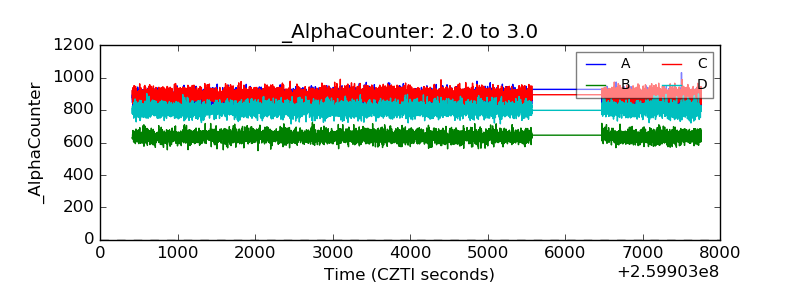 |
| _CPM_Rate | 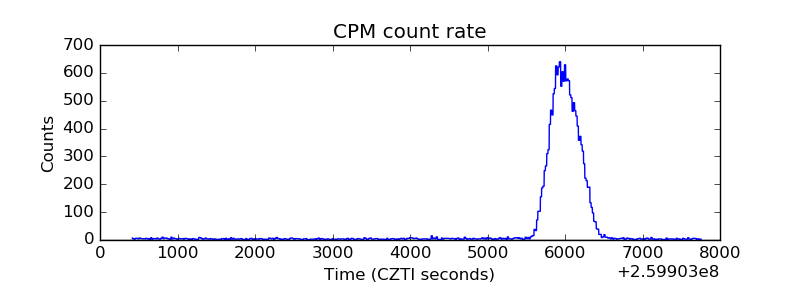 |
| CZT Counter | 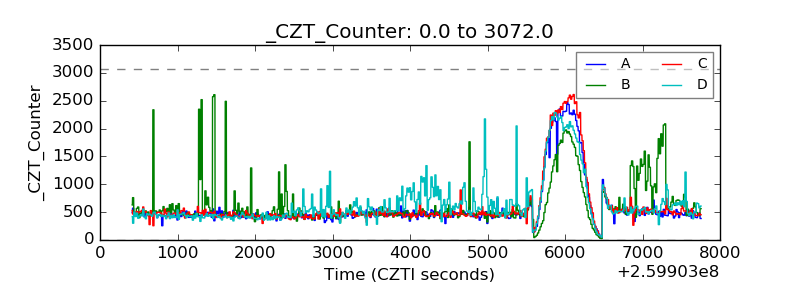 |
| +2.5 Volts monitor |  |
| +5 Volts monitor |  |
| _ROLL_ROT | 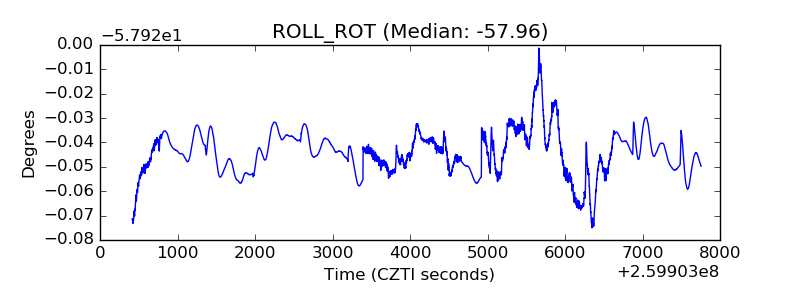 |
| _Roll_DEC |  |
| _Roll_RA | 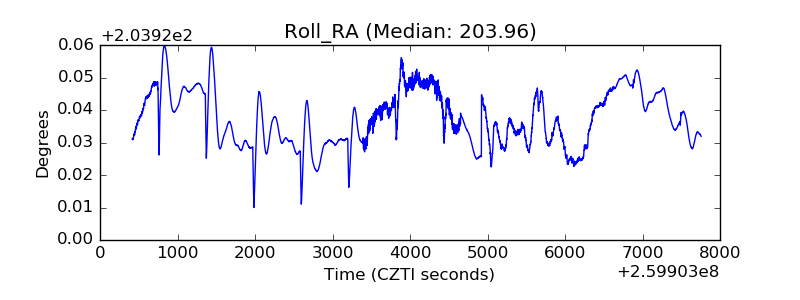 |
| Veto Counter | 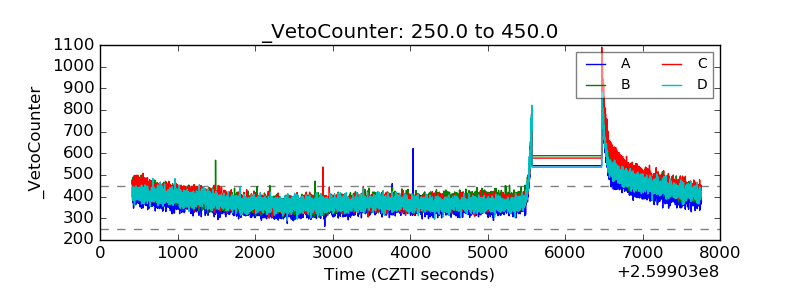 |