| Param | Original file | Final file |
|---|---|---|
| Filename | modeM0/AS1A04_103T01_9000001988_13501cztM0_level2.evt | modeM0/AS1A04_103T01_9000001988_13501cztM0_level2_quad_clean.evt |
| Size (bytes) | 522,754,560 | 84,859,200 |
| Size | 498.5 MB | 80.9 MB |
| Events in quadrant A | 3,617,152 | 532,124 |
| Events in quadrant B | 4,606,607 | 539,619 |
| Events in quadrant C | 3,345,975 | 533,982 |
| Events in quadrant D | 3,820,344 | 509,590 |
| Mode M0 | |||
|---|---|---|---|
| Quadrant | BADHDUFLAG | Total packets | Discarded packets |
| A | 0 | 15027 | 3 |
| B | 0 | 17936 | 2 |
| C | 0 | 14051 | 2 |
| D | 0 | 15588 | 2 |
| Mode SS | |||
|---|---|---|---|
| Quadrant | BADHDUFLAG | Total packets | Discarded packets |
| A | 0 | 136 | 0 |
| B | 0 | 136 | 0 |
| C | 0 | 136 | 0 |
| D | 0 | 136 | 0 |
| Mode M9 | |||
|---|---|---|---|
| Quadrant | BADHDUFLAG | Total packets | Discarded packets |
| A | 0 | 19 | 0 |
| B | 0 | 19 | 0 |
| C | 0 | 19 | 0 |
| D | 0 | 19 | 0 |
| Quadrant | Total seconds | Saturated seconds | Saturation percentage |
|---|---|---|---|
| A | 6507 | 110 | 1.690487% |
| B | 6507 | 347 | 5.332719% |
| C | 6507 | 103 | 1.582911% |
| D | 6507 | 86 | 1.321654% |
Noise dominated data is calculated using 1-second bins in cleaned event files. If a bin has >2000 counts, and if more than 50% of those come from <1% of pixels, then it is considered to be noise-dominated and hence unusable.
| Quadrant | # 1 sec bins | Bins with >0 counts | Bins with >2000 counts | High rate bins dominated by noise | Noise dominated (total time) | Noise dominated (detector-on time) | Marked lightcurve |
|---|---|---|---|---|---|---|---|
| A | 8488 | 6508 | 16 | 16 | 0.19% | 0.25% | 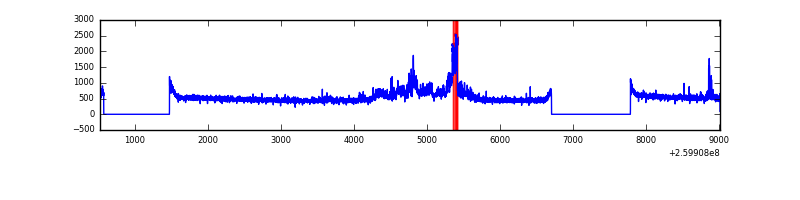 |
| B | 8488 | 6509 | 180 | 180 | 2.12% | 2.77% | 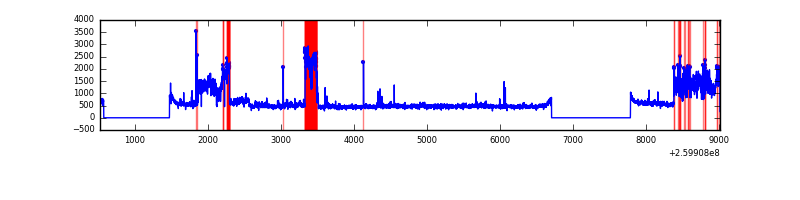 |
| C | 8488 | 6509 | 18 | 18 | 0.21% | 0.28% | 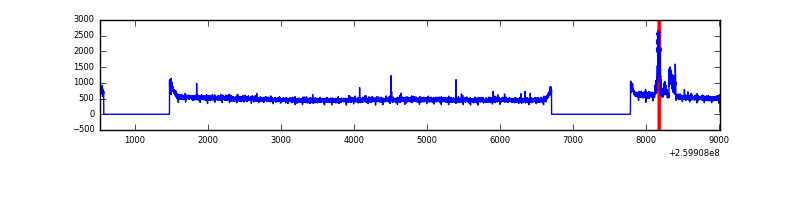 |
| D | 8488 | 6508 | 12 | 12 | 0.14% | 0.18% | 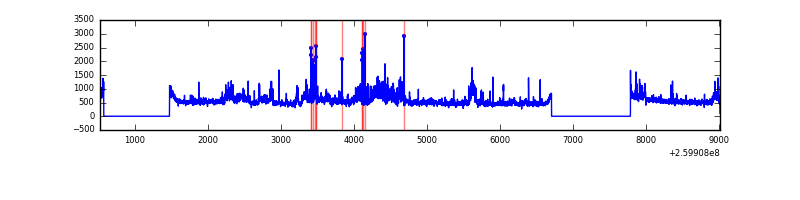 |
Top three noisy pixels from each quadrant. If the there are fewer than three noisy pixels in the level2.evt file, extra rows are filled as -1
| Pixel properties | Quadrant properties | ||||||
|---|---|---|---|---|---|---|---|
| Quadrant | DetID | PixID | Counts | Sigma | Mean | Median | Sigma |
| A | 14 | 238 | 449120 | 2750.97 | 811 | 794 | 163.0 |
| A | 8 | 15 | 21884 | 129.41 | 811 | 794 | 163.0 |
| A | 1 | 162 | 20024 | 118.0 | 811 | 794 | 163.0 |
| B | 3 | 64 | 1434237 | 9333.7 | 800 | 779 | 153.6 |
| B | 12 | 111 | 18246 | 113.73 | 800 | 779 | 153.6 |
| B | 10 | 245 | 17490 | 108.81 | 800 | 779 | 153.6 |
| C | 14 | 220 | 135964 | 733.83 | 798 | 803 | 184.2 |
| C | 3 | 233 | 91836 | 494.25 | 798 | 803 | 184.2 |
| C | 13 | 61 | 5599 | 26.04 | 798 | 803 | 184.2 |
| D | 8 | 195 | 661074 | 3474.57 | 789 | 765 | 190.0 |
| D | 11 | 129 | 125449 | 656.09 | 789 | 765 | 190.0 |
| D | 13 | 122 | 20591 | 104.33 | 789 | 765 | 190.0 |
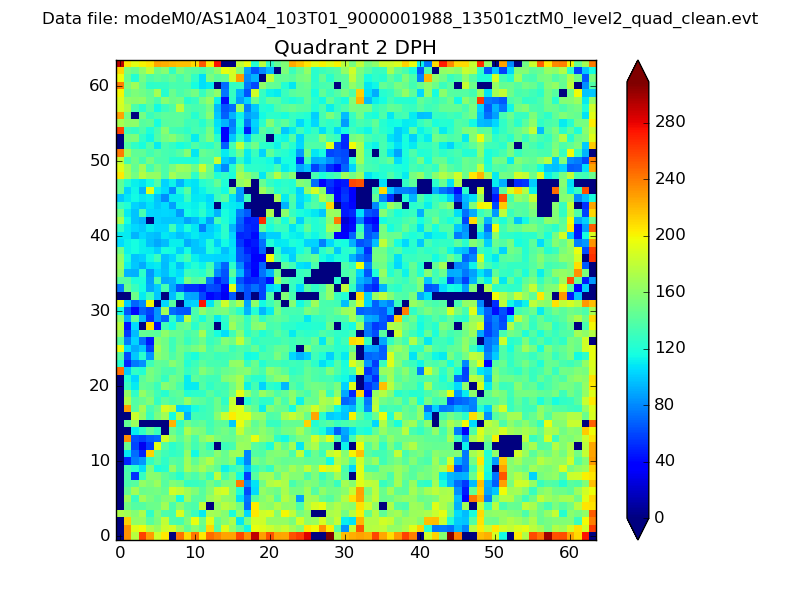
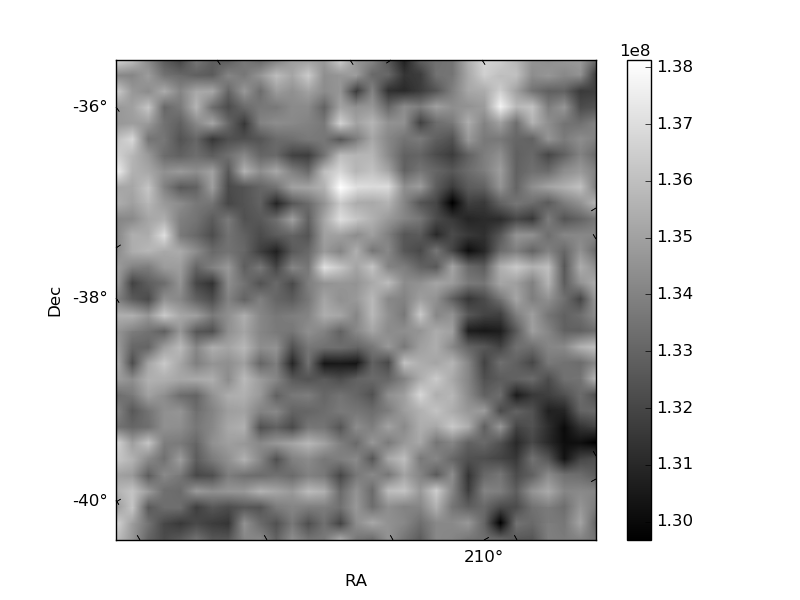
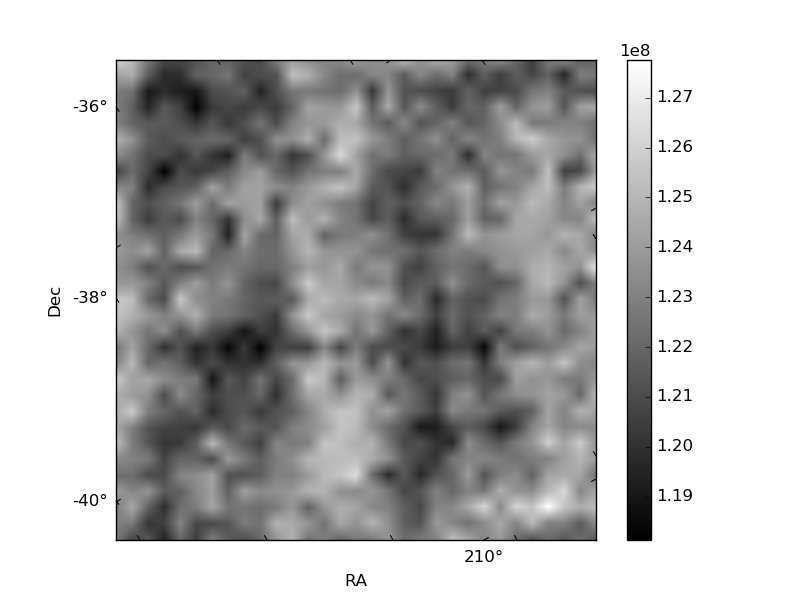
Histogram calculated using DETX and DETY for each event in the final _common_clean file
| Quadrant A | 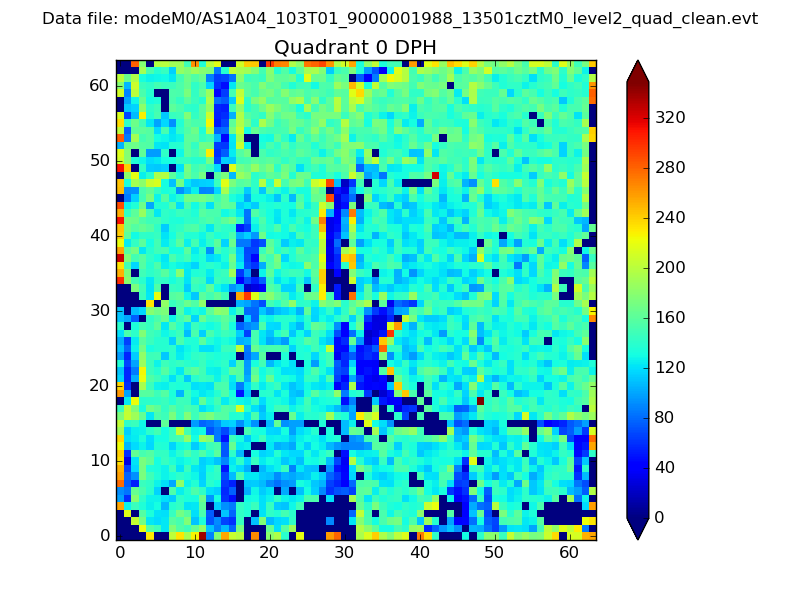 |
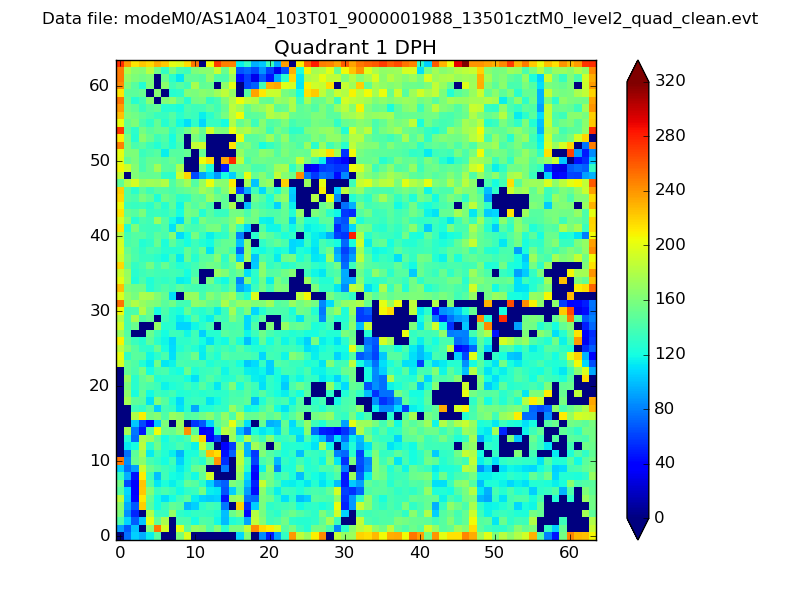 |
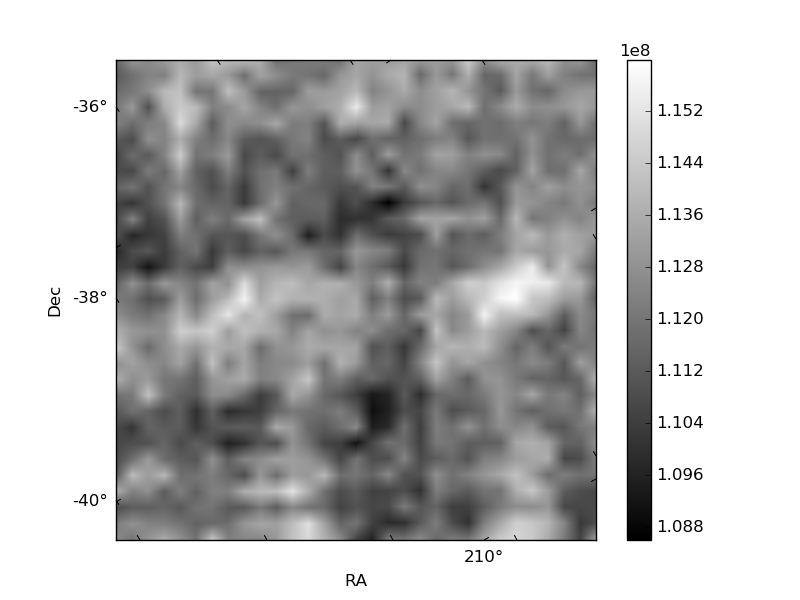
Quadrant B |
|---|---|---|---|
| Quadrant D | 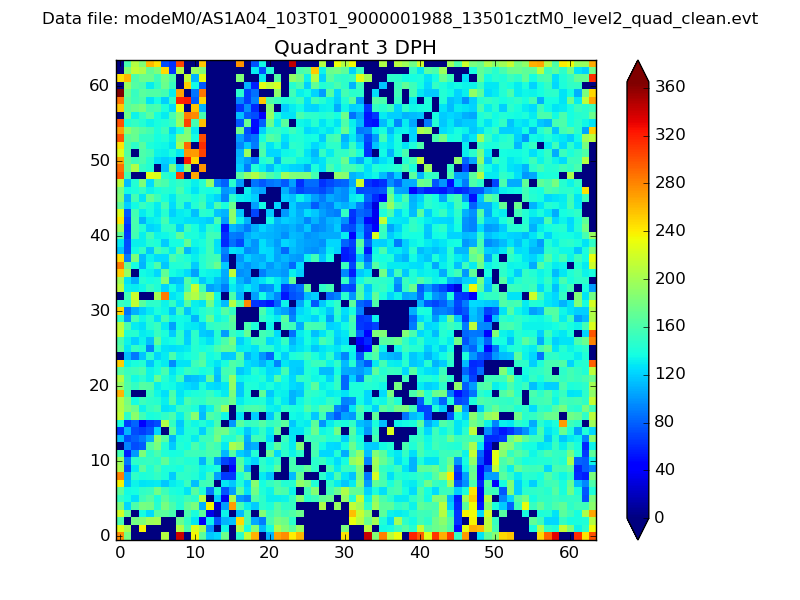 |
 |
Quadrant C |
| Plot type | Count rate plots | Images |
|---|---|---|
| Comparison with Poisson distribution Blue bars denote a histogram of data divided into 1 sec bins. Red curve is a Poisson curve with rate = median count rate of data. |
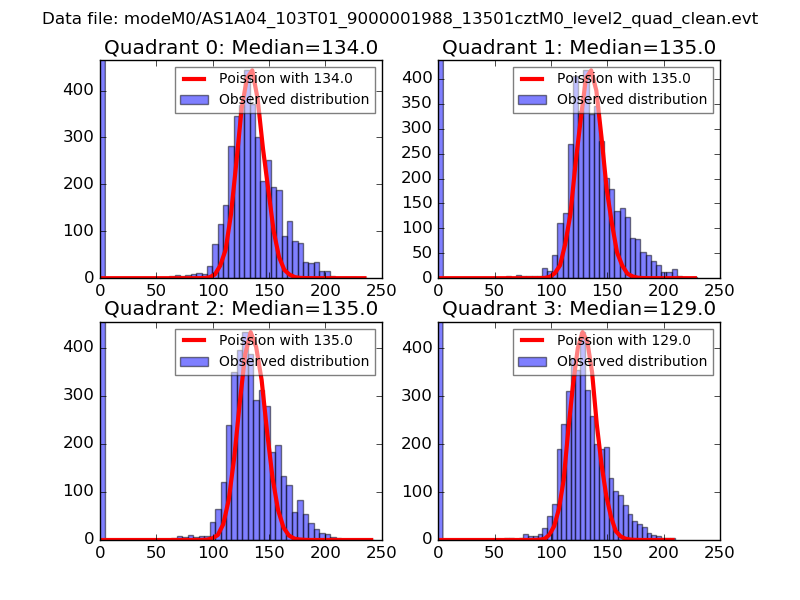 |
 |
| Quadrant-wise count rates Data is divided into 100 sec bins |
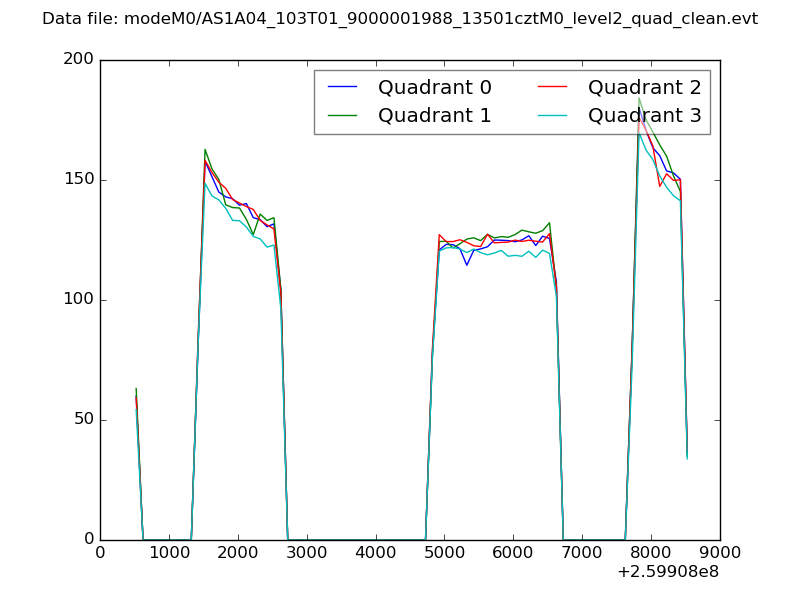 |
|
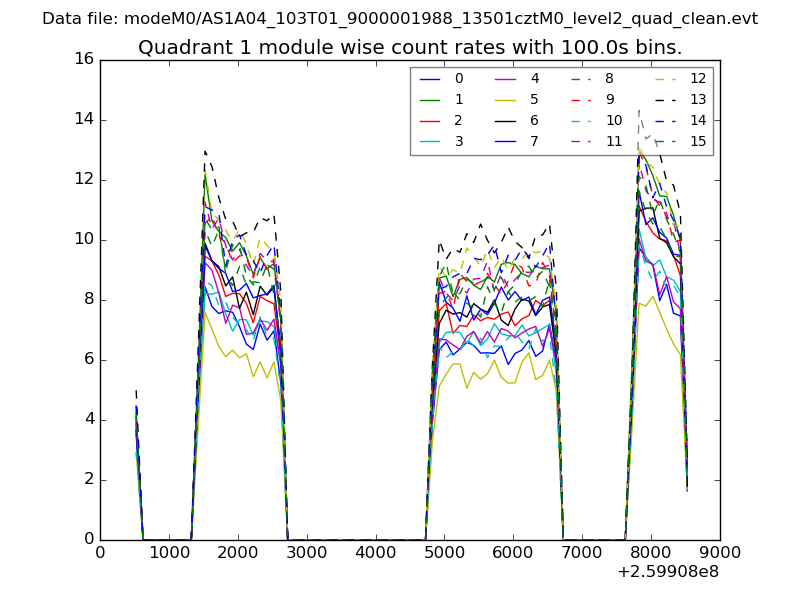
| Module-wise count rates for Quadrant A Data is divided into 100 sec bins |
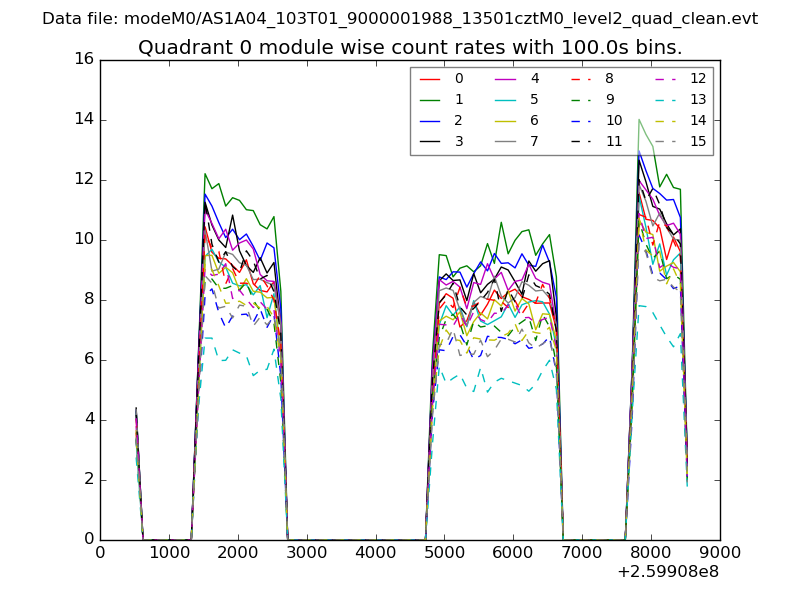 |
 |
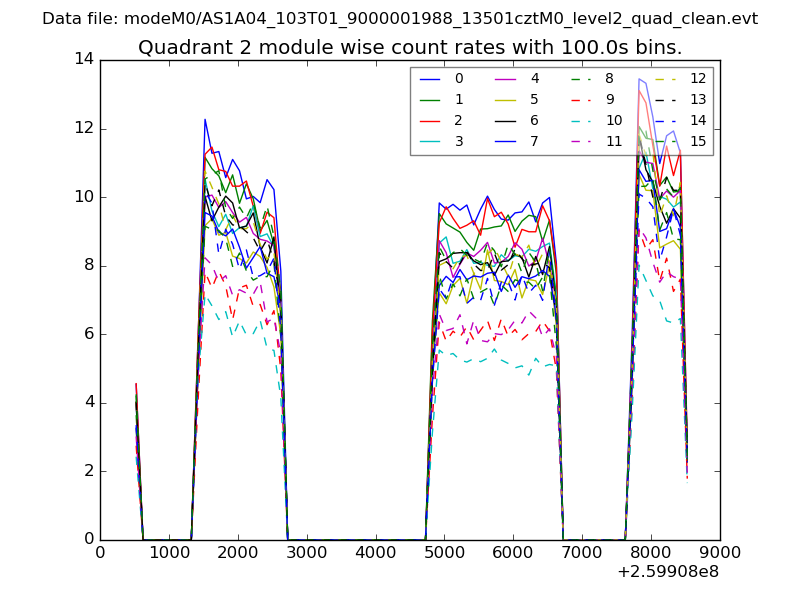
| Module-wise count rates for Quadrant B Data is divided into 100 sec bins |
 |
 |
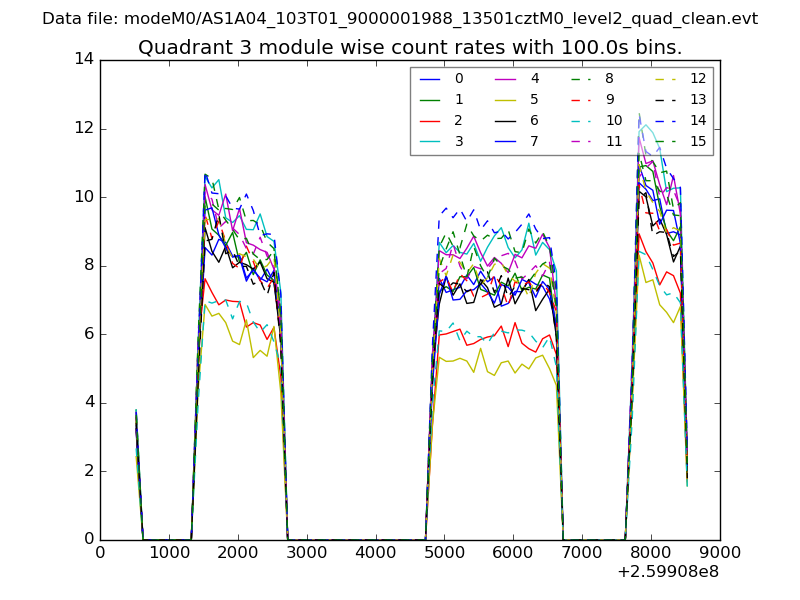
| Module-wise count rates for Quadrant C Data is divided into 100 sec bins |
 |
 |
| Module-wise count rates for Quadrant D Data is divided into 100 sec bins |
 |
 |
| Parameter | Plot |
|---|---|
| CZT HV Monitor | 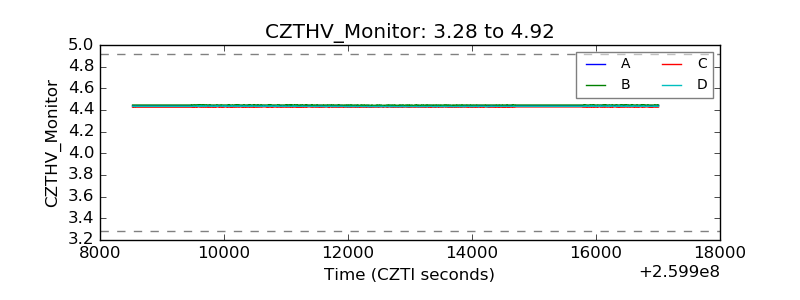 |
| D_VDD |  |
| Temperature 1 | 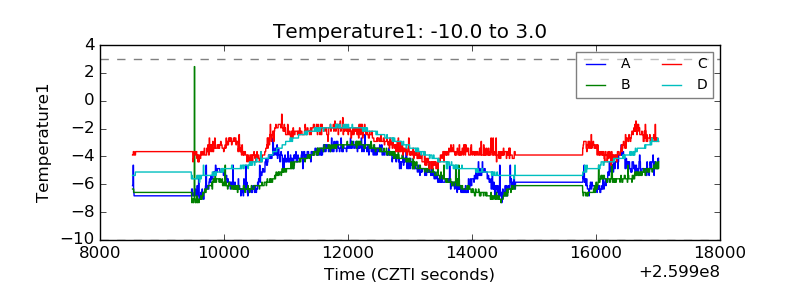 |
| Veto HV Monitor | 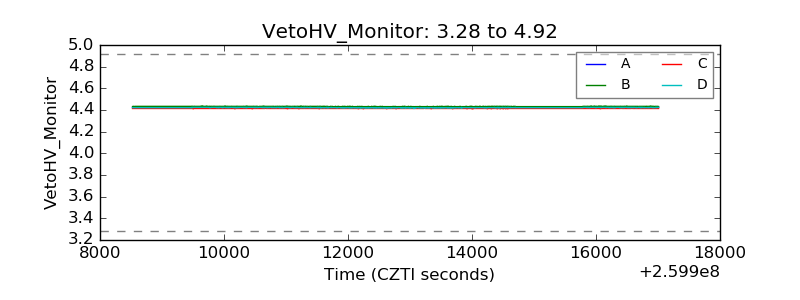 |
| Veto LLD | 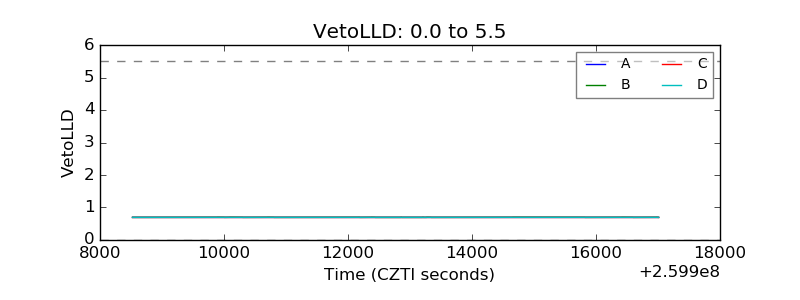 |
| Alpha Counter |  |
| _CPM_Rate | 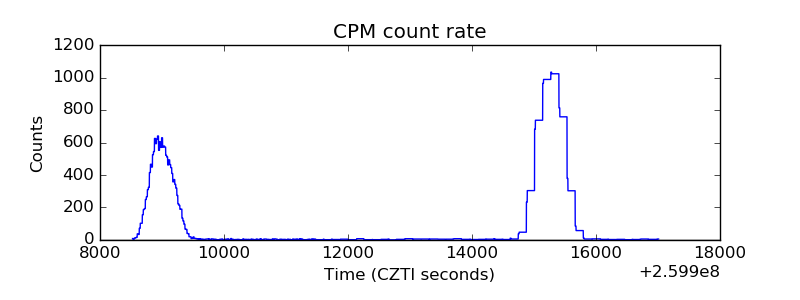 |
| CZT Counter | 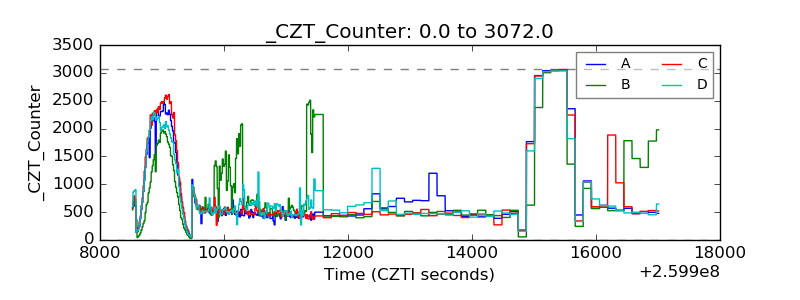 |
| +2.5 Volts monitor |  |
| +5 Volts monitor |  |
| _ROLL_ROT | 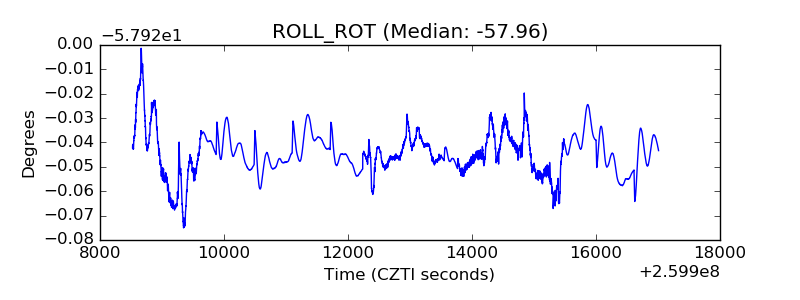 |
| _Roll_DEC | 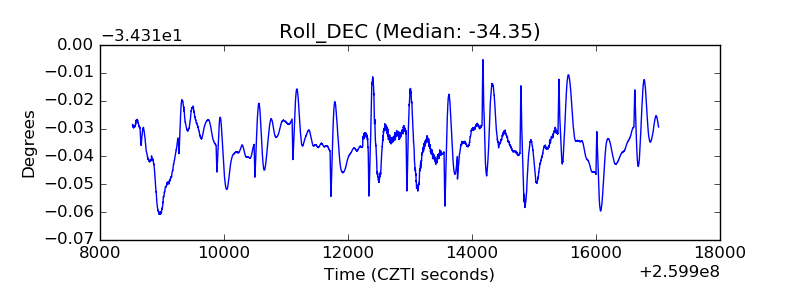 |
| _Roll_RA |  |
| Veto Counter | 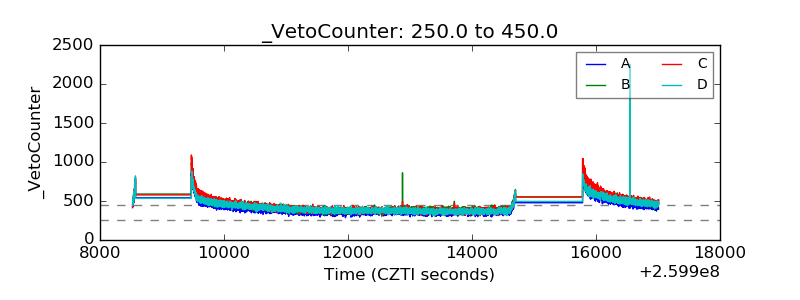 |