| Param | Original file | Final file |
|---|---|---|
| Filename | modeM0/AS1A04_103T01_9000001988_13502cztM0_level2.evt | modeM0/AS1A04_103T01_9000001988_13502cztM0_level2_quad_clean.evt |
| Size (bytes) | 589,368,960 | 74,761,920 |
| Size | 562.1 MB | 71.3 MB |
| Events in quadrant A | 3,285,347 | 466,310 |
| Events in quadrant B | 6,999,045 | 443,222 |
| Events in quadrant C | 3,393,504 | 466,461 |
| Events in quadrant D | 3,739,093 | 442,140 |
| Mode M0 | |||
|---|---|---|---|
| Quadrant | BADHDUFLAG | Total packets | Discarded packets |
| A | 0 | 13684 | 3 |
| B | 0 | 25075 | 2 |
| C | 0 | 14153 | 2 |
| D | 0 | 15235 | 2 |
| Mode SS | |||
|---|---|---|---|
| Quadrant | BADHDUFLAG | Total packets | Discarded packets |
| A | 0 | 130 | 0 |
| B | 0 | 130 | 0 |
| C | 0 | 130 | 0 |
| D | 0 | 130 | 0 |
| Mode M9 | |||
|---|---|---|---|
| Quadrant | BADHDUFLAG | Total packets | Discarded packets |
| A | 0 | 15 | 0 |
| B | 0 | 15 | 0 |
| C | 0 | 15 | 0 |
| D | 0 | 16 | 0 |
| Quadrant | Total seconds | Saturated seconds | Saturation percentage |
|---|---|---|---|
| A | 6382 | 63 | 0.987151% |
| B | 6382 | 1076 | 16.859919% |
| C | 6382 | 86 | 1.347540% |
| D | 6382 | 116 | 1.817612% |
Noise dominated data is calculated using 1-second bins in cleaned event files. If a bin has >2000 counts, and if more than 50% of those come from <1% of pixels, then it is considered to be noise-dominated and hence unusable.
| Quadrant | # 1 sec bins | Bins with >0 counts | Bins with >2000 counts | High rate bins dominated by noise | Noise dominated (total time) | Noise dominated (detector-on time) | Marked lightcurve |
|---|---|---|---|---|---|---|---|
| A | 7558 | 6383 | 1 | 1 | 0.01% | 0.02% | 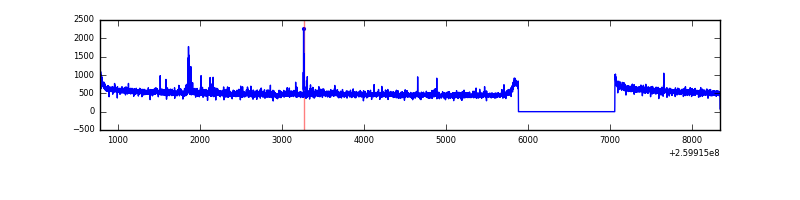 |
| B | 7558 | 6383 | 812 | 812 | 10.74% | 12.72% |  |
| C | 7558 | 6383 | 22 | 22 | 0.29% | 0.34% | 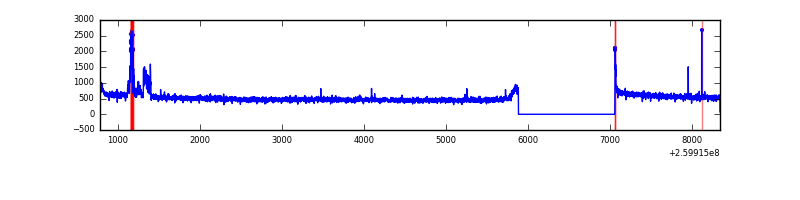 |
| D | 7558 | 6383 | 55 | 55 | 0.73% | 0.86% |  |
Top three noisy pixels from each quadrant. If the there are fewer than three noisy pixels in the level2.evt file, extra rows are filled as -1
| Pixel properties | Quadrant properties | ||||||
|---|---|---|---|---|---|---|---|
| Quadrant | DetID | PixID | Counts | Sigma | Mean | Median | Sigma |
| A | 14 | 238 | 38025 | 223.61 | 825 | 809 | 166.4 |
| A | 1 | 162 | 32282 | 189.1 | 825 | 809 | 166.4 |
| A | 8 | 15 | 21550 | 124.62 | 825 | 809 | 166.4 |
| B | 3 | 64 | 3794175 | 25825.97 | 790 | 771 | 146.9 |
| B | 10 | 245 | 64145 | 431.45 | 790 | 771 | 146.9 |
| B | 4 | 142 | 19450 | 127.17 | 790 | 771 | 146.9 |
| C | 14 | 220 | 135682 | 730.21 | 809 | 816 | 184.7 |
| C | 3 | 233 | 90197 | 483.94 | 809 | 816 | 184.7 |
| C | 6 | 253 | 9539 | 47.23 | 809 | 816 | 184.7 |
| D | 8 | 195 | 381677 | 1994.64 | 800 | 779 | 191.0 |
| D | 11 | 129 | 147627 | 769.0 | 800 | 779 | 191.0 |
| D | 12 | 110 | 63451 | 328.19 | 800 | 779 | 191.0 |
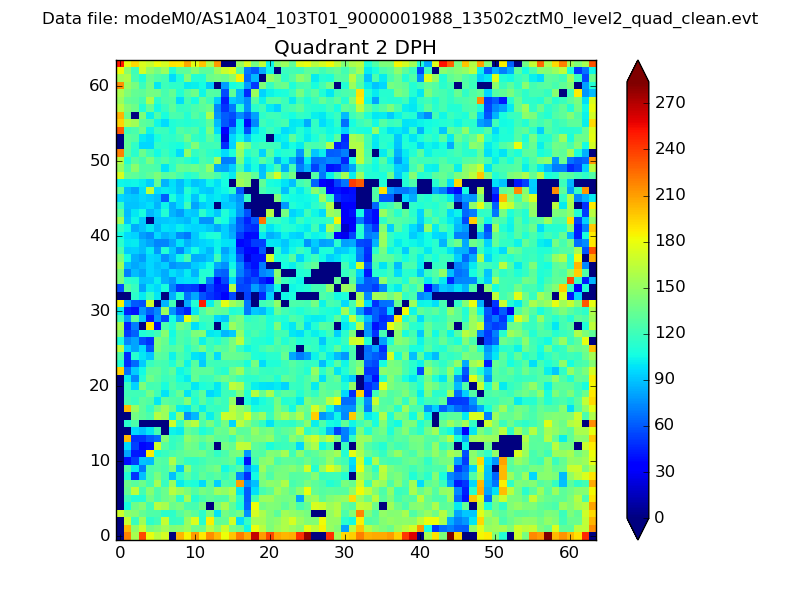
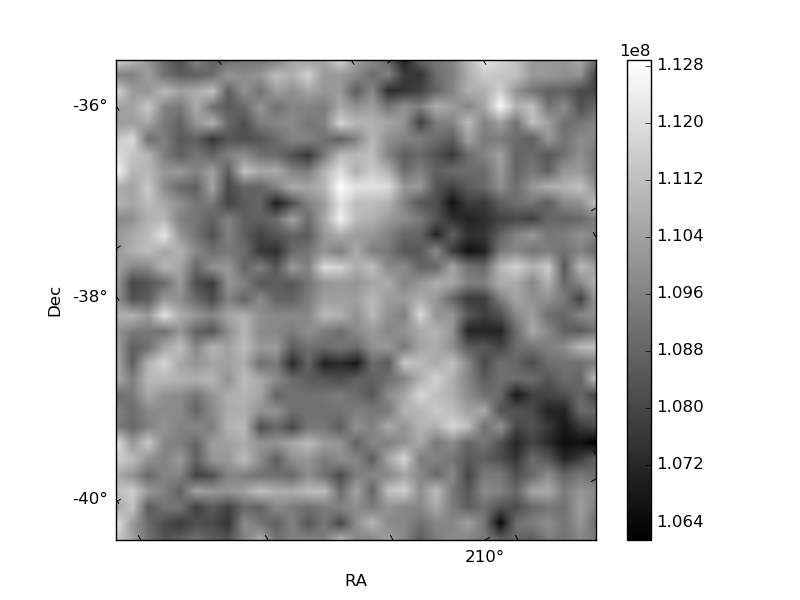
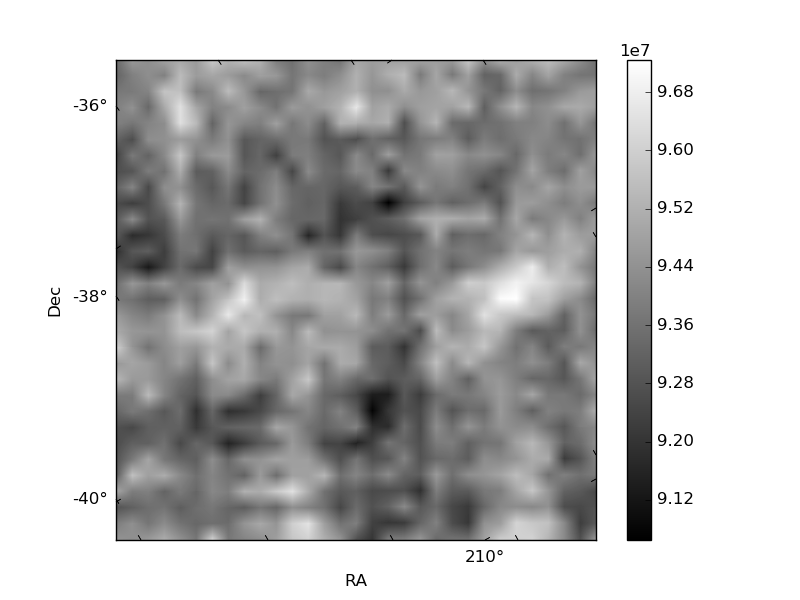
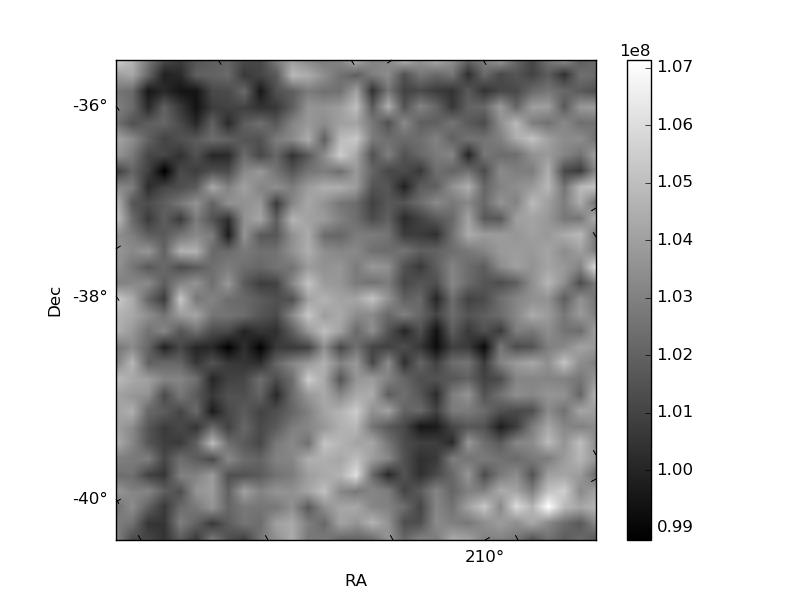
Histogram calculated using DETX and DETY for each event in the final _common_clean file
| Quadrant A | 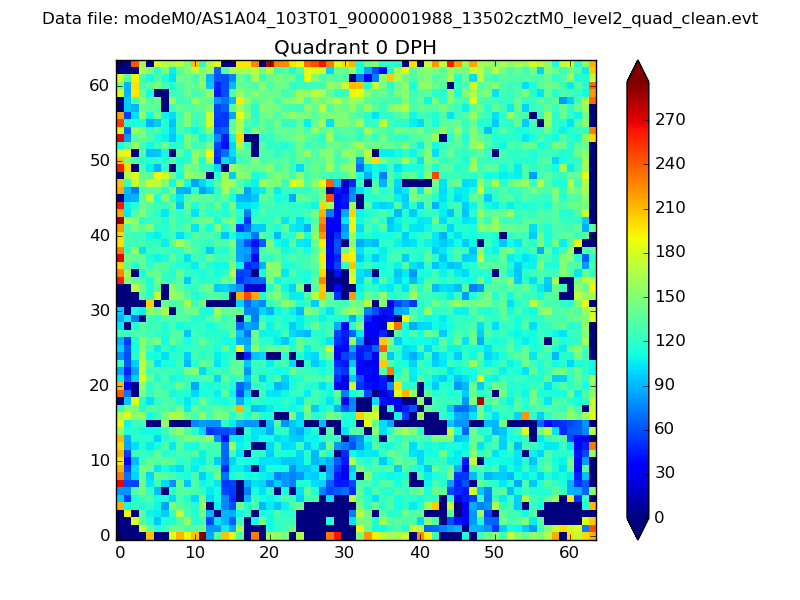 |
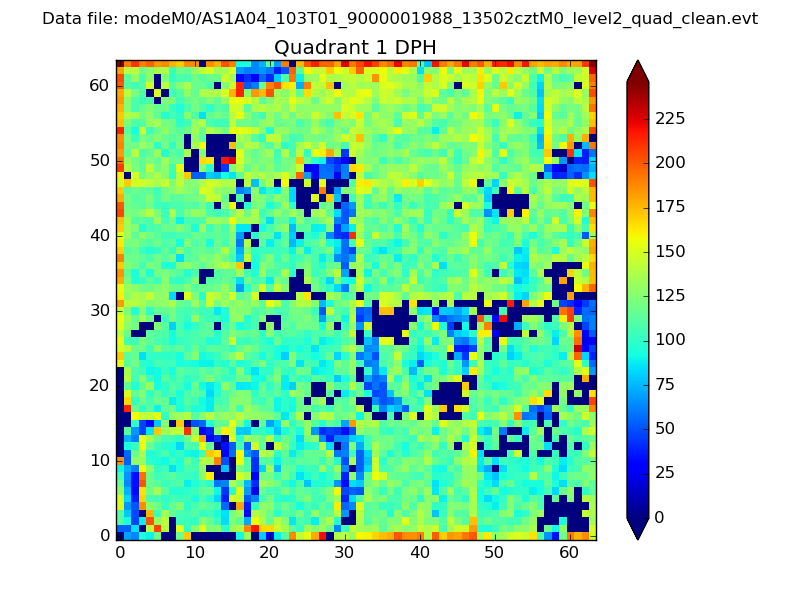 |
Quadrant B |
|---|---|---|---|
| Quadrant D | 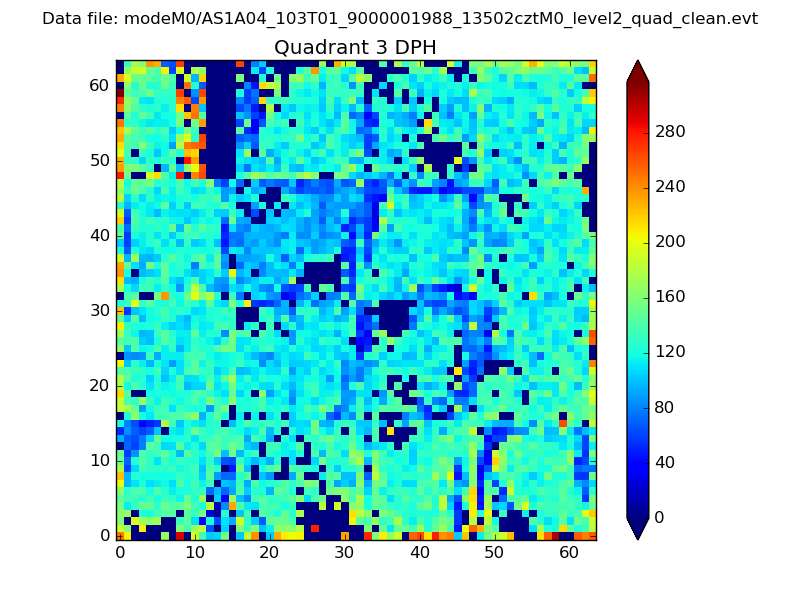 |
 |
Quadrant C |
| Plot type | Count rate plots | Images |
|---|---|---|
| Comparison with Poisson distribution Blue bars denote a histogram of data divided into 1 sec bins. Red curve is a Poisson curve with rate = median count rate of data. |
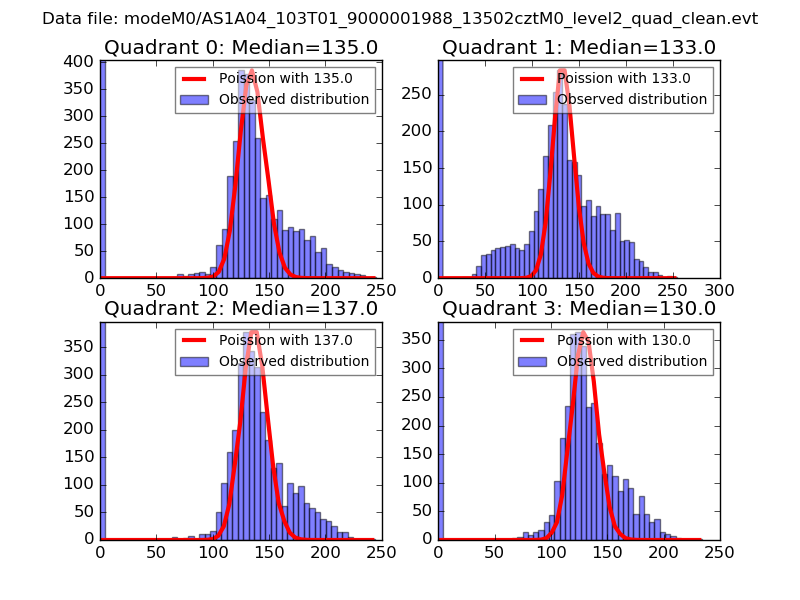 |
 |
| Quadrant-wise count rates Data is divided into 100 sec bins |
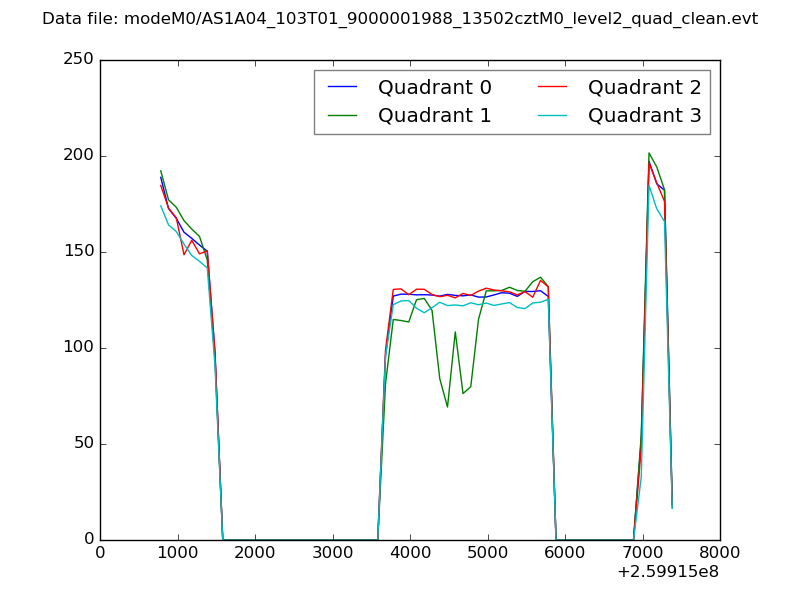 |
|
| Module-wise count rates for Quadrant A Data is divided into 100 sec bins |
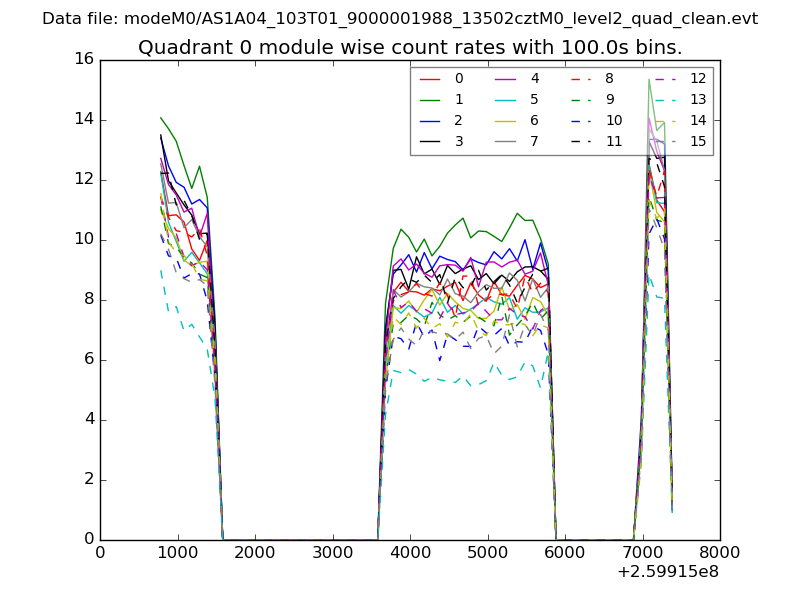 |
 |
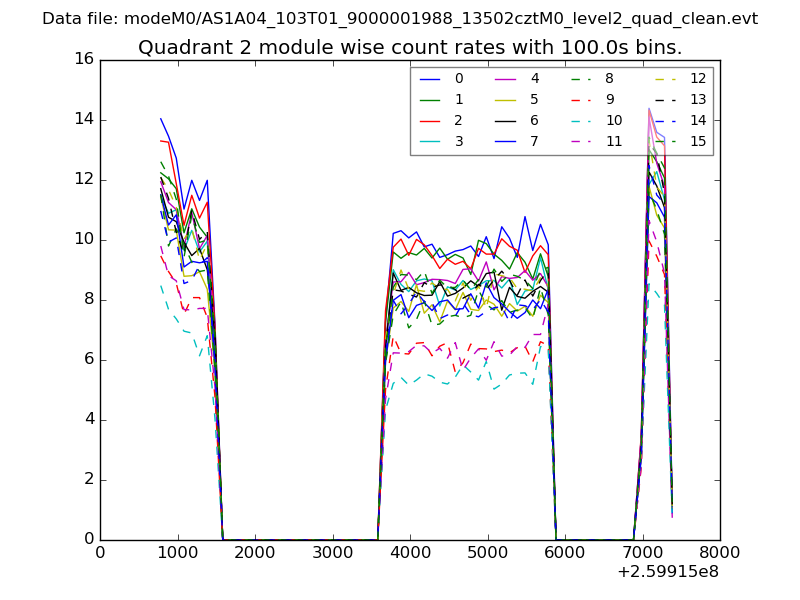
| Module-wise count rates for Quadrant B Data is divided into 100 sec bins |
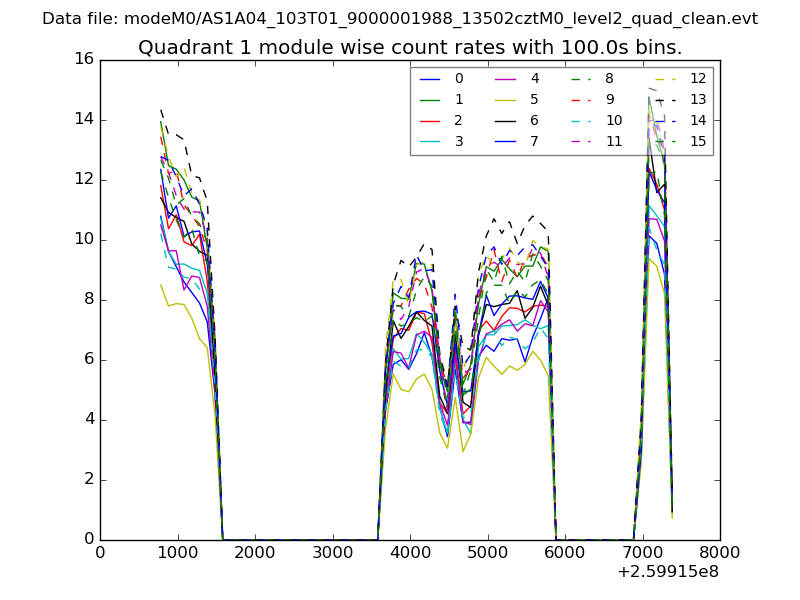 |
 |
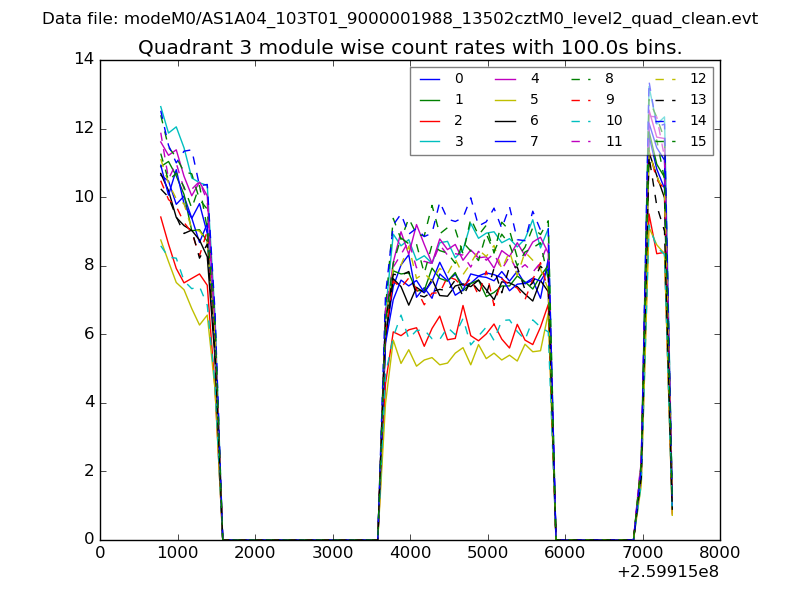
| Module-wise count rates for Quadrant C Data is divided into 100 sec bins |
 |
 |
| Module-wise count rates for Quadrant D Data is divided into 100 sec bins |
 |
 |
| Parameter | Plot |
|---|---|
| CZT HV Monitor | 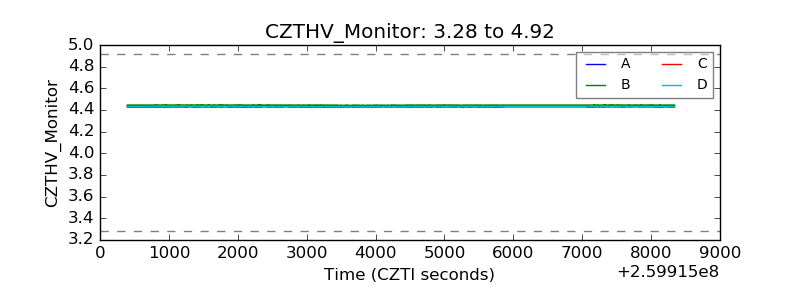 |
| D_VDD | 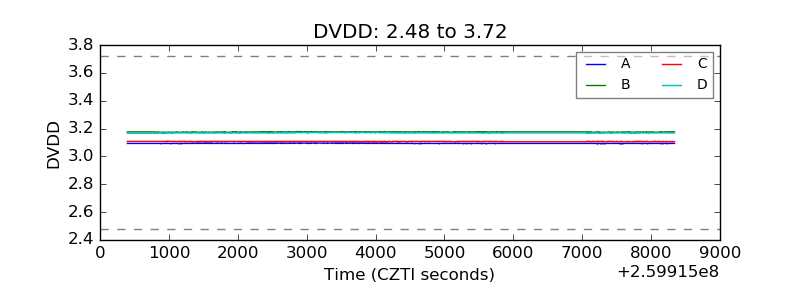 |
| Temperature 1 | 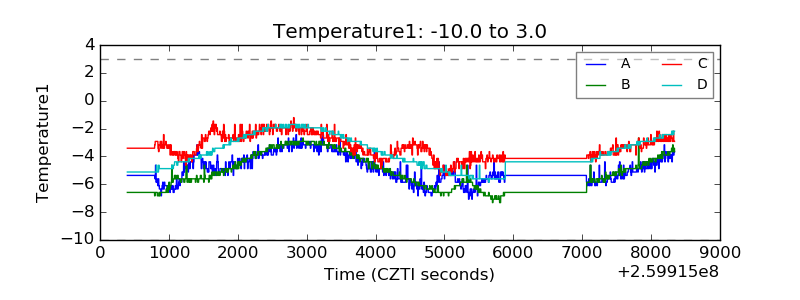 |
| Veto HV Monitor | 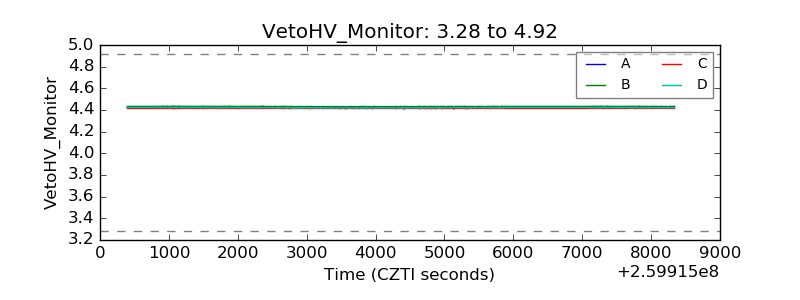 |
| Veto LLD | 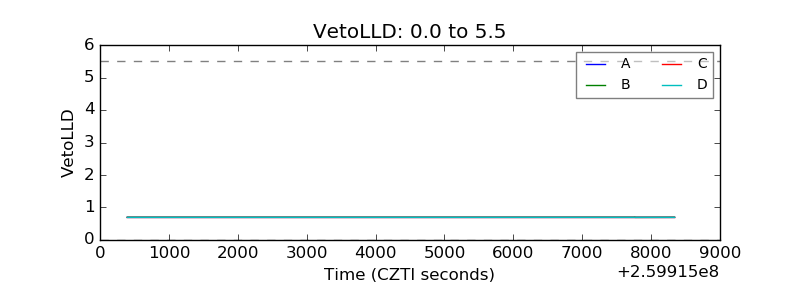 |
| Alpha Counter | 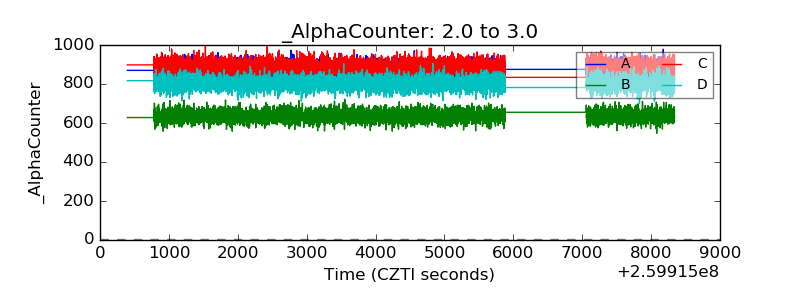 |
| _CPM_Rate | 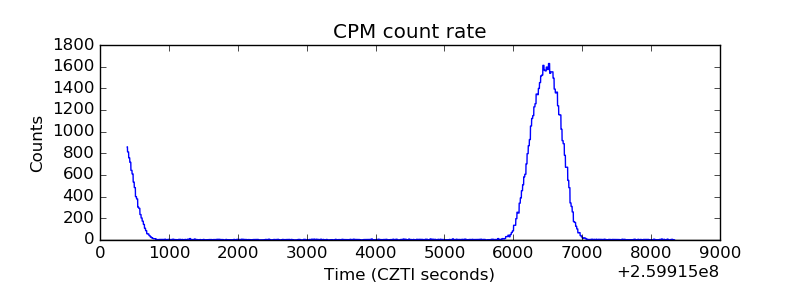 |
| CZT Counter | 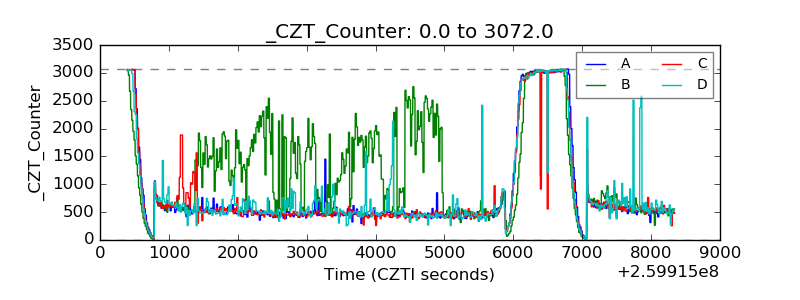 |
| +2.5 Volts monitor |  |
| +5 Volts monitor |  |
| _ROLL_ROT | 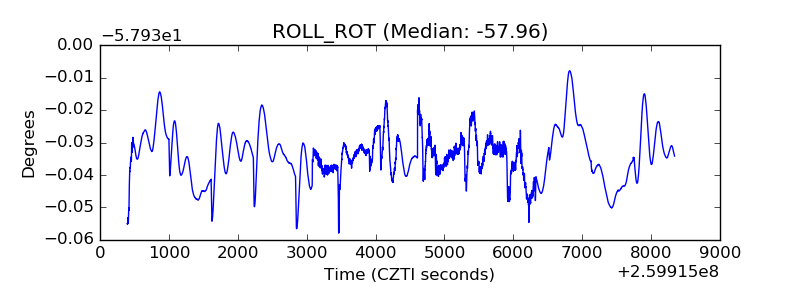 |
| _Roll_DEC | 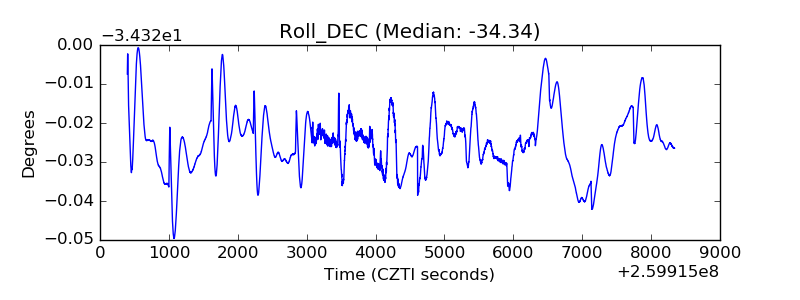 |
| _Roll_RA | 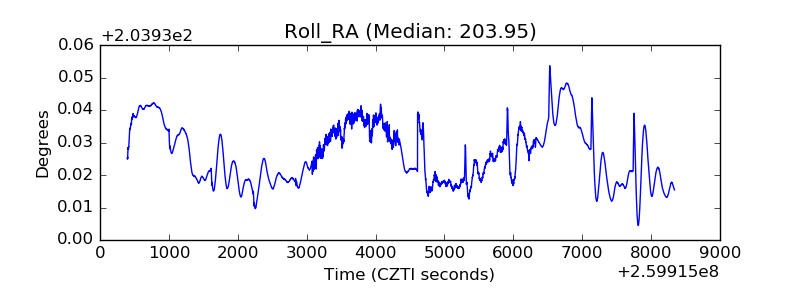 |
| Veto Counter | 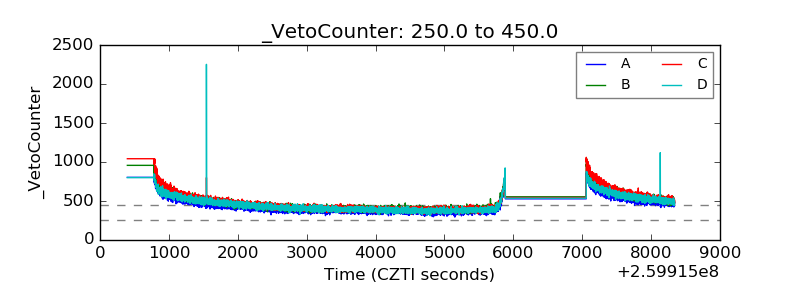 |