| Param | Original file | Final file |
|---|---|---|
| Filename | modeM0/AS1A04_103T01_9000001988_13504cztM0_level2.evt | modeM0/AS1A04_103T01_9000001988_13504cztM0_level2_quad_clean.evt |
| Size (bytes) | 558,247,680 | 66,588,480 |
| Size | 532.4 MB | 63.5 MB |
| Events in quadrant A | 3,524,705 | 393,479 |
| Events in quadrant B | 5,876,449 | 392,762 |
| Events in quadrant C | 3,535,277 | 393,607 |
| Events in quadrant D | 3,522,204 | 375,359 |
| Mode M0 | |||
|---|---|---|---|
| Quadrant | BADHDUFLAG | Total packets | Discarded packets |
| A | 0 | 14507 | 3 |
| B | 0 | 21894 | 2 |
| C | 0 | 14552 | 2 |
| D | 0 | 14820 | 2 |
| Mode SS | |||
|---|---|---|---|
| Quadrant | BADHDUFLAG | Total packets | Discarded packets |
| A | 0 | 134 | 0 |
| B | 0 | 134 | 0 |
| C | 0 | 134 | 0 |
| D | 0 | 134 | 0 |
| Mode M9 | |||
|---|---|---|---|
| Quadrant | BADHDUFLAG | Total packets | Discarded packets |
| A | 0 | 15 | 0 |
| B | 0 | 15 | 0 |
| C | 0 | 15 | 0 |
| D | 0 | 16 | 0 |
| Quadrant | Total seconds | Saturated seconds | Saturation percentage |
|---|---|---|---|
| A | 6609 | 113 | 1.709790% |
| B | 6609 | 794 | 12.013920% |
| C | 6609 | 83 | 1.255863% |
| D | 6609 | 98 | 1.482826% |
Noise dominated data is calculated using 1-second bins in cleaned event files. If a bin has >2000 counts, and if more than 50% of those come from <1% of pixels, then it is considered to be noise-dominated and hence unusable.
| Quadrant | # 1 sec bins | Bins with >0 counts | Bins with >2000 counts | High rate bins dominated by noise | Noise dominated (total time) | Noise dominated (detector-on time) | Marked lightcurve |
|---|---|---|---|---|---|---|---|
| A | 7890 | 6610 | 0 | 0 | 0.00% | 0.00% | 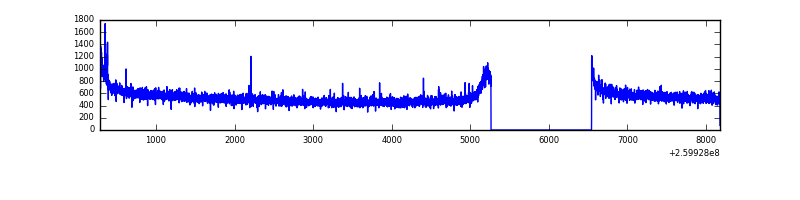 |
| B | 7890 | 6610 | 513 | 513 | 6.50% | 7.76% | 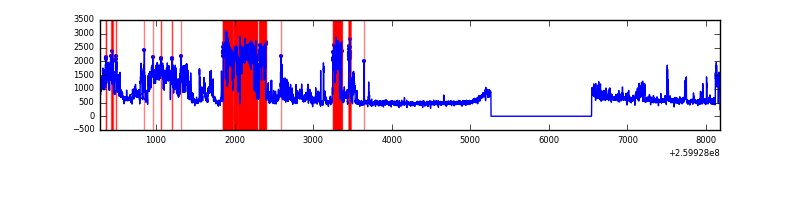 |
| C | 7890 | 6610 | 0 | 0 | 0.00% | 0.00% | 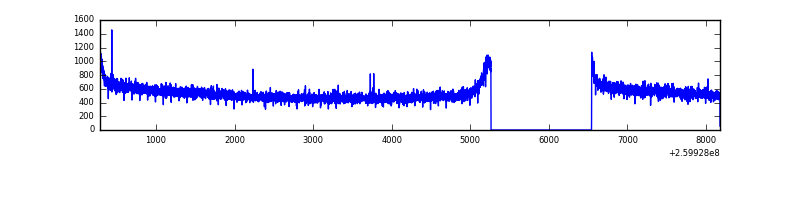 |
| D | 7890 | 6610 | 9 | 9 | 0.11% | 0.14% | 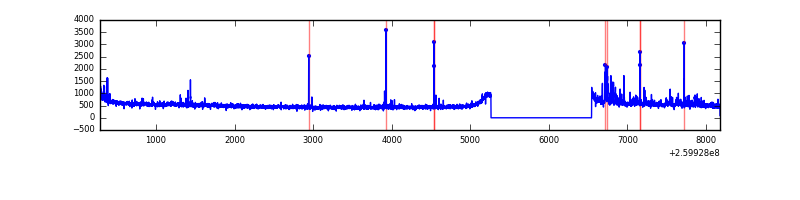 |
Top three noisy pixels from each quadrant. If the there are fewer than three noisy pixels in the level2.evt file, extra rows are filled as -1
| Pixel properties | Quadrant properties | ||||||
|---|---|---|---|---|---|---|---|
| Quadrant | DetID | PixID | Counts | Sigma | Mean | Median | Sigma |
| A | 14 | 238 | 28531 | 154.73 | 898 | 882 | 178.7 |
| A | 8 | 15 | 21558 | 115.71 | 898 | 882 | 178.7 |
| A | 1 | 162 | 15400 | 81.25 | 898 | 882 | 178.7 |
| B | 3 | 64 | 2419328 | 14891.04 | 875 | 858 | 162.4 |
| B | 0 | 230 | 18750 | 110.16 | 875 | 858 | 162.4 |
| B | 12 | 111 | 18431 | 108.2 | 875 | 858 | 162.4 |
| C | 3 | 233 | 130141 | 651.99 | 871 | 881 | 198.3 |
| C | 4 | 175 | 7586 | 33.82 | 871 | 881 | 198.3 |
| C | 13 | 61 | 6328 | 27.47 | 871 | 881 | 198.3 |
| D | 11 | 129 | 89457 | 432.54 | 866 | 843 | 204.9 |
| D | 14 | 35 | 50585 | 242.8 | 866 | 843 | 204.9 |
| D | 2 | 136 | 45144 | 216.24 | 866 | 843 | 204.9 |
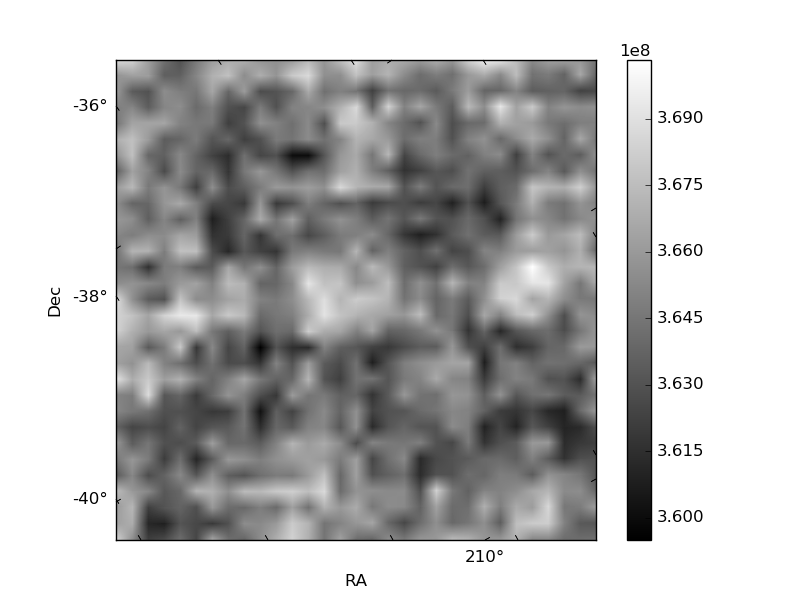
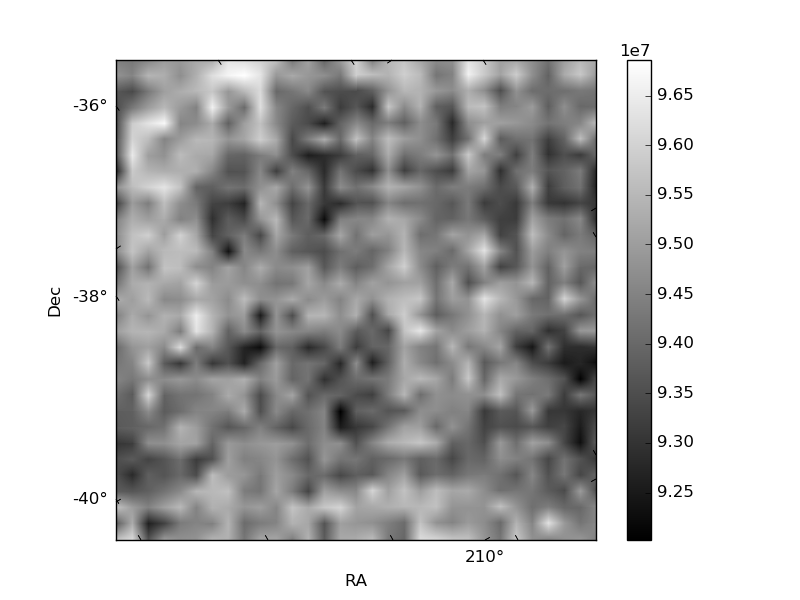
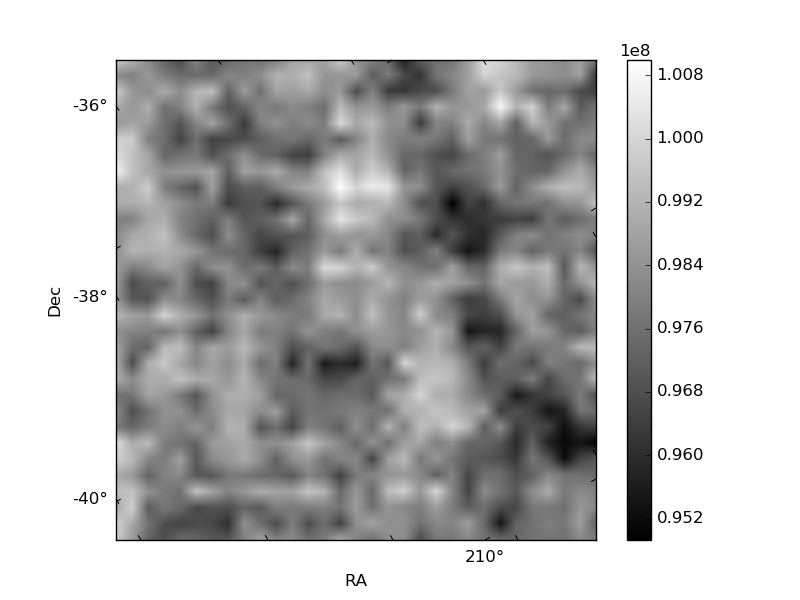
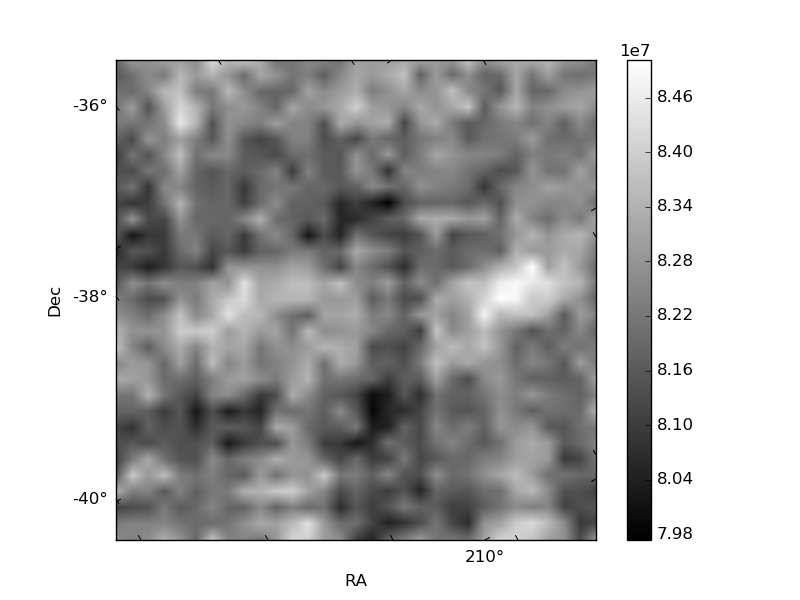
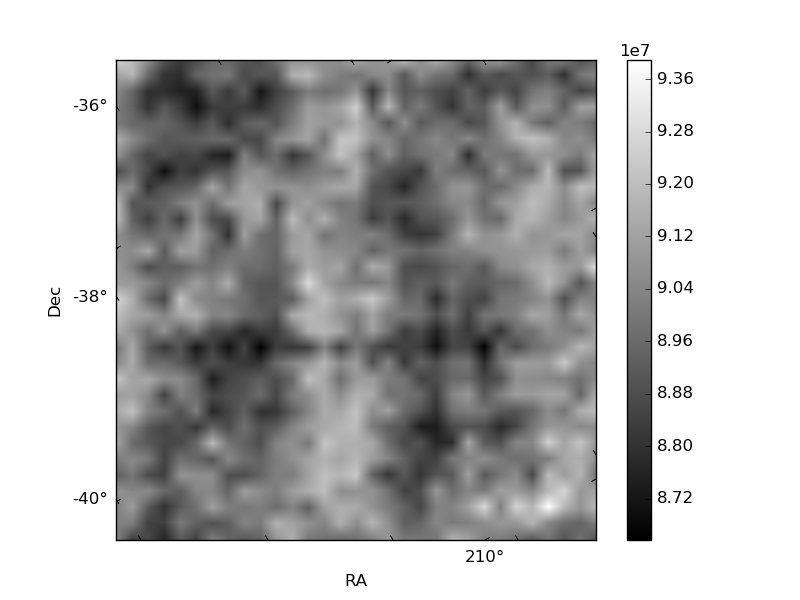
Histogram calculated using DETX and DETY for each event in the final _common_clean file
| Quadrant A | 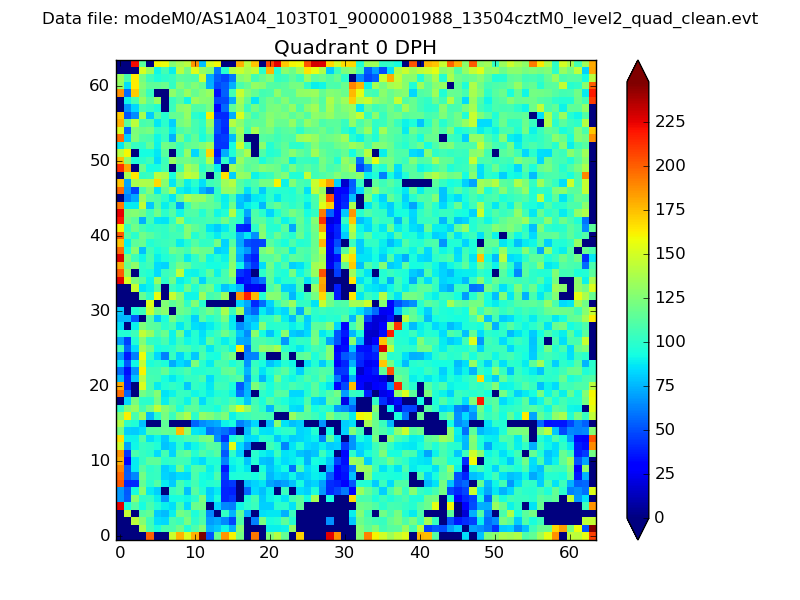 |
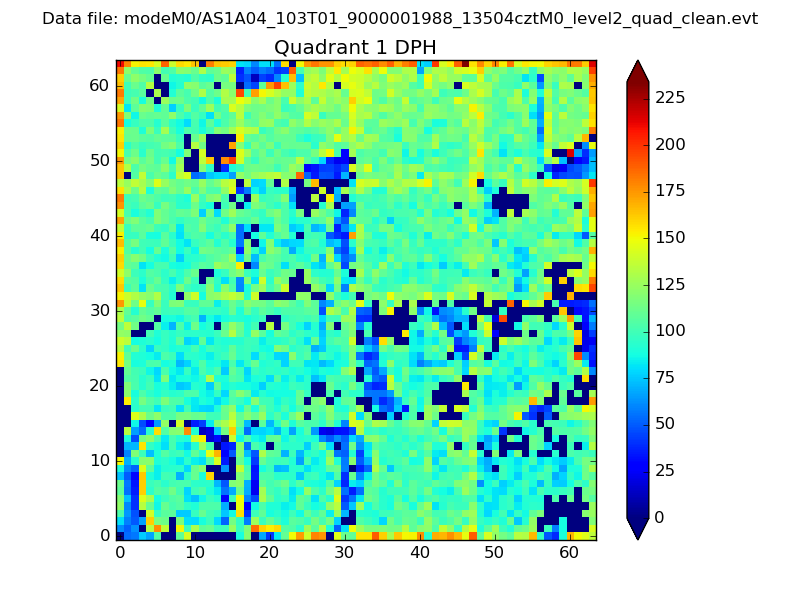 |
Quadrant B |
|---|---|---|---|
| Quadrant D | 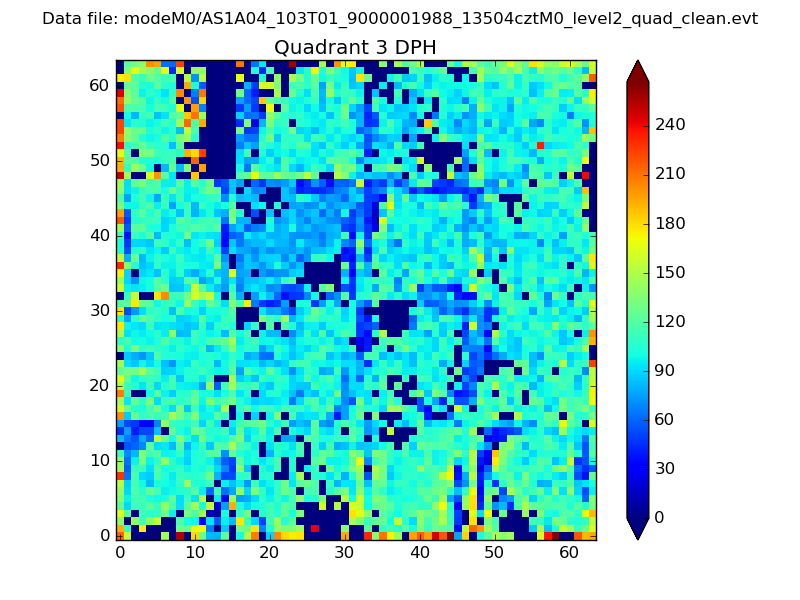 |
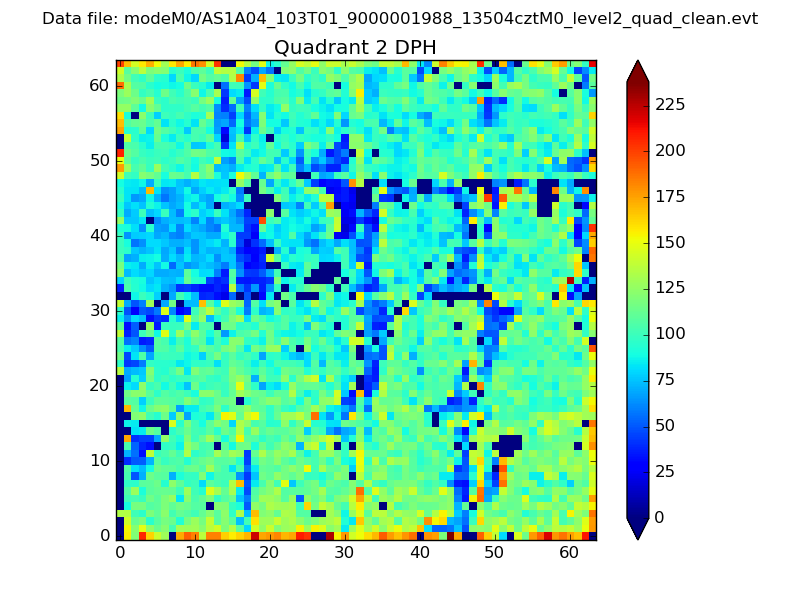 |
Quadrant C |
| Plot type | Count rate plots | Images |
|---|---|---|
| Comparison with Poisson distribution Blue bars denote a histogram of data divided into 1 sec bins. Red curve is a Poisson curve with rate = median count rate of data. |
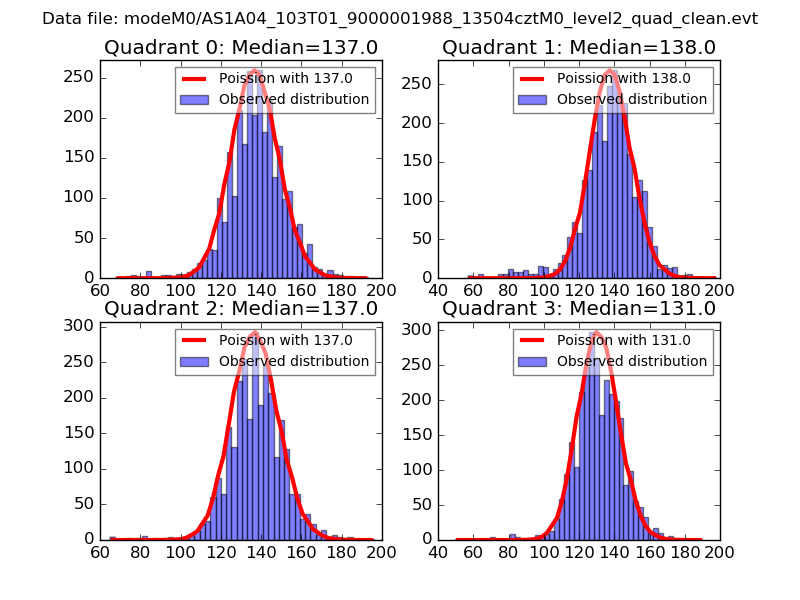 |
 |
| Quadrant-wise count rates Data is divided into 100 sec bins |
 |
|
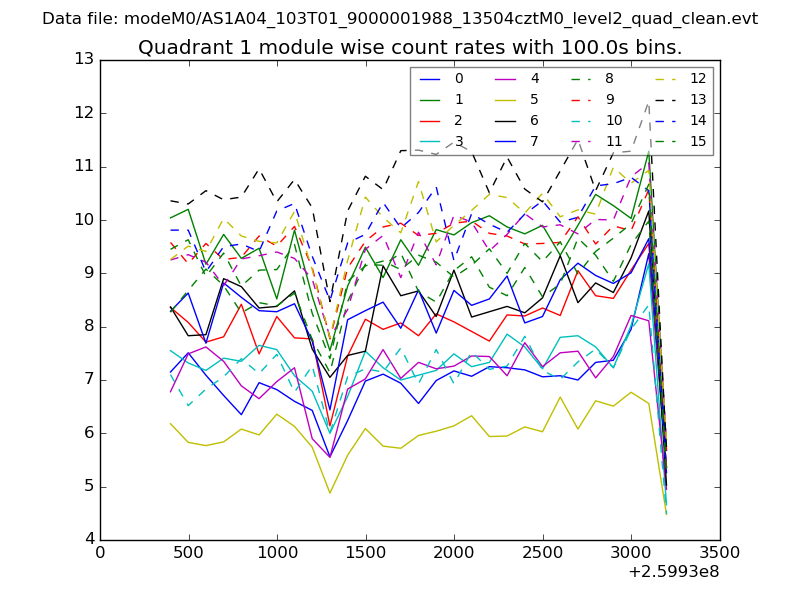
| Module-wise count rates for Quadrant A Data is divided into 100 sec bins |
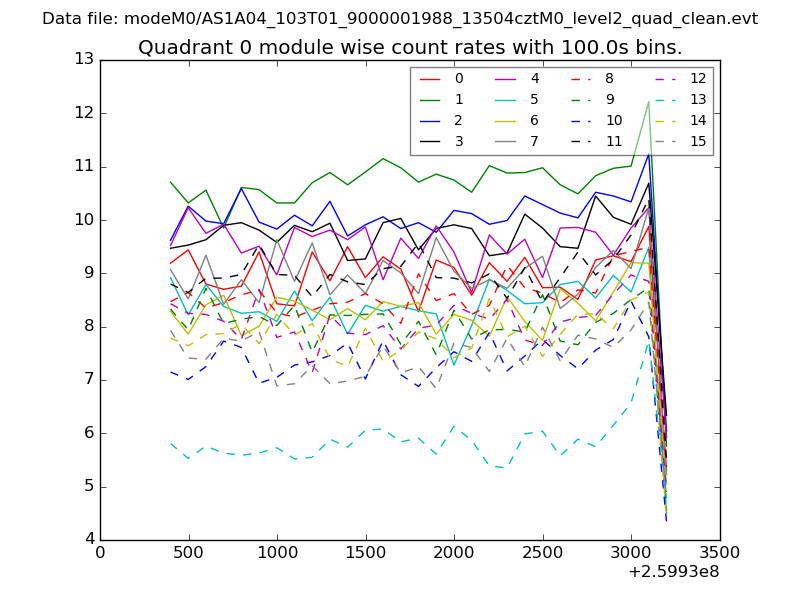 |
 |
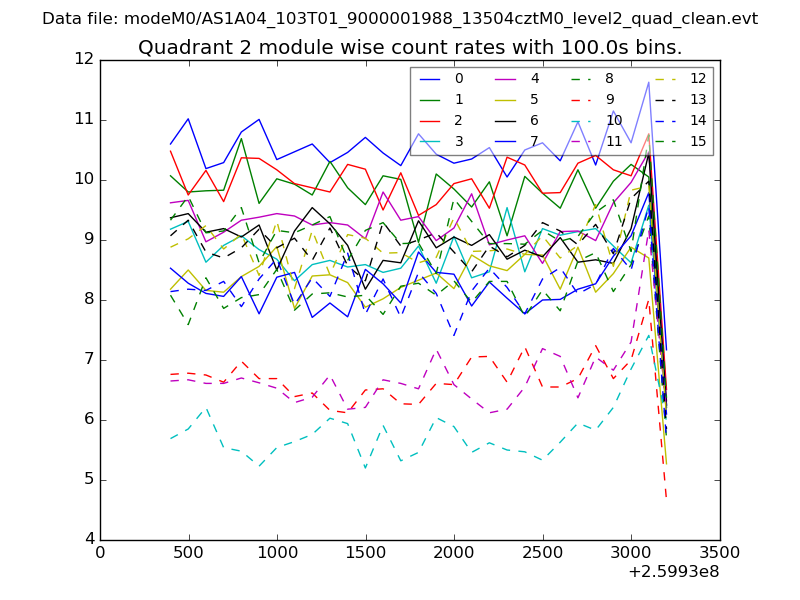
| Module-wise count rates for Quadrant B Data is divided into 100 sec bins |
 |
 |
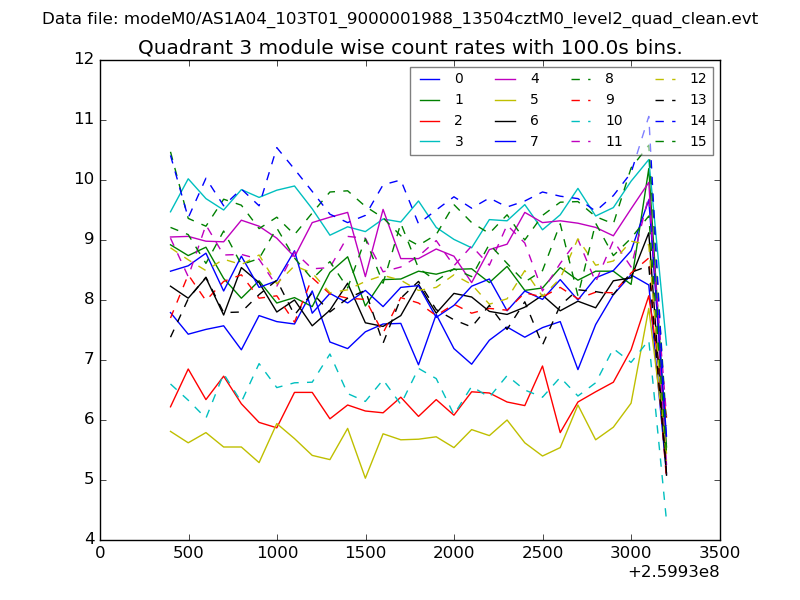
| Module-wise count rates for Quadrant C Data is divided into 100 sec bins |
 |
 |
| Module-wise count rates for Quadrant D Data is divided into 100 sec bins |
 |
 |
| Parameter | Plot |
|---|---|
| CZT HV Monitor | 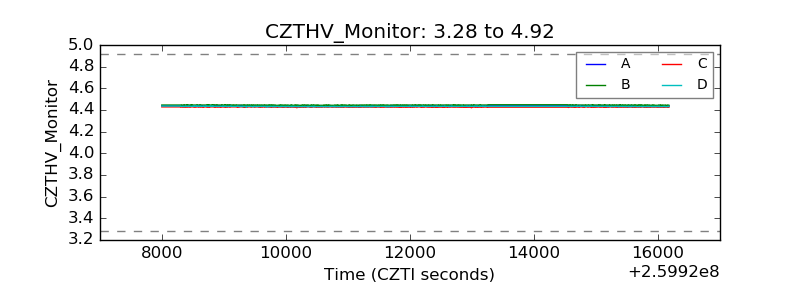 |
| D_VDD | 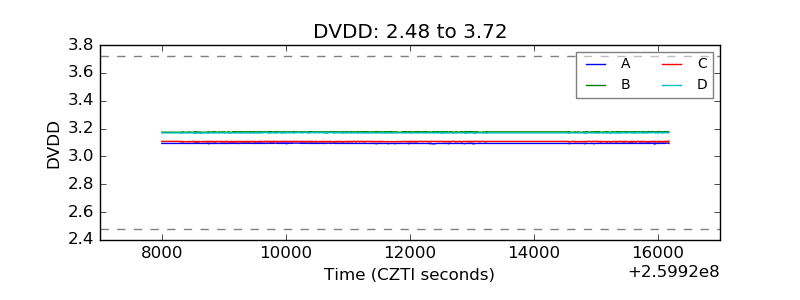 |
| Temperature 1 |  |
| Veto HV Monitor | 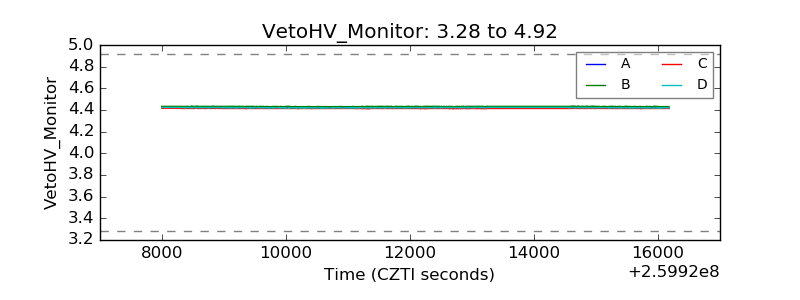 |
| Veto LLD | 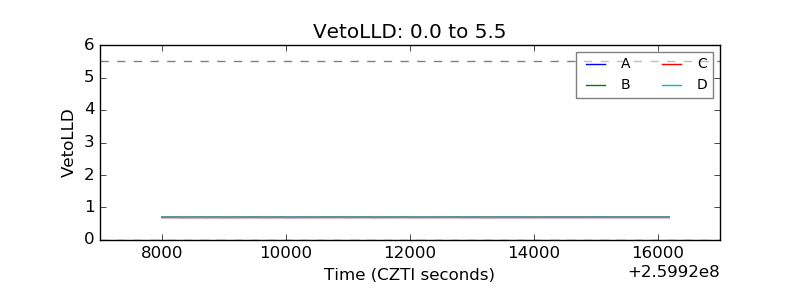 |
| Alpha Counter | 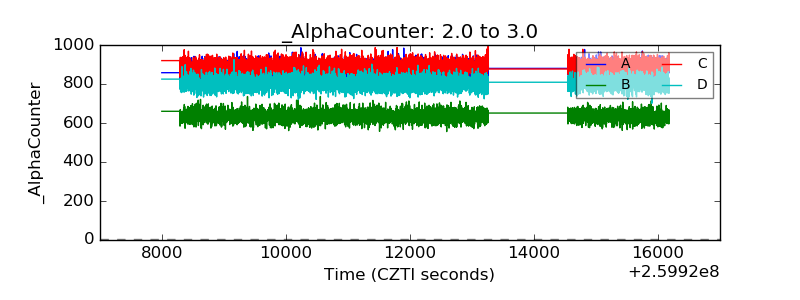 |
| _CPM_Rate | 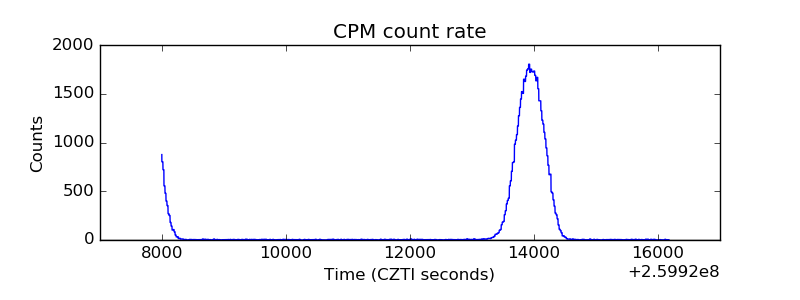 |
| CZT Counter |  |
| +2.5 Volts monitor |  |
| +5 Volts monitor |  |
| _ROLL_ROT | 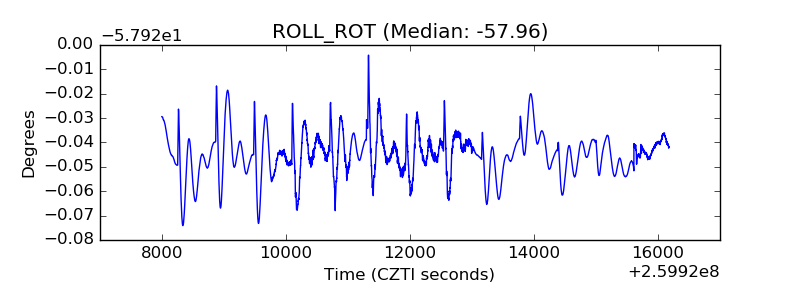 |
| _Roll_DEC | 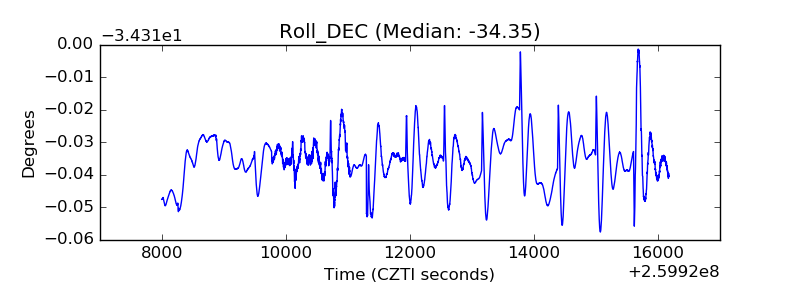 |
| _Roll_RA | 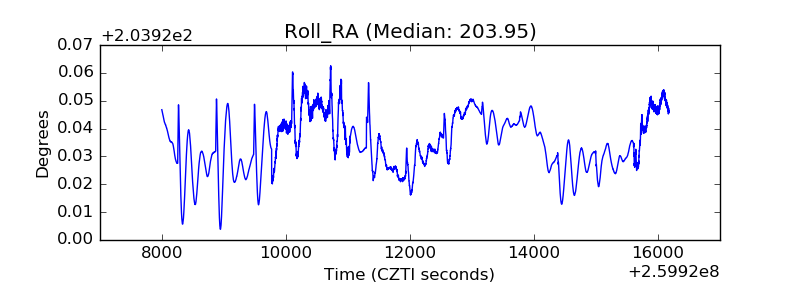 |
| Veto Counter | 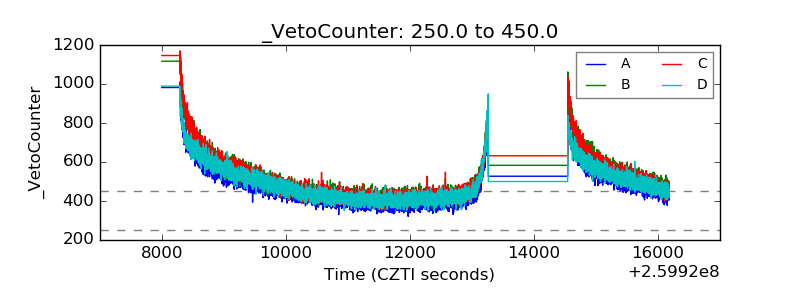 |