| Param | Original file | Final file |
|---|---|---|
| Filename | modeM0/AS1A04_103T01_9000001988_13506cztM0_level2.evt | modeM0/AS1A04_103T01_9000001988_13506cztM0_level2_quad_clean.evt |
| Size (bytes) | 473,423,040 | 86,402,880 |
| Size | 451.5 MB | 82.4 MB |
| Events in quadrant A | 3,194,159 | 548,899 |
| Events in quadrant B | 3,415,851 | 555,961 |
| Events in quadrant C | 3,300,261 | 542,906 |
| Events in quadrant D | 3,986,428 | 515,851 |
| Mode M0 | |||
|---|---|---|---|
| Quadrant | BADHDUFLAG | Total packets | Discarded packets |
| A | 0 | 13592 | 5 |
| B | 0 | 14220 | 4 |
| C | 0 | 13767 | 4 |
| D | 0 | 16202 | 4 |
| Mode SS | |||
|---|---|---|---|
| Quadrant | BADHDUFLAG | Total packets | Discarded packets |
| A | 0 | 132 | 0 |
| B | 0 | 132 | 0 |
| C | 0 | 132 | 2 |
| D | 0 | 132 | 0 |
| Mode M9 | |||
|---|---|---|---|
| Quadrant | BADHDUFLAG | Total packets | Discarded packets |
| A | 0 | 19 | 0 |
| B | 0 | 19 | 0 |
| C | 0 | 19 | 0 |
| D | 0 | 20 | 0 |
| Quadrant | Total seconds | Saturated seconds | Saturation percentage |
|---|---|---|---|
| A | 6495 | 84 | 1.293303% |
| B | 6495 | 134 | 2.063125% |
| C | 6495 | 58 | 0.892995% |
| D | 6495 | 141 | 2.170901% |
Noise dominated data is calculated using 1-second bins in cleaned event files. If a bin has >2000 counts, and if more than 50% of those come from <1% of pixels, then it is considered to be noise-dominated and hence unusable.
| Quadrant | # 1 sec bins | Bins with >0 counts | Bins with >2000 counts | High rate bins dominated by noise | Noise dominated (total time) | Noise dominated (detector-on time) | Marked lightcurve |
|---|---|---|---|---|---|---|---|
| A | 7572 | 6497 | 0 | 0 | 0.00% | 0.00% | 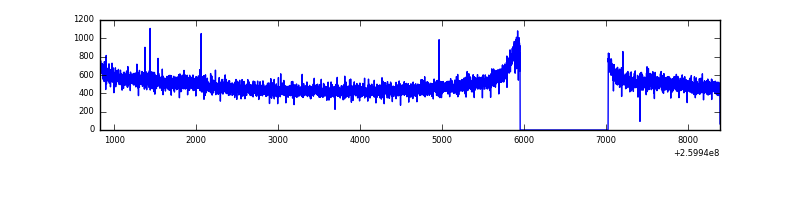 |
| B | 7572 | 6497 | 31 | 31 | 0.41% | 0.48% | 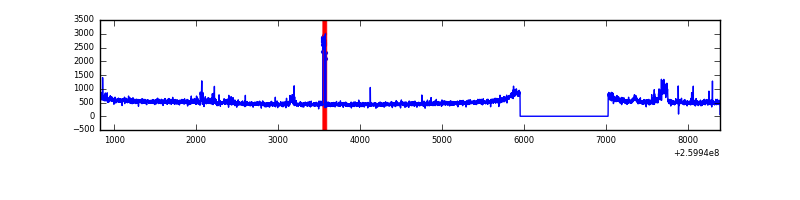 |
| C | 7572 | 6497 | 0 | 0 | 0.00% | 0.00% | 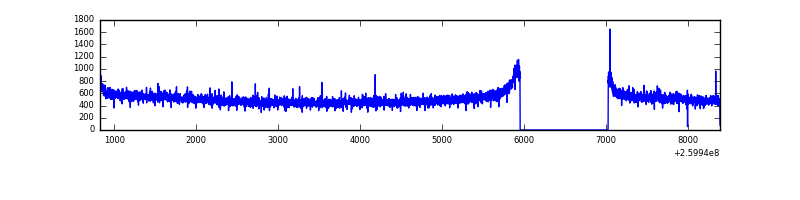 |
| D | 7572 | 6497 | 108 | 108 | 1.43% | 1.66% | 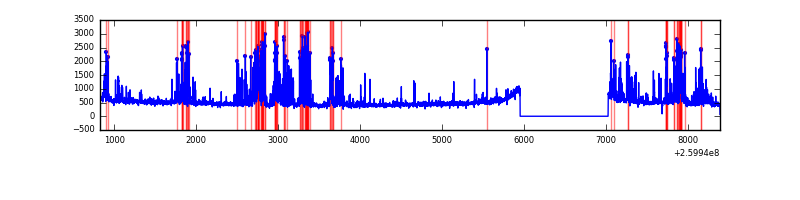 |
Top three noisy pixels from each quadrant. If the there are fewer than three noisy pixels in the level2.evt file, extra rows are filled as -1
| Pixel properties | Quadrant properties | ||||||
|---|---|---|---|---|---|---|---|
| Quadrant | DetID | PixID | Counts | Sigma | Mean | Median | Sigma |
| A | 8 | 15 | 11020 | 61.49 | 825 | 810 | 166.0 |
| A | 1 | 162 | 8980 | 49.21 | 825 | 810 | 166.0 |
| A | 0 | 226 | 7256 | 38.82 | 825 | 810 | 166.0 |
| B | 3 | 64 | 179307 | 1146.84 | 820 | 799 | 155.7 |
| B | 12 | 111 | 18316 | 112.54 | 820 | 799 | 155.7 |
| B | 0 | 230 | 16657 | 101.88 | 820 | 799 | 155.7 |
| C | 3 | 233 | 164718 | 889.32 | 799 | 805 | 184.3 |
| C | 4 | 175 | 17809 | 92.26 | 799 | 805 | 184.3 |
| C | 13 | 61 | 5571 | 25.86 | 799 | 805 | 184.3 |
| D | 11 | 129 | 860484 | 4590.7 | 787 | 765 | 187.3 |
| D | 8 | 195 | 72191 | 381.4 | 787 | 765 | 187.3 |
| D | 2 | 136 | 27268 | 141.52 | 787 | 765 | 187.3 |
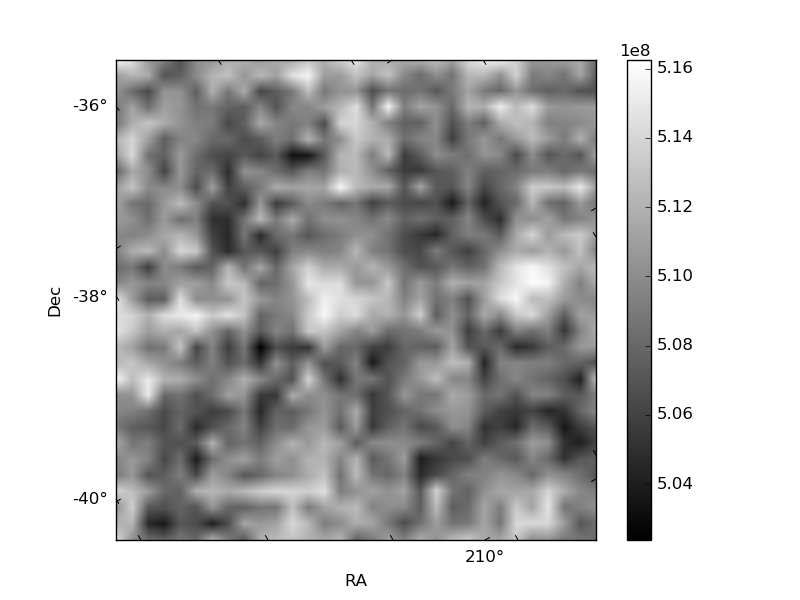
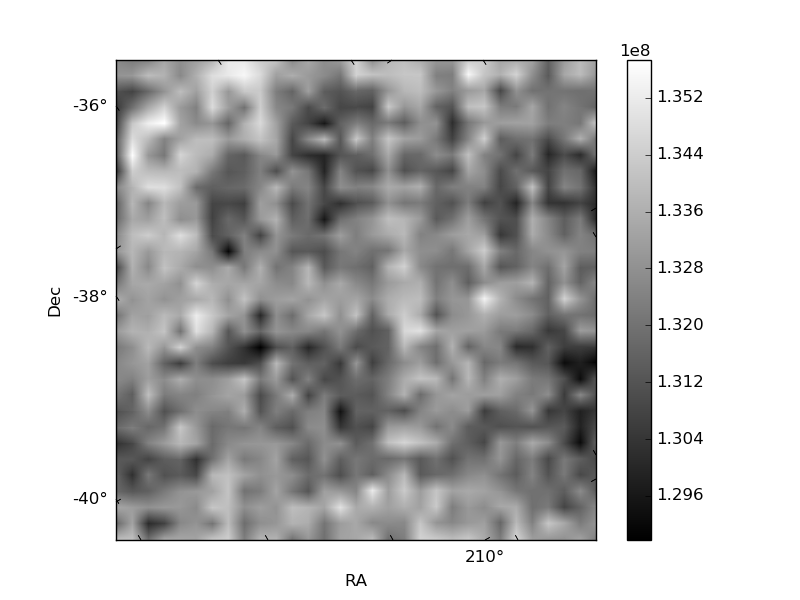
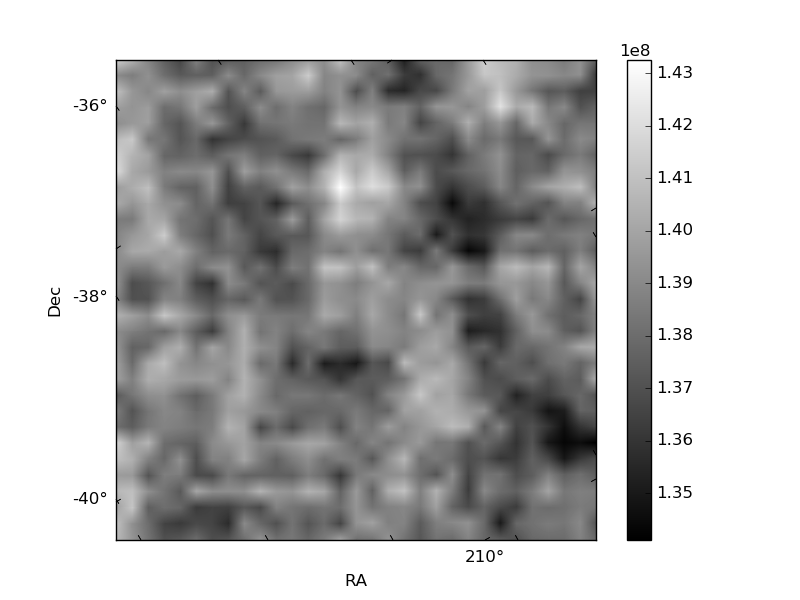
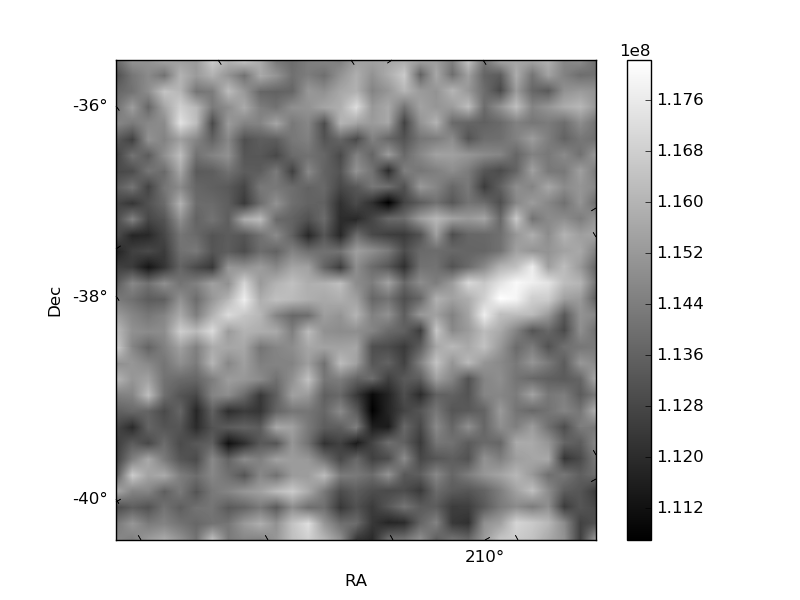
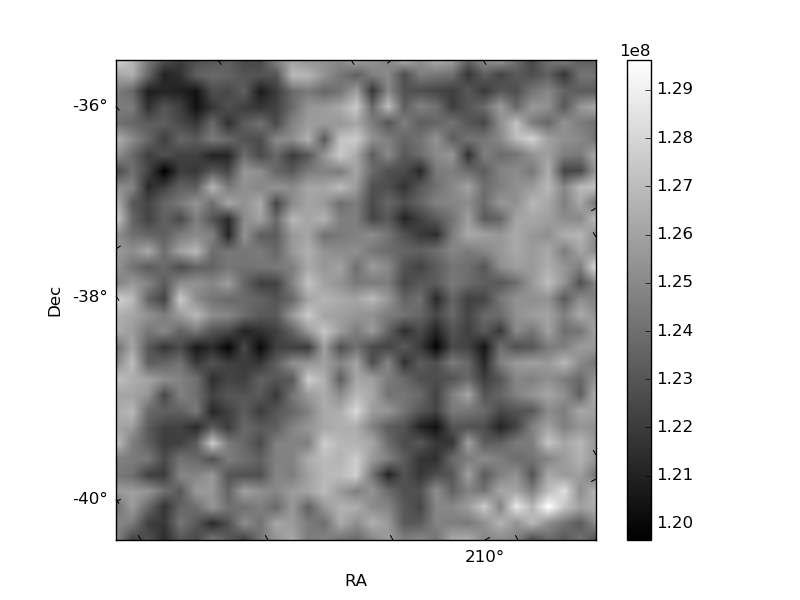
Histogram calculated using DETX and DETY for each event in the final _common_clean file
| Quadrant A | 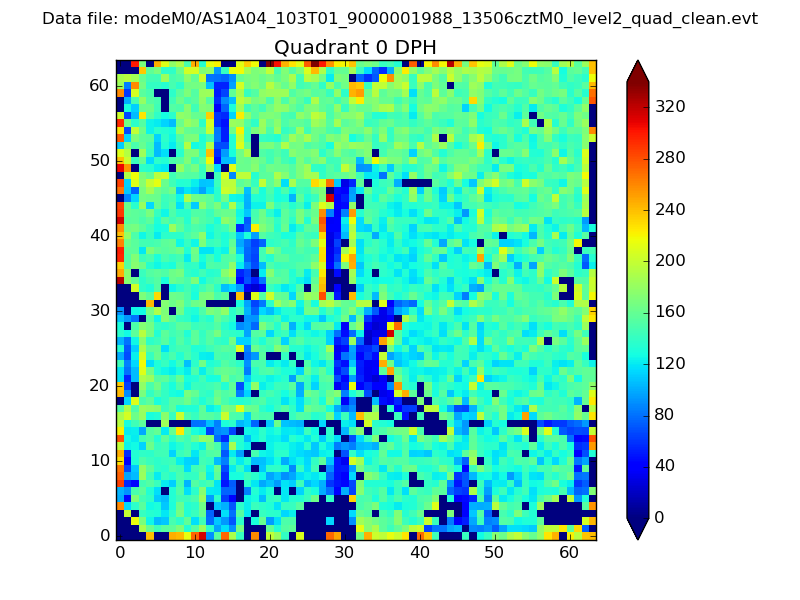 |
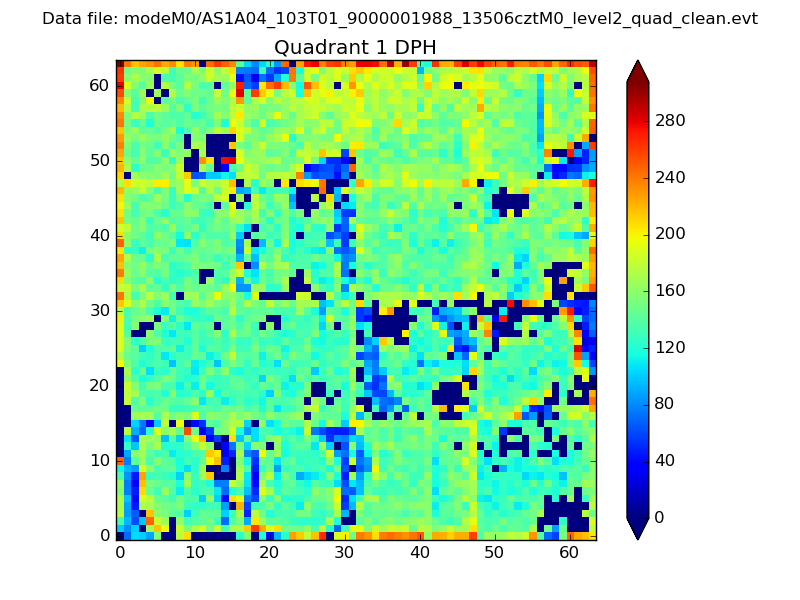 |
Quadrant B |
|---|---|---|---|
| Quadrant D |  |
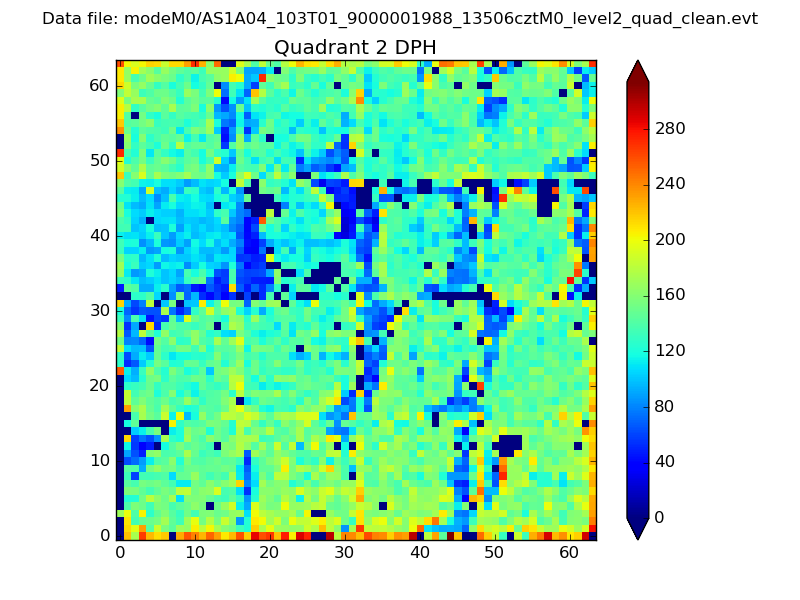 |
Quadrant C |
| Plot type | Count rate plots | Images |
|---|---|---|
| Comparison with Poisson distribution Blue bars denote a histogram of data divided into 1 sec bins. Red curve is a Poisson curve with rate = median count rate of data. |
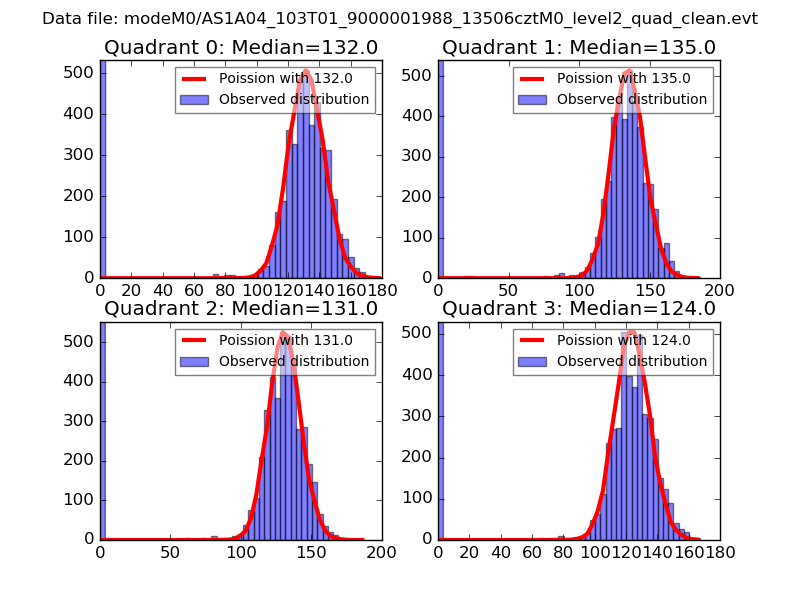 |
 |
| Quadrant-wise count rates Data is divided into 100 sec bins |
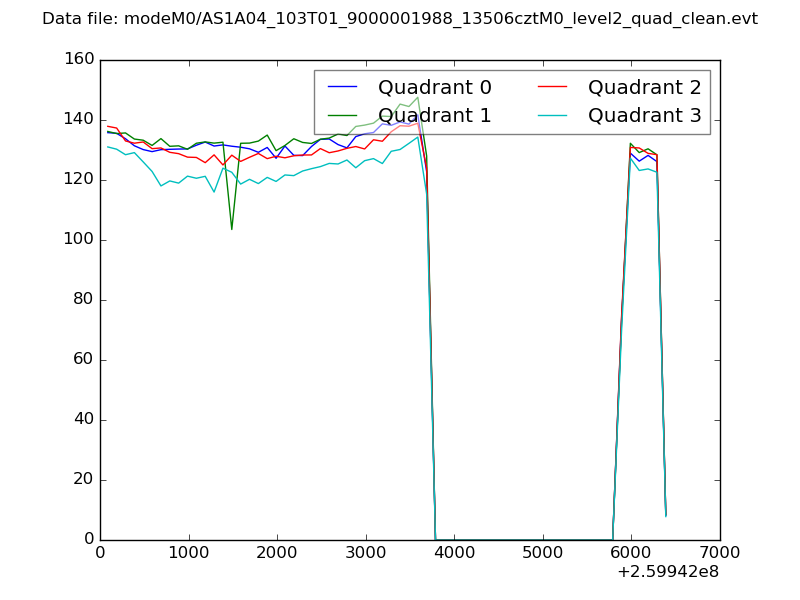 |
|
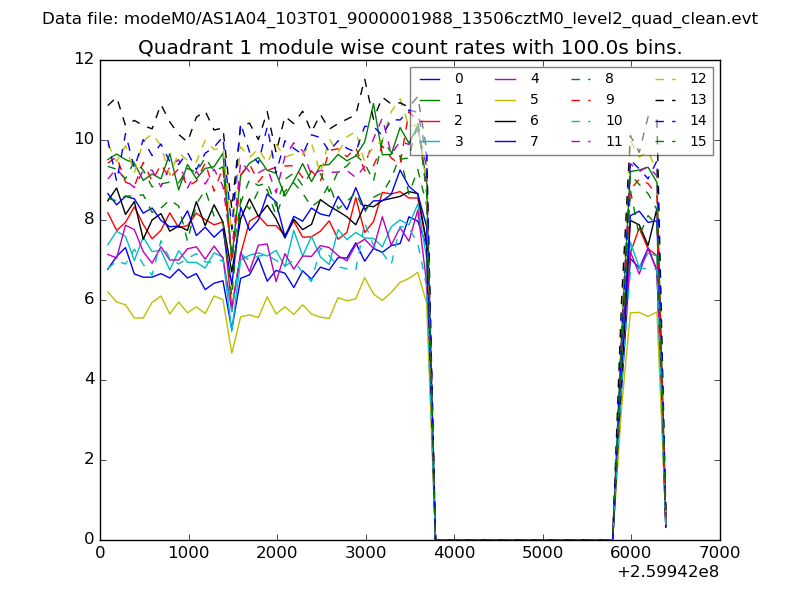
| Module-wise count rates for Quadrant A Data is divided into 100 sec bins |
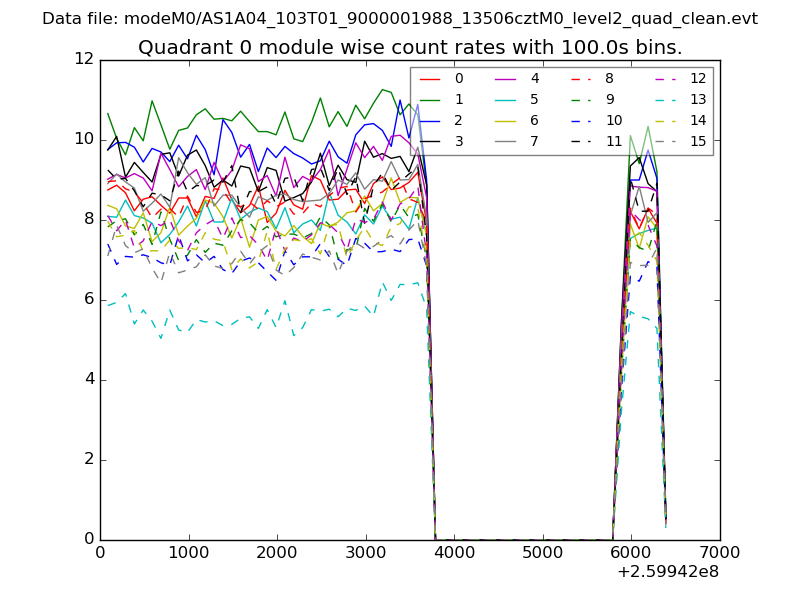 |
 |
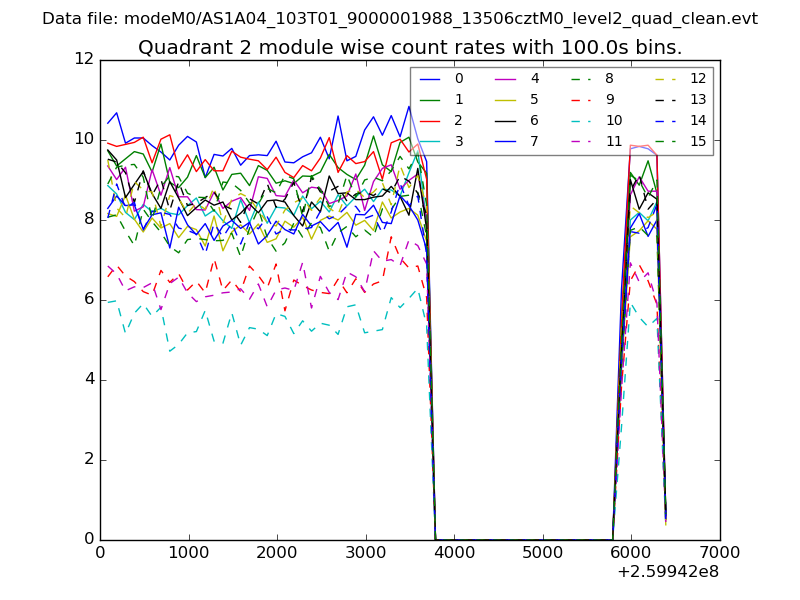
| Module-wise count rates for Quadrant B Data is divided into 100 sec bins |
 |
 |
| Module-wise count rates for Quadrant C Data is divided into 100 sec bins |
 |
 |
| Module-wise count rates for Quadrant D Data is divided into 100 sec bins |
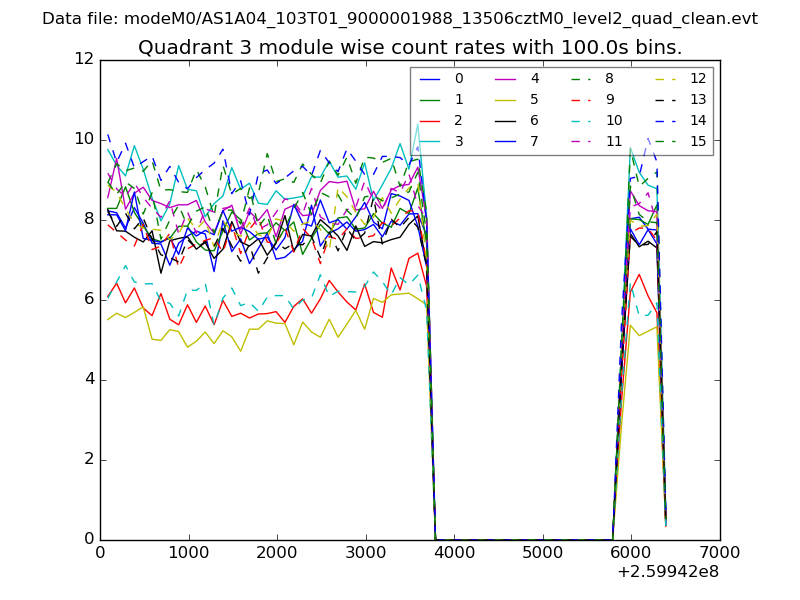 |
 |
| Parameter | Plot |
|---|---|
| CZT HV Monitor | 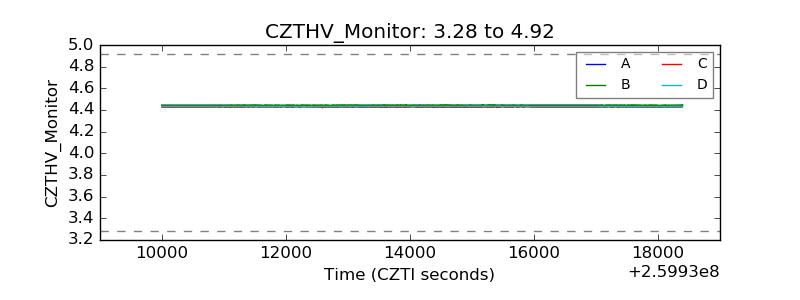 |
| D_VDD | 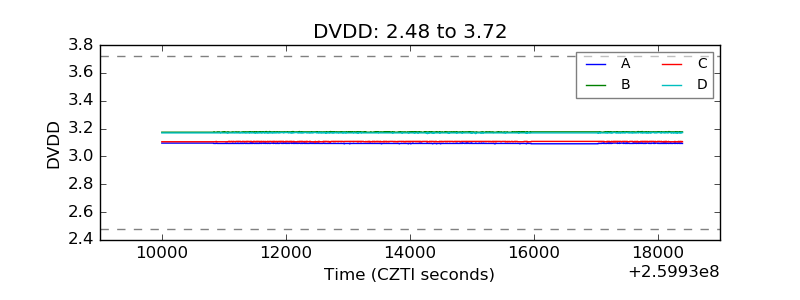 |
| Temperature 1 | 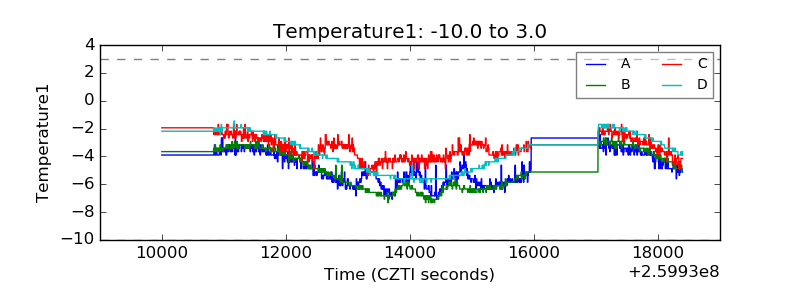 |
| Veto HV Monitor | 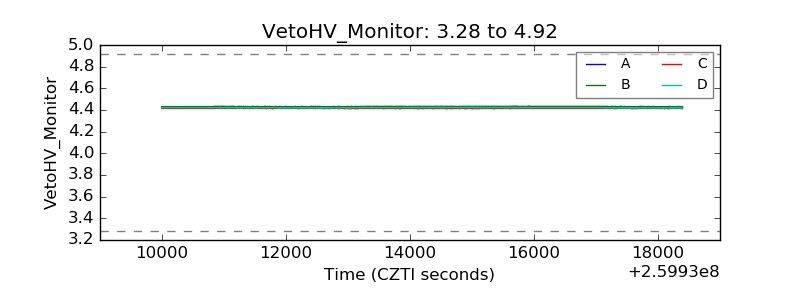 |
| Veto LLD | 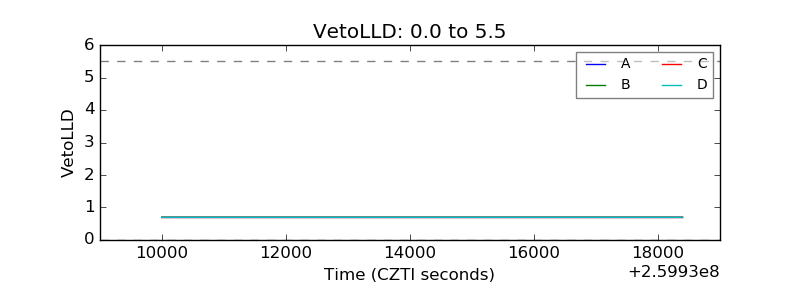 |
| Alpha Counter | 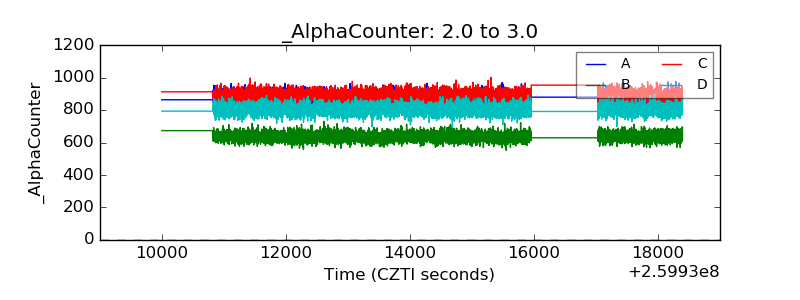 |
| _CPM_Rate | 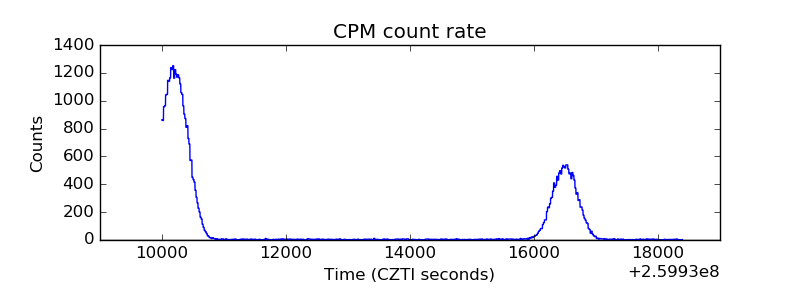 |
| CZT Counter | 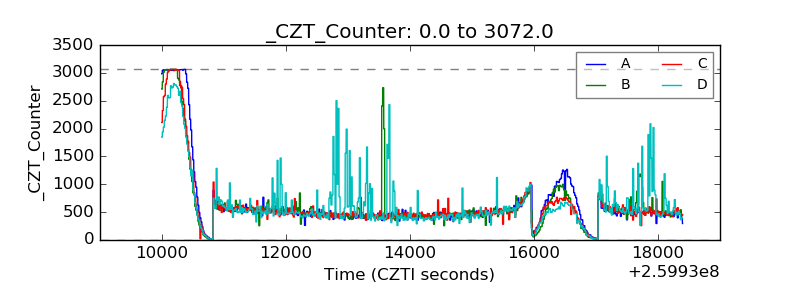 |
| +2.5 Volts monitor | 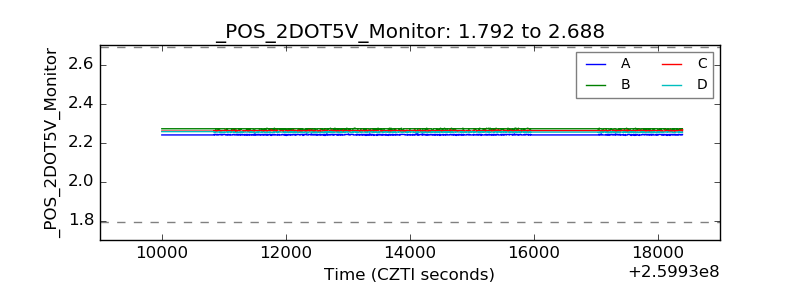 |
| +5 Volts monitor | 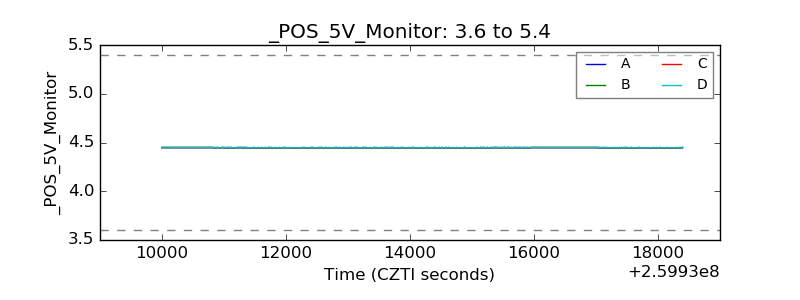 |
| _ROLL_ROT | 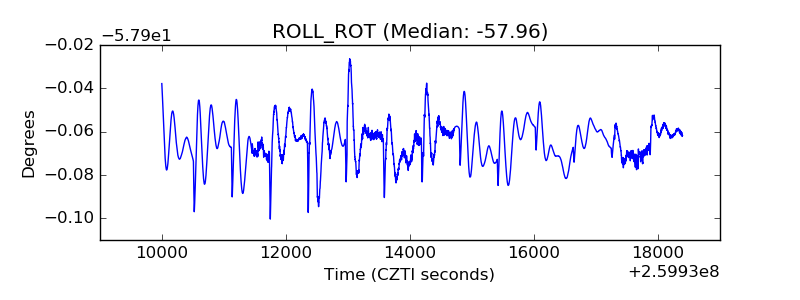 |
| _Roll_DEC | 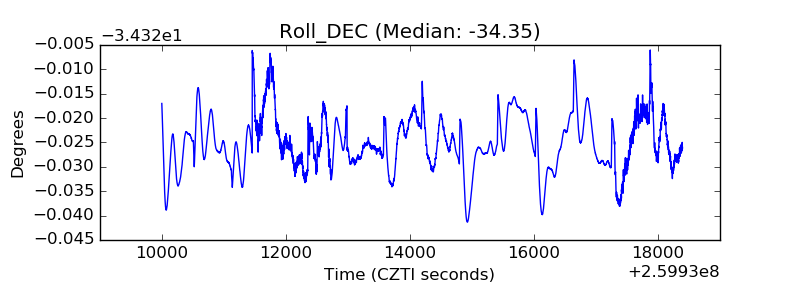 |
| _Roll_RA | 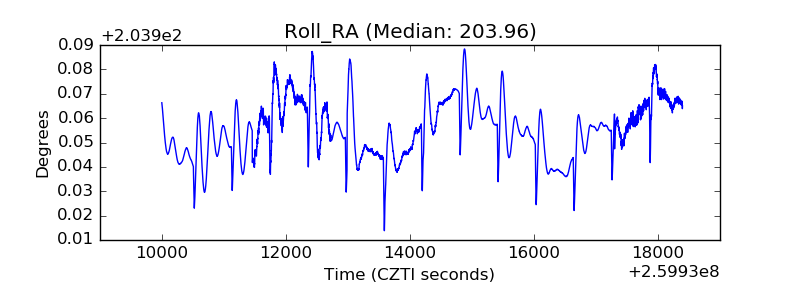 |
| Veto Counter | 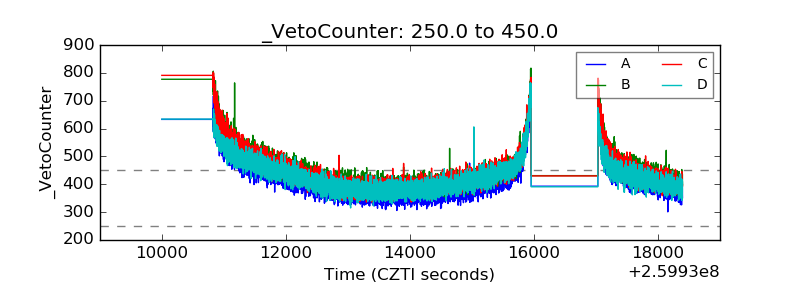 |