| Param | Original file | Final file |
|---|---|---|
| Filename | modeM0/AS1A04_103T01_9000001988_13507cztM0_level2.evt | modeM0/AS1A04_103T01_9000001988_13507cztM0_level2_quad_clean.evt |
| Size (bytes) | 540,887,040 | 98,023,680 |
| Size | 515.8 MB | 93.5 MB |
| Events in quadrant A | 3,560,638 | 619,005 |
| Events in quadrant B | 3,982,499 | 628,716 |
| Events in quadrant C | 3,678,590 | 617,359 |
| Events in quadrant D | 4,657,483 | 589,105 |
| Mode M0 | |||
|---|---|---|---|
| Quadrant | BADHDUFLAG | Total packets | Discarded packets |
| A | 0 | 15455 | 3 |
| B | 0 | 16701 | 2 |
| C | 0 | 15598 | 2 |
| D | 0 | 19120 | 2 |
| Mode SS | |||
|---|---|---|---|
| Quadrant | BADHDUFLAG | Total packets | Discarded packets |
| A | 0 | 150 | 0 |
| B | 0 | 150 | 0 |
| C | 0 | 150 | 0 |
| D | 0 | 150 | 0 |
| Mode M9 | |||
|---|---|---|---|
| Quadrant | BADHDUFLAG | Total packets | Discarded packets |
| A | 0 | 19 | 0 |
| B | 0 | 19 | 0 |
| C | 0 | 19 | 0 |
| D | 0 | 19 | 0 |
| Quadrant | Total seconds | Saturated seconds | Saturation percentage |
|---|---|---|---|
| A | 7396 | 120 | 1.622499% |
| B | 7396 | 159 | 2.149811% |
| C | 7396 | 75 | 1.014062% |
| D | 7396 | 394 | 5.327204% |
Noise dominated data is calculated using 1-second bins in cleaned event files. If a bin has >2000 counts, and if more than 50% of those come from <1% of pixels, then it is considered to be noise-dominated and hence unusable.
| Quadrant | # 1 sec bins | Bins with >0 counts | Bins with >2000 counts | High rate bins dominated by noise | Noise dominated (total time) | Noise dominated (detector-on time) | Marked lightcurve |
|---|---|---|---|---|---|---|---|
| A | 9267 | 7399 | 0 | 0 | 0.00% | 0.00% | 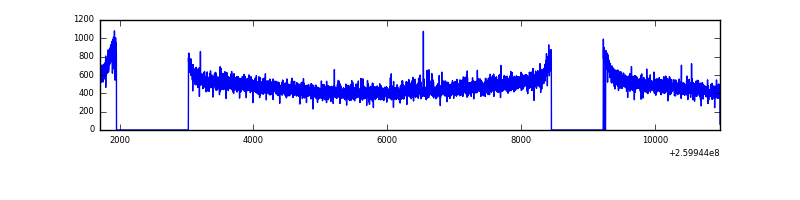 |
| B | 9267 | 7398 | 9 | 9 | 0.10% | 0.12% | 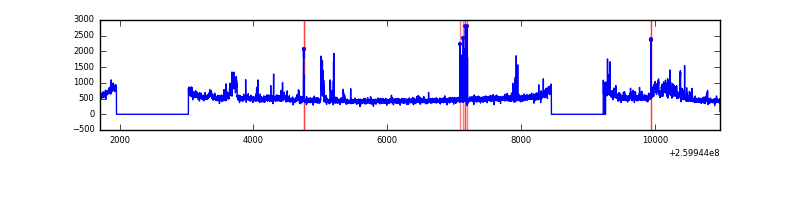 |
| C | 9267 | 7399 | 0 | 0 | 0.00% | 0.00% | 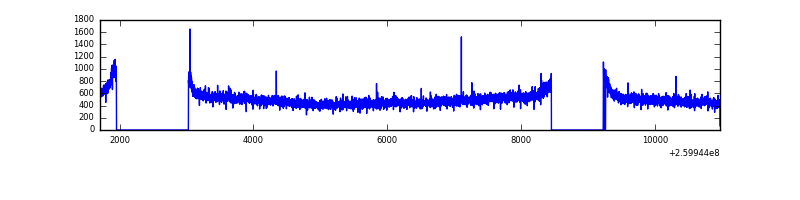 |
| D | 9267 | 7399 | 257 | 257 | 2.77% | 3.47% | 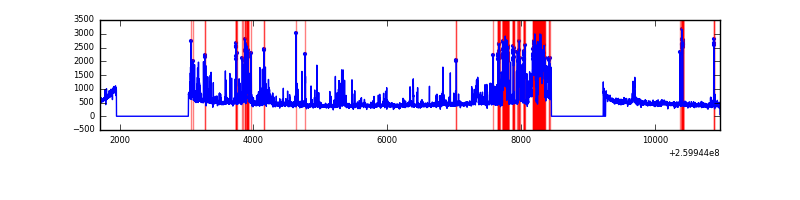 |
Top three noisy pixels from each quadrant. If the there are fewer than three noisy pixels in the level2.evt file, extra rows are filled as -1
| Pixel properties | Quadrant properties | ||||||
|---|---|---|---|---|---|---|---|
| Quadrant | DetID | PixID | Counts | Sigma | Mean | Median | Sigma |
| A | 8 | 15 | 31432 | 164.28 | 913 | 894 | 185.9 |
| A | 1 | 162 | 12323 | 61.48 | 913 | 894 | 185.9 |
| A | 0 | 226 | 8009 | 38.27 | 913 | 894 | 185.9 |
| B | 3 | 64 | 279235 | 1601.33 | 912 | 891 | 173.8 |
| B | 4 | 80 | 49573 | 280.07 | 912 | 891 | 173.8 |
| B | 4 | 173 | 31262 | 174.73 | 912 | 891 | 173.8 |
| C | 3 | 233 | 189547 | 923.54 | 887 | 894 | 204.3 |
| C | 4 | 175 | 24388 | 115.01 | 887 | 894 | 204.3 |
| C | 13 | 61 | 6221 | 26.08 | 887 | 894 | 204.3 |
| D | 12 | 110 | 818436 | 3943.18 | 867 | 842 | 207.3 |
| D | 11 | 129 | 372266 | 1791.34 | 867 | 842 | 207.3 |
| D | 8 | 195 | 119489 | 572.22 | 867 | 842 | 207.3 |
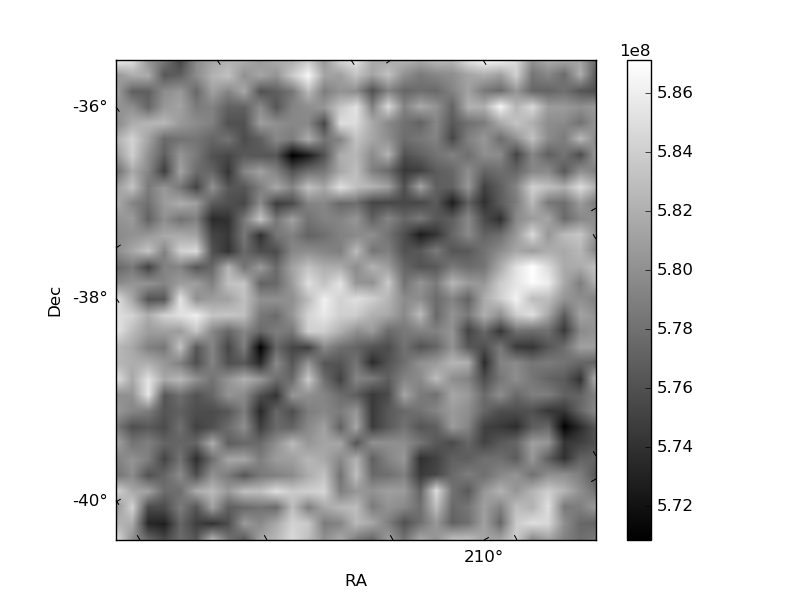
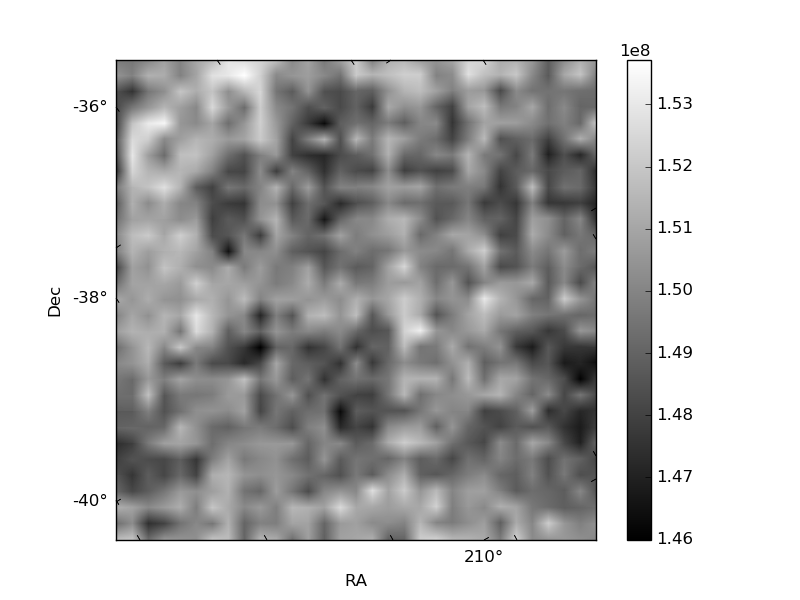
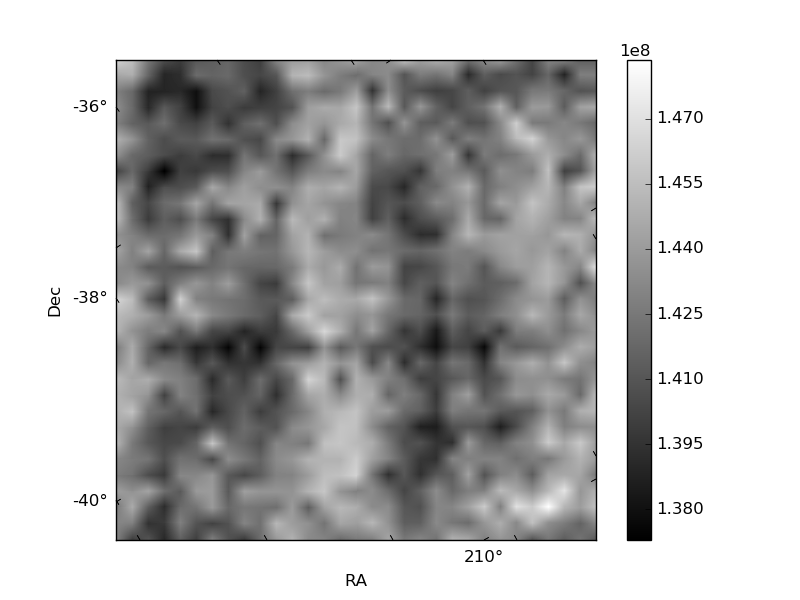
Histogram calculated using DETX and DETY for each event in the final _common_clean file
| Quadrant A | 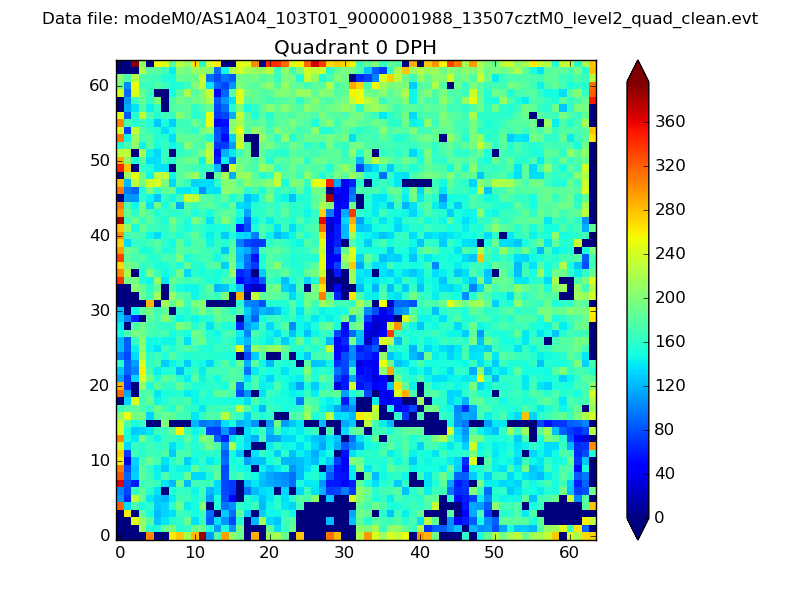 |
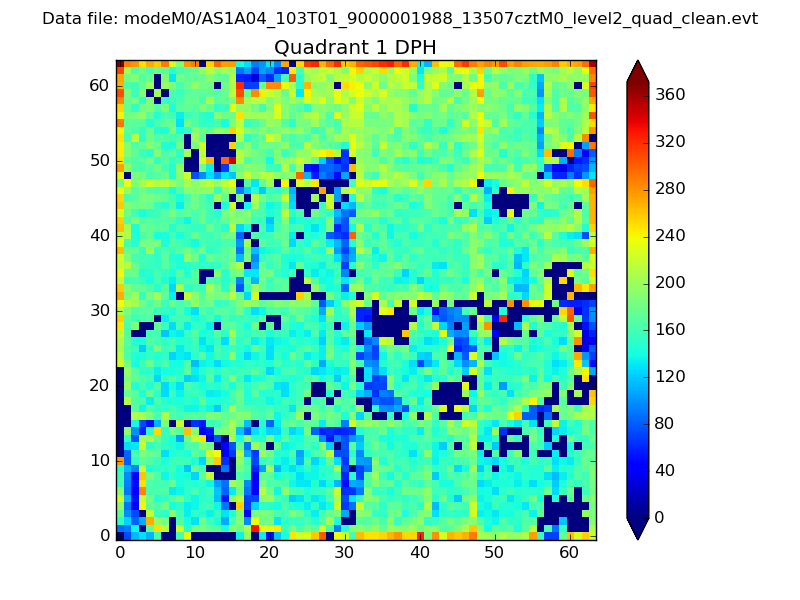 |
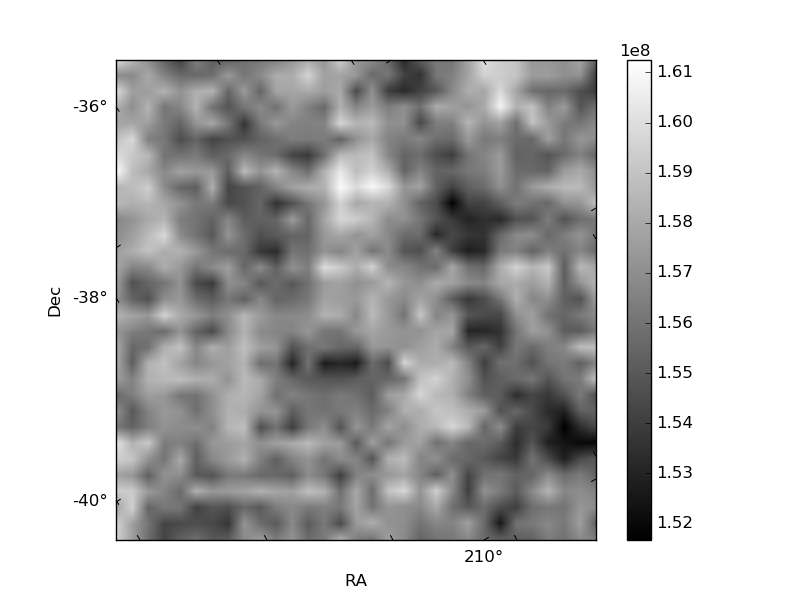
Quadrant B |
|---|---|---|---|
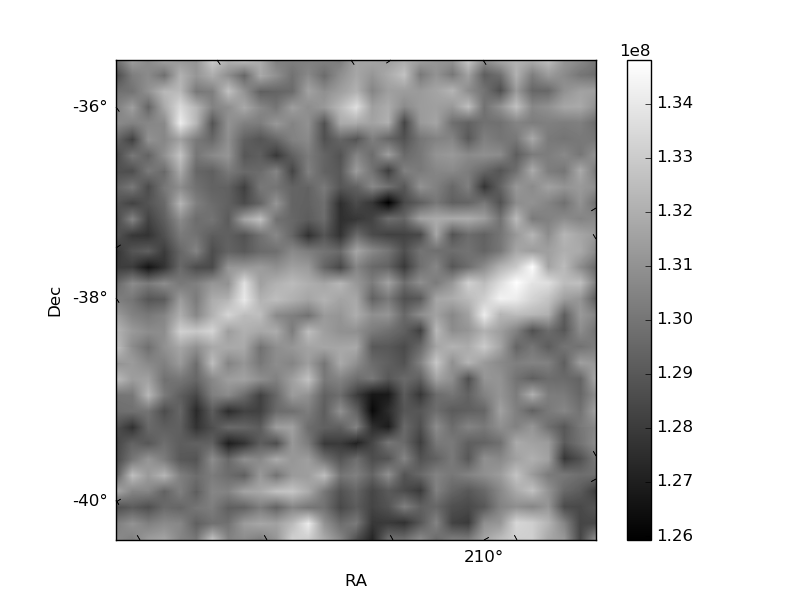
| Quadrant D | 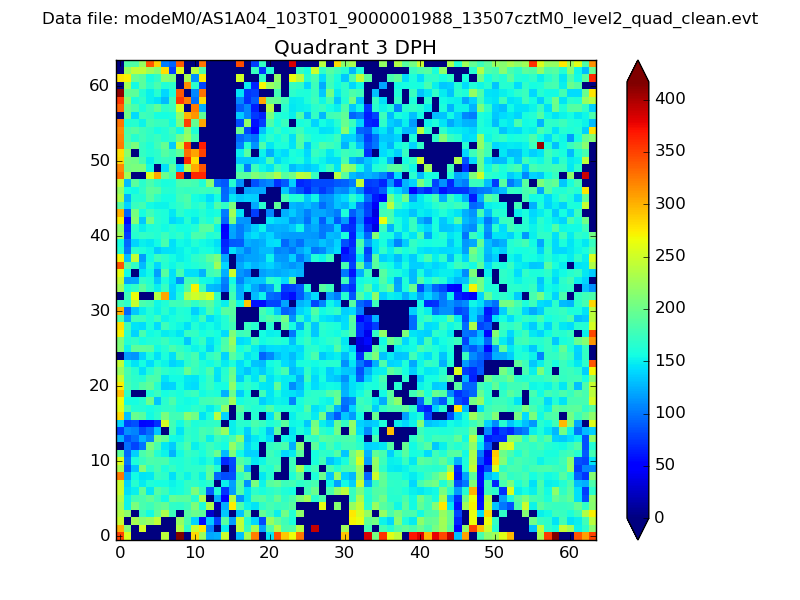 |
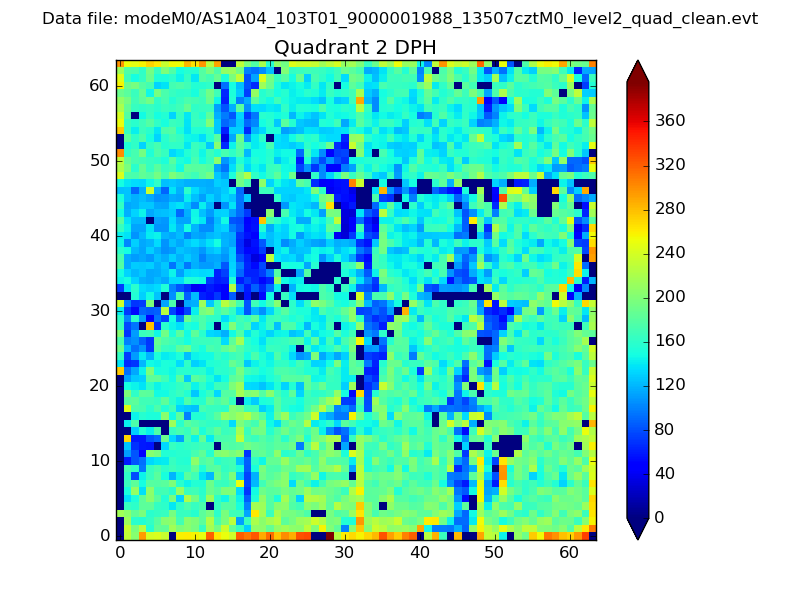 |
Quadrant C |
| Plot type | Count rate plots | Images |
|---|---|---|
| Comparison with Poisson distribution Blue bars denote a histogram of data divided into 1 sec bins. Red curve is a Poisson curve with rate = median count rate of data. |
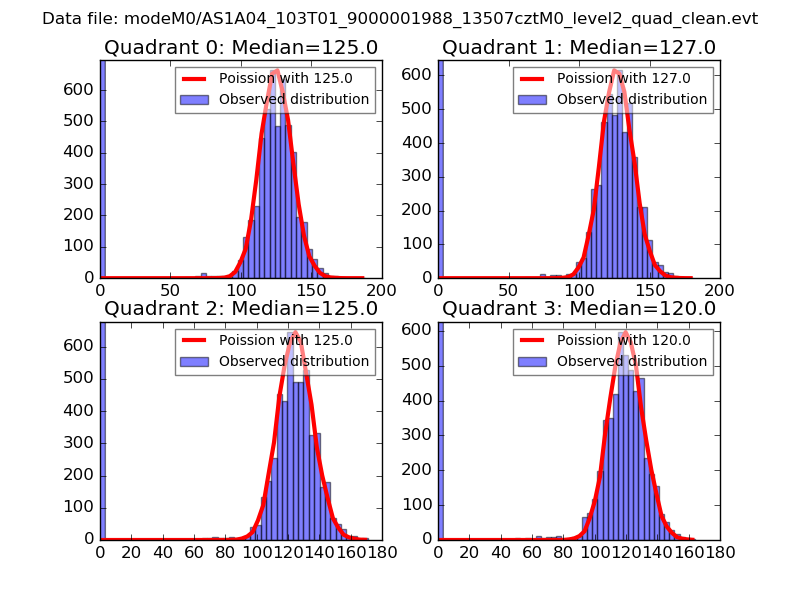 |
 |
| Quadrant-wise count rates Data is divided into 100 sec bins |
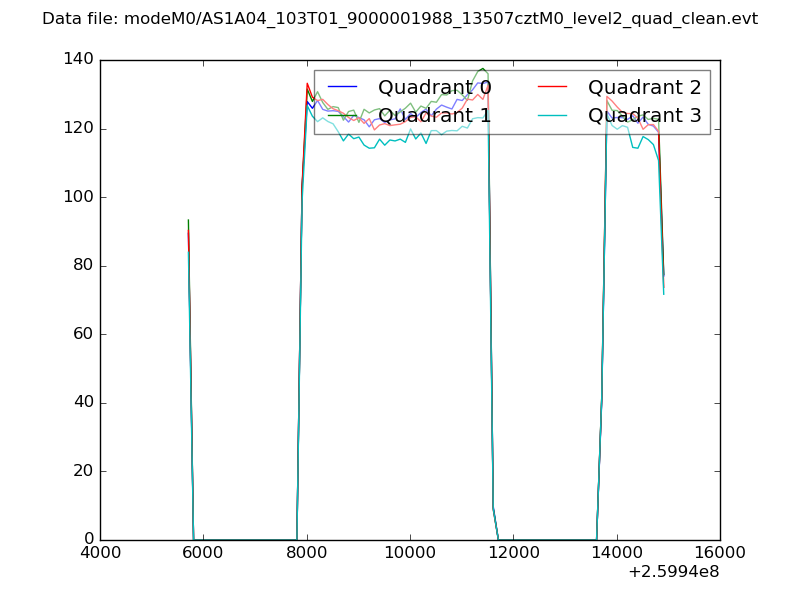 |
|
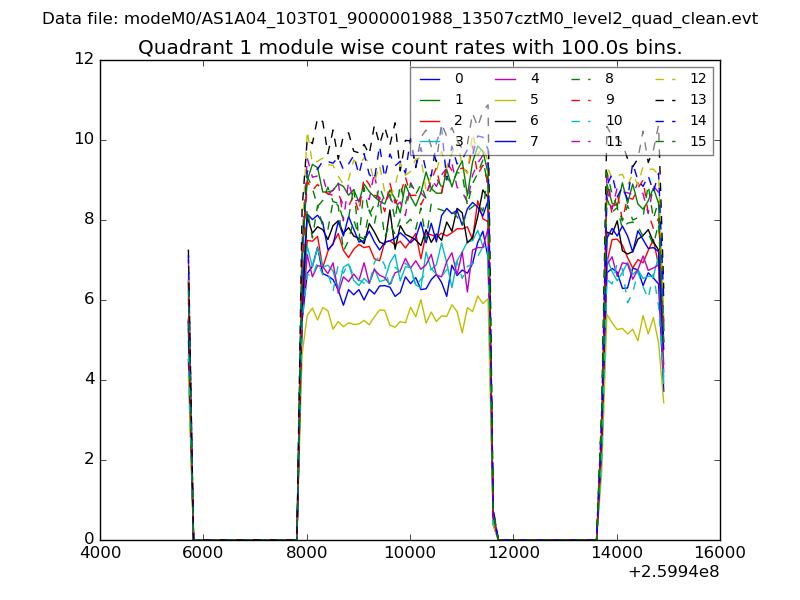
| Module-wise count rates for Quadrant A Data is divided into 100 sec bins |
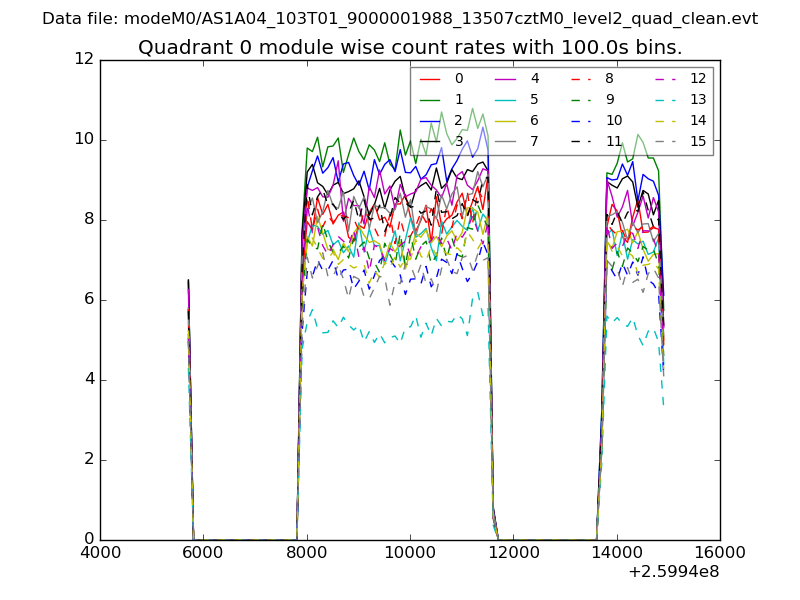 |
 |
| Module-wise count rates for Quadrant B Data is divided into 100 sec bins |
 |
 |
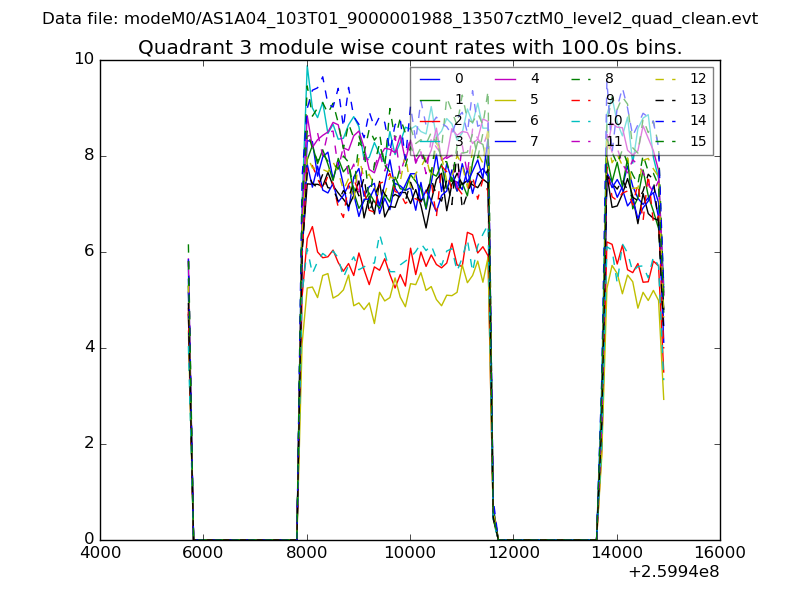
| Module-wise count rates for Quadrant C Data is divided into 100 sec bins |
 |
 |
| Module-wise count rates for Quadrant D Data is divided into 100 sec bins |
 |
 |
| Parameter | Plot |
|---|---|
| CZT HV Monitor |  |
| D_VDD | 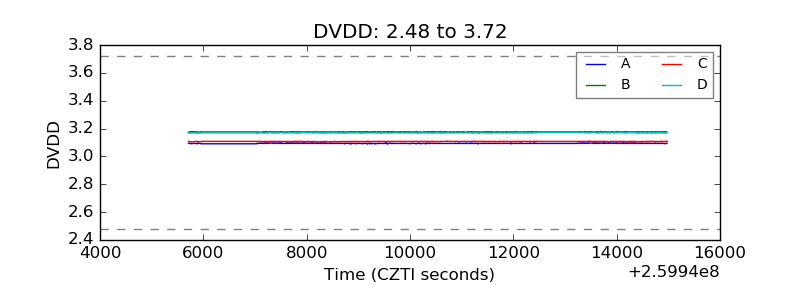 |
| Temperature 1 | 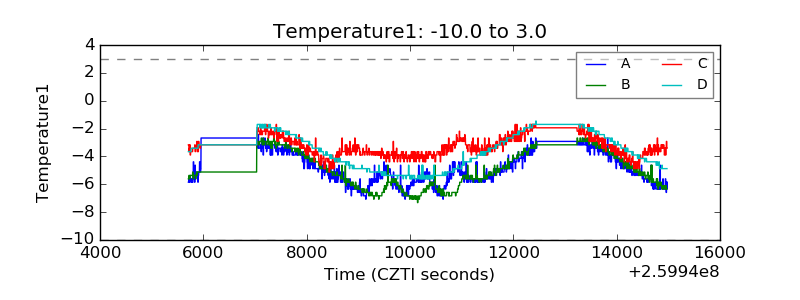 |
| Veto HV Monitor | 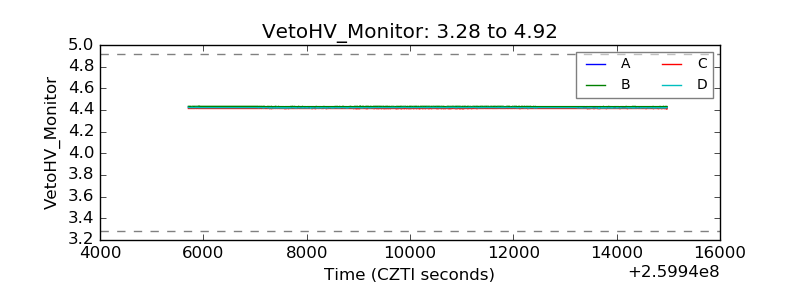 |
| Veto LLD | 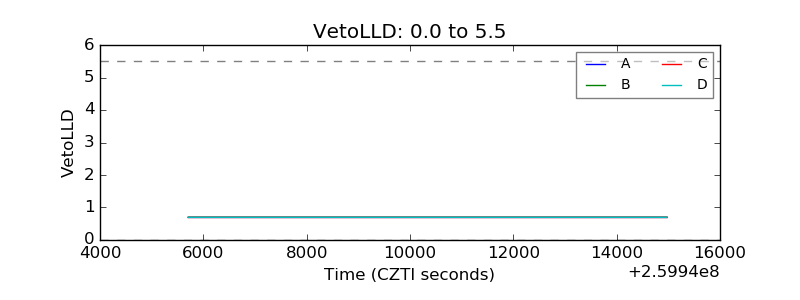 |
| Alpha Counter | 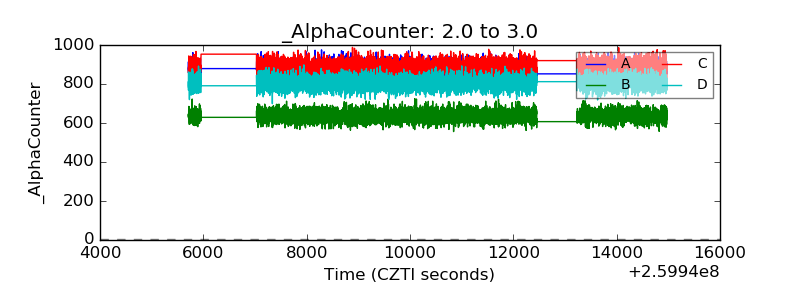 |
| _CPM_Rate | 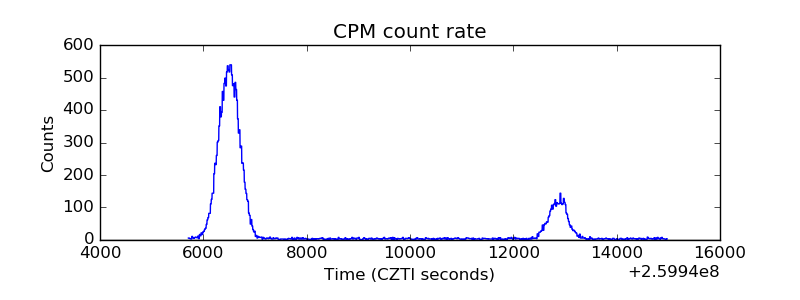 |
| CZT Counter | 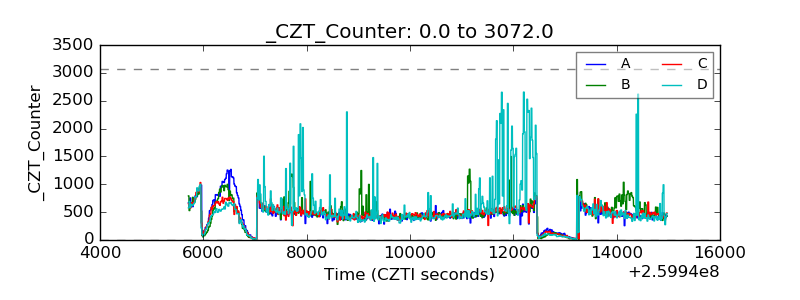 |
| +2.5 Volts monitor | 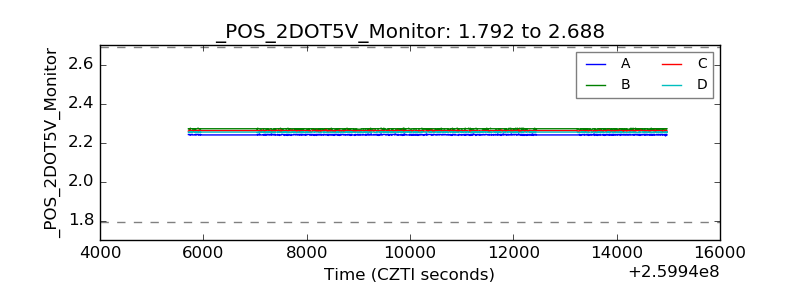 |
| +5 Volts monitor |  |
| _ROLL_ROT |  |
| _Roll_DEC | 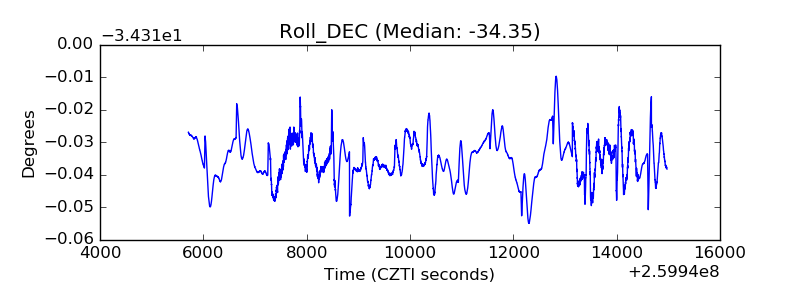 |
| _Roll_RA | 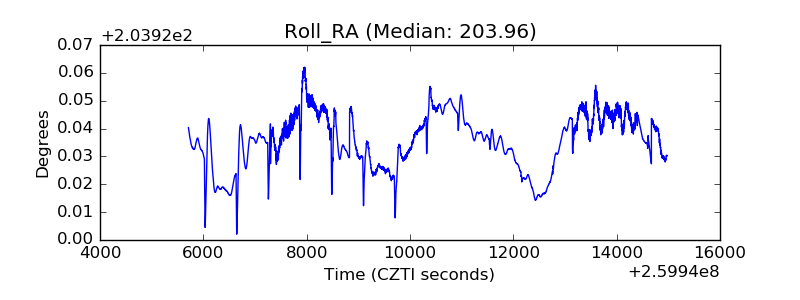 |
| Veto Counter |  |