| Param | Original file | Final file |
|---|---|---|
| Filename | modeM0/AS1A04_103T01_9000001988_13508cztM0_level2.evt | modeM0/AS1A04_103T01_9000001988_13508cztM0_level2_quad_clean.evt |
| Size (bytes) | 584,127,360 | 102,476,160 |
| Size | 557.1 MB | 97.7 MB |
| Events in quadrant A | 3,520,836 | 654,690 |
| Events in quadrant B | 4,403,151 | 662,003 |
| Events in quadrant C | 3,619,102 | 653,116 |
| Events in quadrant D | 5,634,873 | 607,769 |
| Mode M0 | |||
|---|---|---|---|
| Quadrant | BADHDUFLAG | Total packets | Discarded packets |
| A | 0 | 15548 | 2 |
| B | 0 | 18203 | 1 |
| C | 0 | 15558 | 1 |
| D | 0 | 22125 | 1 |
| Mode SS | |||
|---|---|---|---|
| Quadrant | BADHDUFLAG | Total packets | Discarded packets |
| A | 0 | 154 | 0 |
| B | 0 | 154 | 0 |
| C | 0 | 154 | 0 |
| D | 0 | 154 | 0 |
| Mode M9 | |||
|---|---|---|---|
| Quadrant | BADHDUFLAG | Total packets | Discarded packets |
| A | 0 | 3 | 0 |
| B | 0 | 3 | 0 |
| C | 0 | 3 | 0 |
| D | 0 | 3 | 0 |
| Quadrant | Total seconds | Saturated seconds | Saturation percentage |
|---|---|---|---|
| A | 7555 | 55 | 0.727995% |
| B | 7555 | 219 | 2.898743% |
| C | 7555 | 22 | 0.291198% |
| D | 7555 | 598 | 7.915288% |
Noise dominated data is calculated using 1-second bins in cleaned event files. If a bin has >2000 counts, and if more than 50% of those come from <1% of pixels, then it is considered to be noise-dominated and hence unusable.
| Quadrant | # 1 sec bins | Bins with >0 counts | Bins with >2000 counts | High rate bins dominated by noise | Noise dominated (total time) | Noise dominated (detector-on time) | Marked lightcurve |
|---|---|---|---|---|---|---|---|
| A | 7931 | 7557 | 0 | 0 | 0.00% | 0.00% | 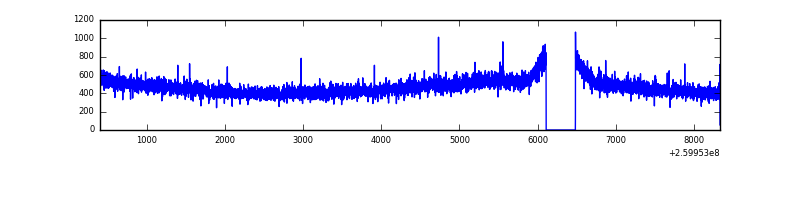 |
| B | 7931 | 7556 | 57 | 57 | 0.72% | 0.75% | 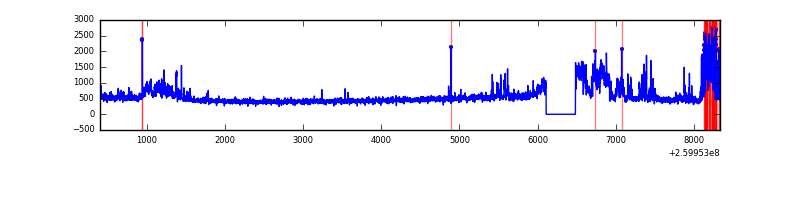 |
| C | 7931 | 7557 | 0 | 0 | 0.00% | 0.00% | 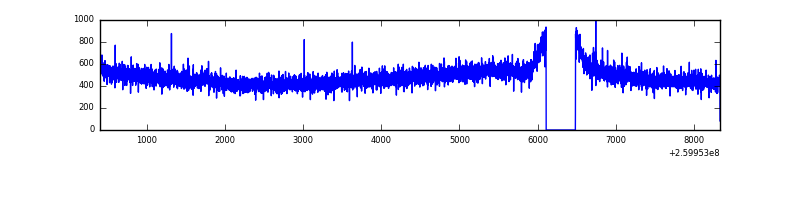 |
| D | 7931 | 7557 | 636 | 636 | 8.02% | 8.42% | 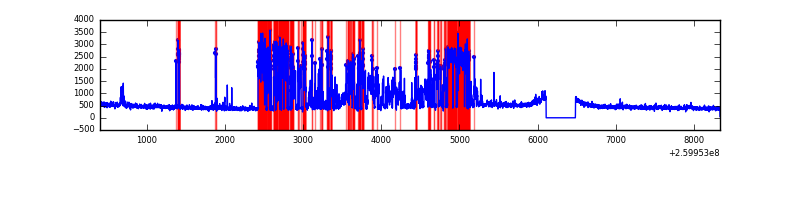 |
Top three noisy pixels from each quadrant. If the there are fewer than three noisy pixels in the level2.evt file, extra rows are filled as -1
| Pixel properties | Quadrant properties | ||||||
|---|---|---|---|---|---|---|---|
| Quadrant | DetID | PixID | Counts | Sigma | Mean | Median | Sigma |
| A | 8 | 15 | 61183 | 328.01 | 898 | 877 | 183.9 |
| A | 14 | 238 | 9427 | 46.5 | 898 | 877 | 183.9 |
| A | 0 | 226 | 7976 | 38.61 | 898 | 877 | 183.9 |
| B | 3 | 64 | 814581 | 4783.77 | 895 | 873 | 170.1 |
| B | 0 | 230 | 28178 | 160.53 | 895 | 873 | 170.1 |
| B | 4 | 142 | 24323 | 137.86 | 895 | 873 | 170.1 |
| C | 3 | 233 | 217078 | 1062.98 | 871 | 875 | 203.4 |
| C | 13 | 61 | 6410 | 27.21 | 871 | 875 | 203.4 |
| C | 8 | 222 | 2776 | 9.35 | 871 | 875 | 203.4 |
| D | 12 | 110 | 2293449 | 11375.97 | 836 | 813 | 201.5 |
| D | 2 | 136 | 82946 | 407.54 | 836 | 813 | 201.5 |
| D | 8 | 195 | 71584 | 351.16 | 836 | 813 | 201.5 |
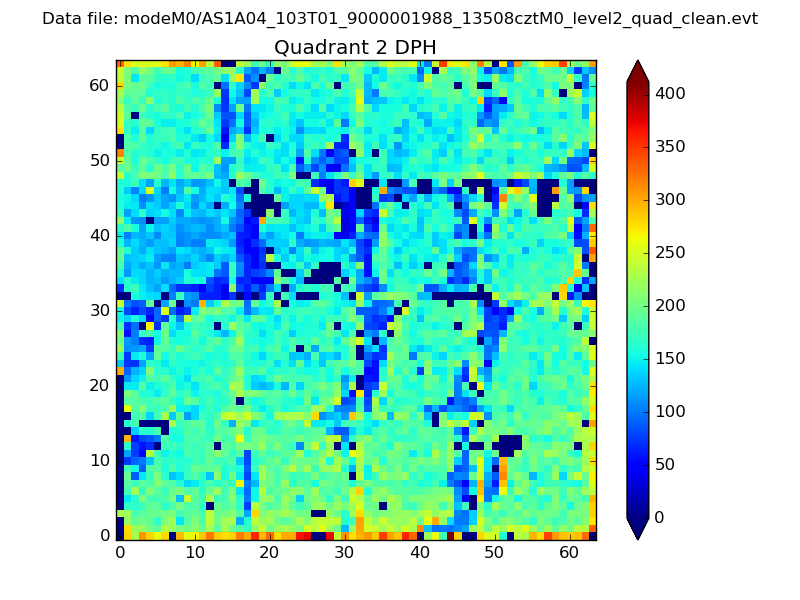
Histogram calculated using DETX and DETY for each event in the final _common_clean file
| Quadrant A | 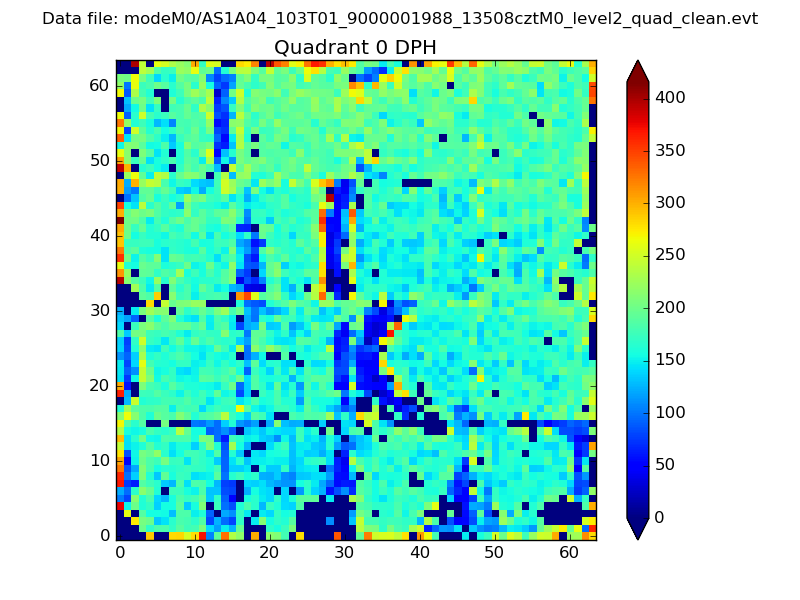 |
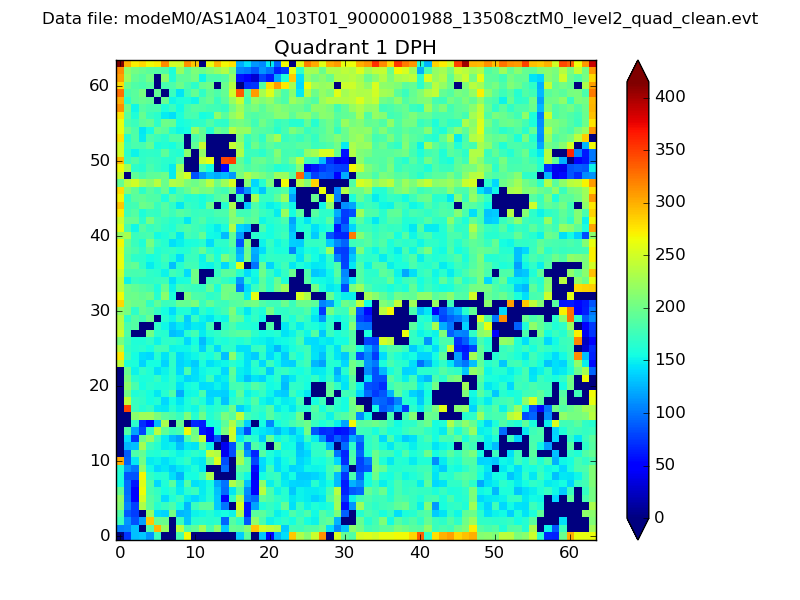 |
Quadrant B |
|---|---|---|---|
| Quadrant D | 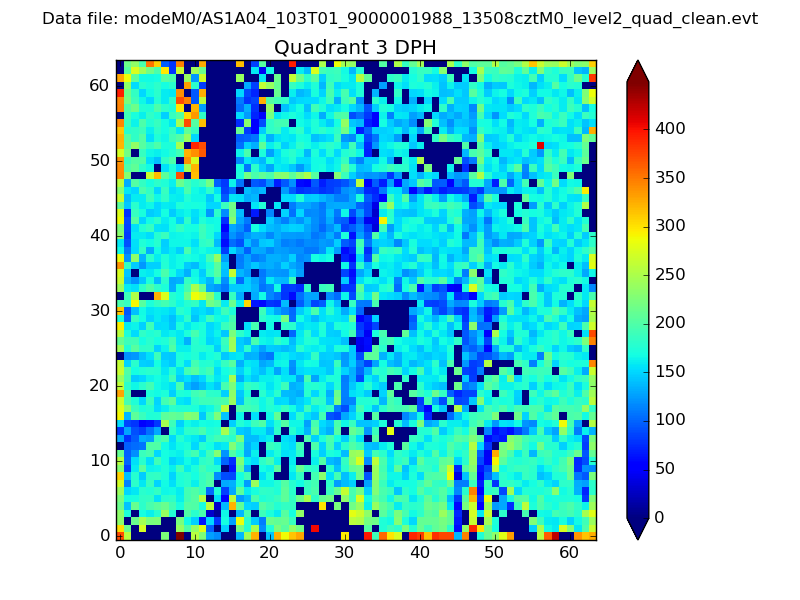 |
 |
Quadrant C |
| Plot type | Count rate plots | Images |
|---|---|---|
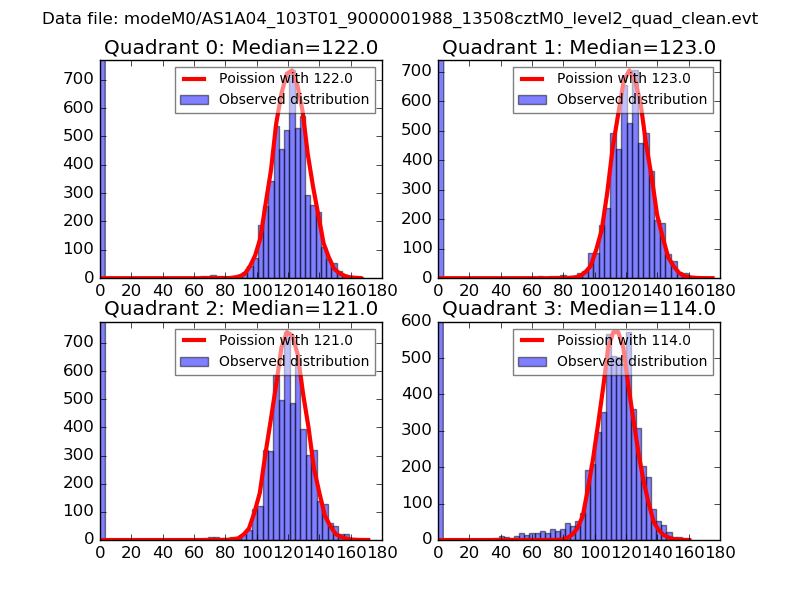
| Comparison with Poisson distribution Blue bars denote a histogram of data divided into 1 sec bins. Red curve is a Poisson curve with rate = median count rate of data. |
 |
 |
| Quadrant-wise count rates Data is divided into 100 sec bins |
 |
|
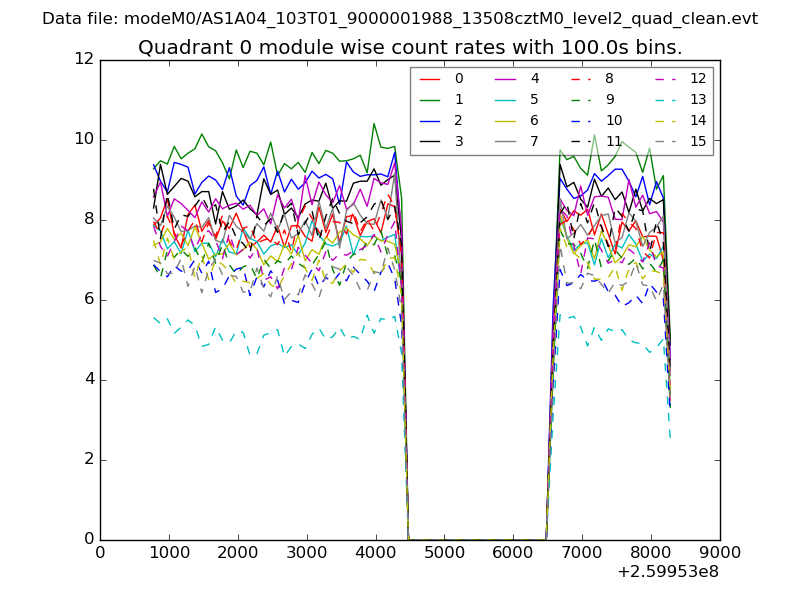
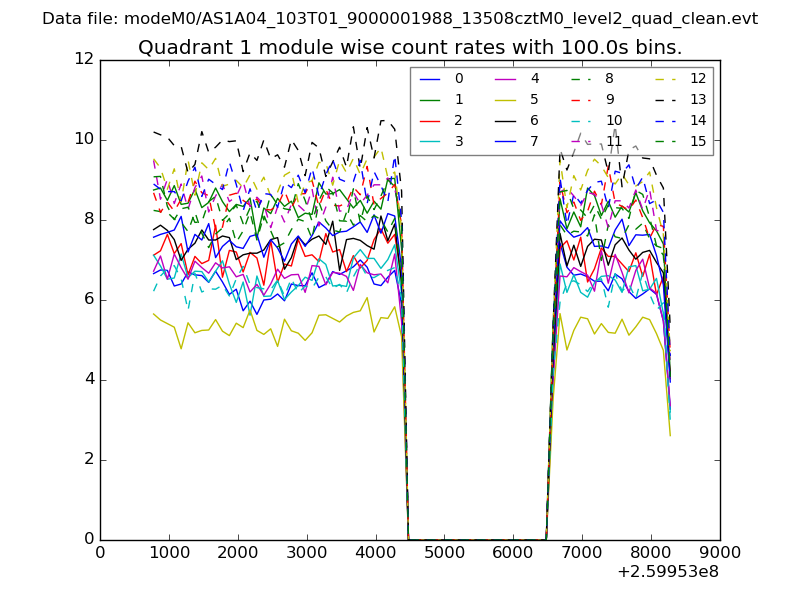
| Module-wise count rates for Quadrant A Data is divided into 100 sec bins |
 |
 |
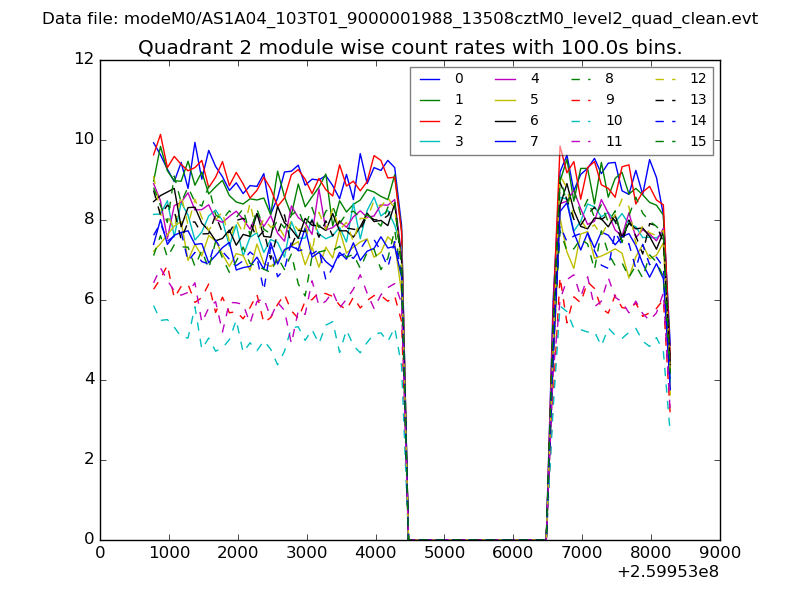
| Module-wise count rates for Quadrant B Data is divided into 100 sec bins |
 |
 |
| Module-wise count rates for Quadrant C Data is divided into 100 sec bins |
 |
 |
| Module-wise count rates for Quadrant D Data is divided into 100 sec bins |
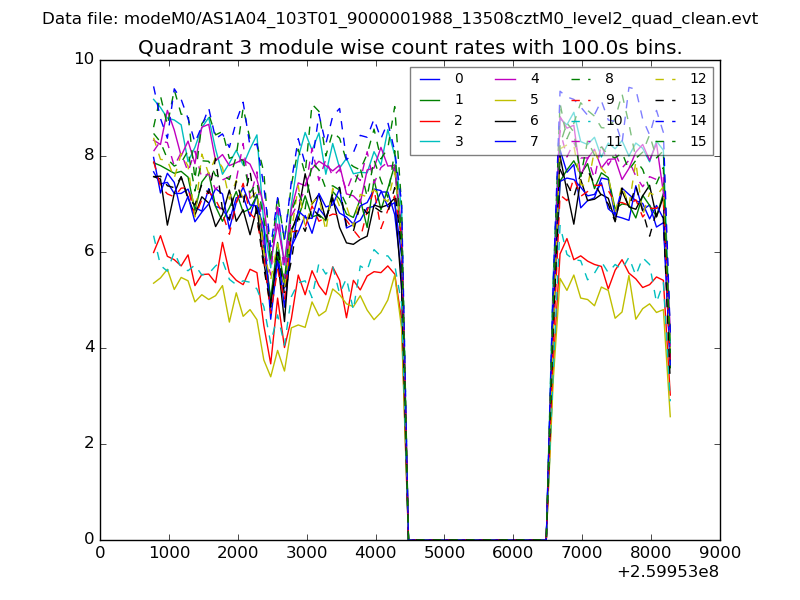 |
 |
| Parameter | Plot |
|---|---|
| CZT HV Monitor | 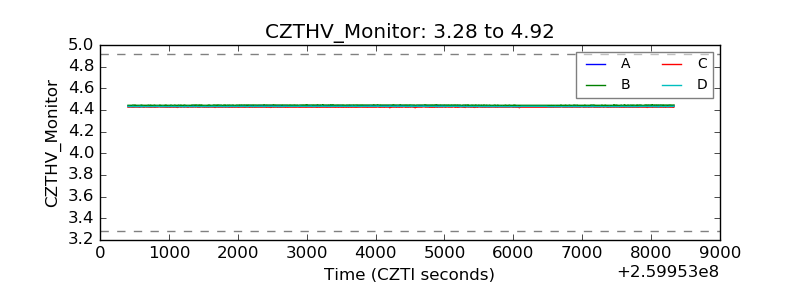 |
| D_VDD | 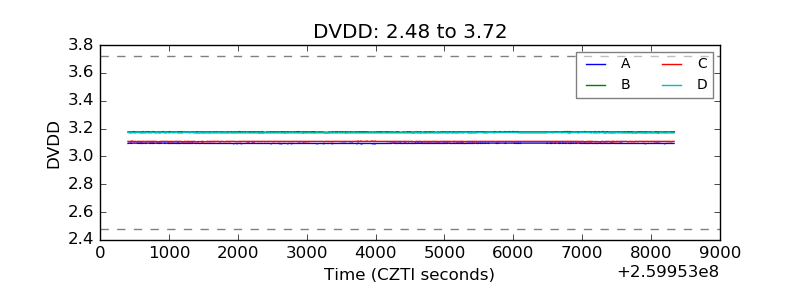 |
| Temperature 1 | 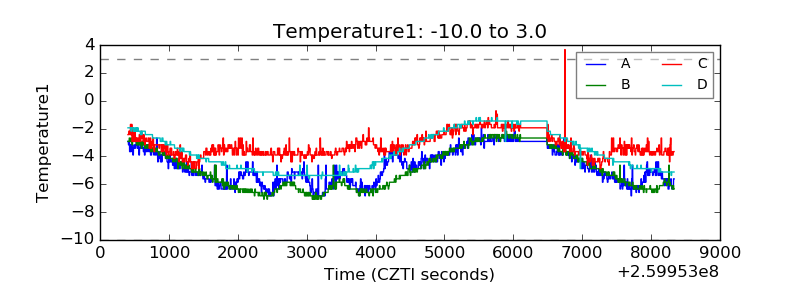 |
| Veto HV Monitor | 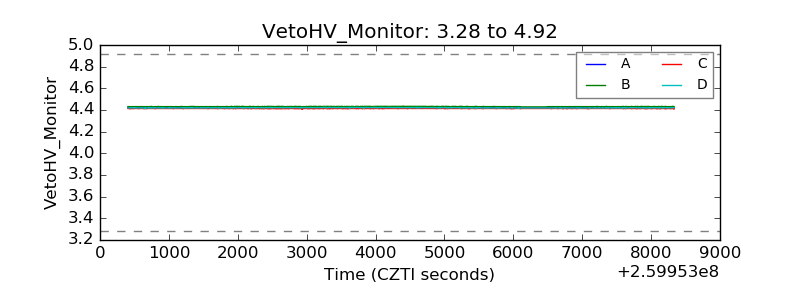 |
| Veto LLD | 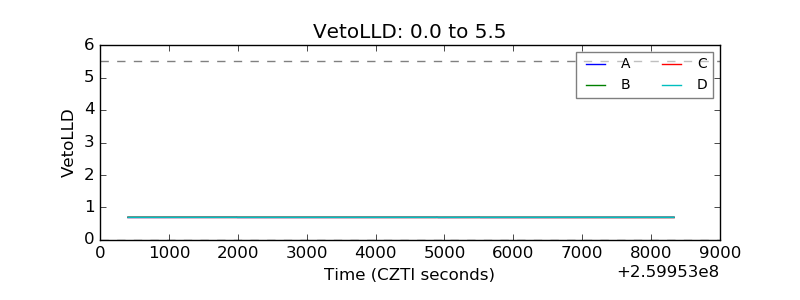 |
| Alpha Counter | 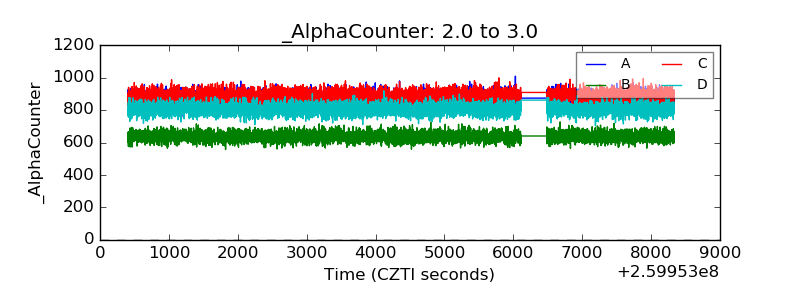 |
| _CPM_Rate | 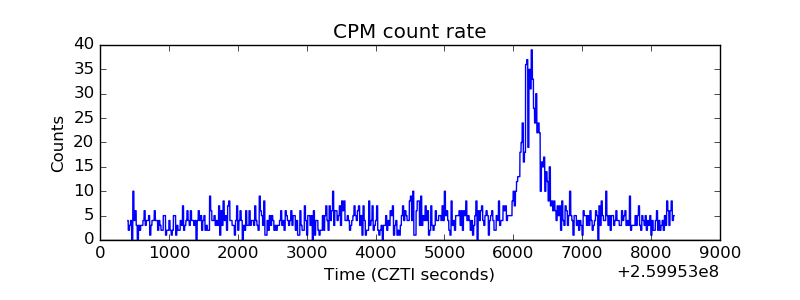 |
| CZT Counter | 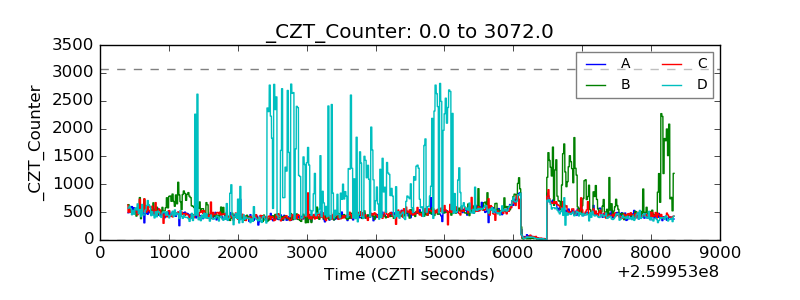 |
| +2.5 Volts monitor | 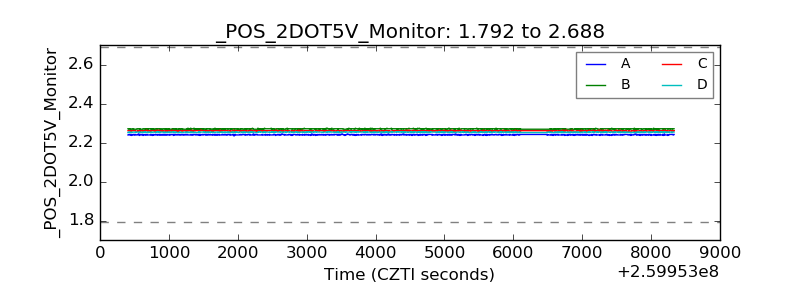 |
| +5 Volts monitor |  |
| _ROLL_ROT | 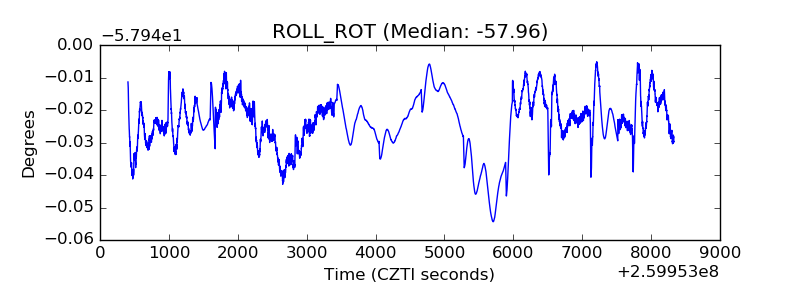 |
| _Roll_DEC | 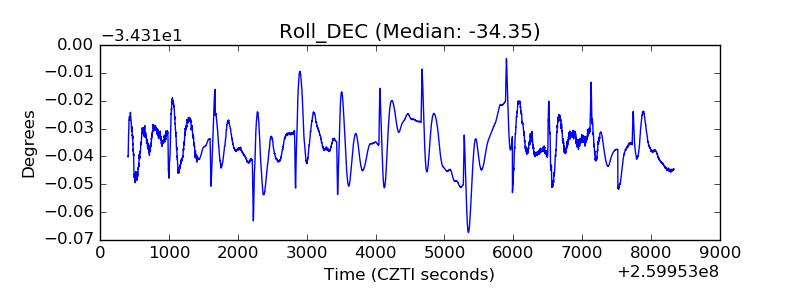 |
| _Roll_RA | 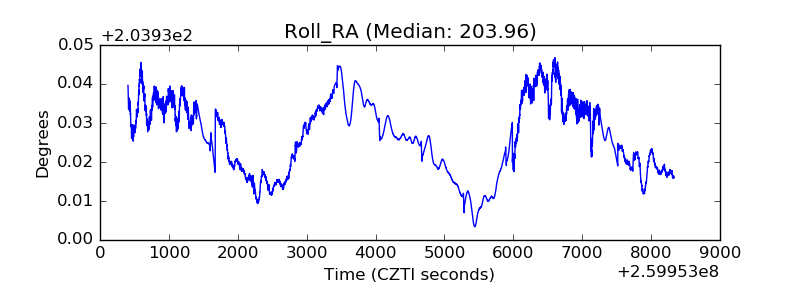 |
| Veto Counter | 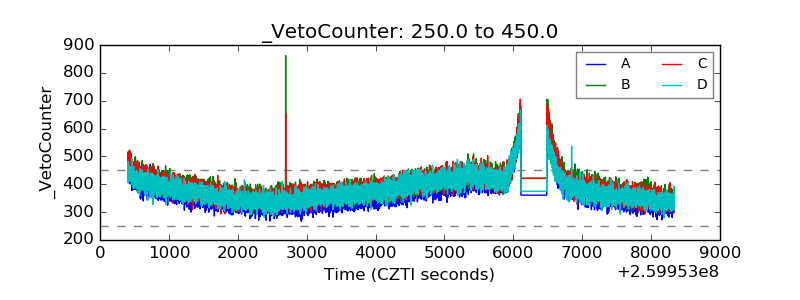 |