| Param | Original file | Final file |
|---|---|---|
| Filename | modeM0/AS1A04_103T01_9000001988_13509cztM0_level2.evt | modeM0/AS1A04_103T01_9000001988_13509cztM0_level2_quad_clean.evt |
| Size (bytes) | 505,920,960 | 84,072,960 |
| Size | 482.5 MB | 80.2 MB |
| Events in quadrant A | 3,338,547 | 518,291 |
| Events in quadrant B | 4,694,473 | 521,991 |
| Events in quadrant C | 3,545,593 | 517,483 |
| Events in quadrant D | 3,264,875 | 497,288 |
| Mode M0 | |||
|---|---|---|---|
| Quadrant | BADHDUFLAG | Total packets | Discarded packets |
| A | 0 | 14691 | 2 |
| B | 0 | 18721 | 2 |
| C | 0 | 14893 | 2 |
| D | 0 | 14730 | 2 |
| Mode SS | |||
|---|---|---|---|
| Quadrant | BADHDUFLAG | Total packets | Discarded packets |
| A | 0 | 148 | 0 |
| B | 0 | 148 | 0 |
| C | 0 | 148 | 0 |
| D | 0 | 148 | 0 |
| Mode M9 | |||
|---|---|---|---|
| Quadrant | BADHDUFLAG | Total packets | Discarded packets |
| A | 0 | 6 | 0 |
| B | 0 | 6 | 0 |
| C | 0 | 6 | 0 |
| D | 0 | 6 | 0 |
| Quadrant | Total seconds | Saturated seconds | Saturation percentage |
|---|---|---|---|
| A | 7033 | 69 | 0.981089% |
| B | 7033 | 370 | 5.260913% |
| C | 7033 | 32 | 0.454998% |
| D | 7033 | 20 | 0.284374% |
Noise dominated data is calculated using 1-second bins in cleaned event files. If a bin has >2000 counts, and if more than 50% of those come from <1% of pixels, then it is considered to be noise-dominated and hence unusable.
| Quadrant | # 1 sec bins | Bins with >0 counts | Bins with >2000 counts | High rate bins dominated by noise | Noise dominated (total time) | Noise dominated (detector-on time) | Marked lightcurve |
|---|---|---|---|---|---|---|---|
| A | 7724 | 7036 | 0 | 0 | 0.00% | 0.00% | 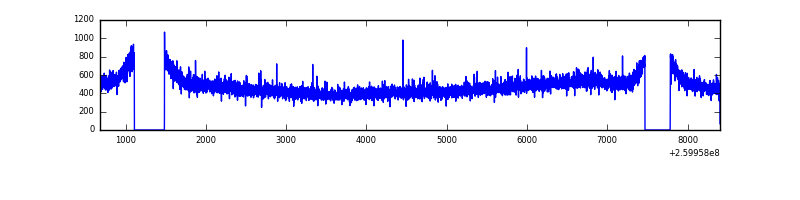 |
| B | 7724 | 7035 | 174 | 174 | 2.25% | 2.47% | 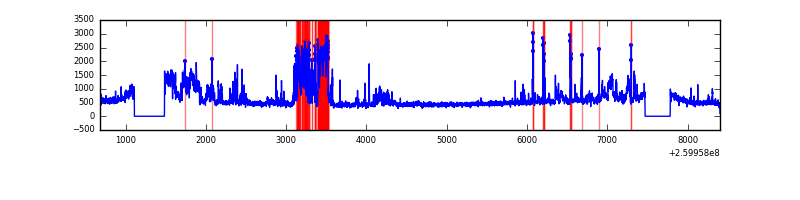 |
| C | 7724 | 7036 | 0 | 0 | 0.00% | 0.00% | 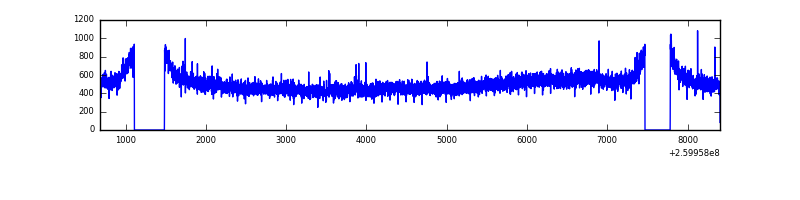 |
| D | 7724 | 7036 | 2 | 2 | 0.03% | 0.03% | 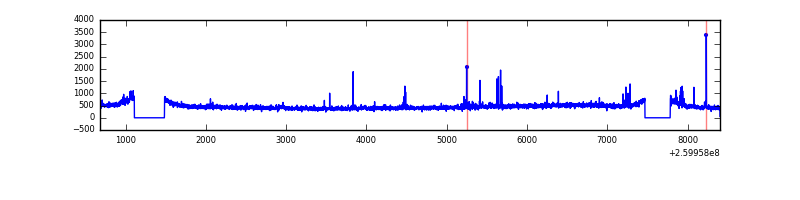 |
Top three noisy pixels from each quadrant. If the there are fewer than three noisy pixels in the level2.evt file, extra rows are filled as -1
| Pixel properties | Quadrant properties | ||||||
|---|---|---|---|---|---|---|---|
| Quadrant | DetID | PixID | Counts | Sigma | Mean | Median | Sigma |
| A | 8 | 15 | 29605 | 162.76 | 860 | 840 | 176.7 |
| A | 0 | 226 | 7761 | 39.16 | 860 | 840 | 176.7 |
| A | 12 | 194 | 6553 | 32.33 | 860 | 840 | 176.7 |
| B | 3 | 64 | 1222168 | 7453.73 | 853 | 833 | 163.9 |
| B | 4 | 142 | 69051 | 416.33 | 853 | 833 | 163.9 |
| B | 0 | 214 | 25826 | 152.53 | 853 | 833 | 163.9 |
| C | 3 | 233 | 271121 | 1387.43 | 836 | 842 | 194.8 |
| C | 10 | 223 | 7154 | 32.4 | 836 | 842 | 194.8 |
| C | 13 | 61 | 6048 | 26.72 | 836 | 842 | 194.8 |
| D | 8 | 195 | 34748 | 168.83 | 829 | 805 | 201.0 |
| D | 2 | 234 | 26210 | 126.36 | 829 | 805 | 201.0 |
| D | 14 | 35 | 24351 | 117.12 | 829 | 805 | 201.0 |
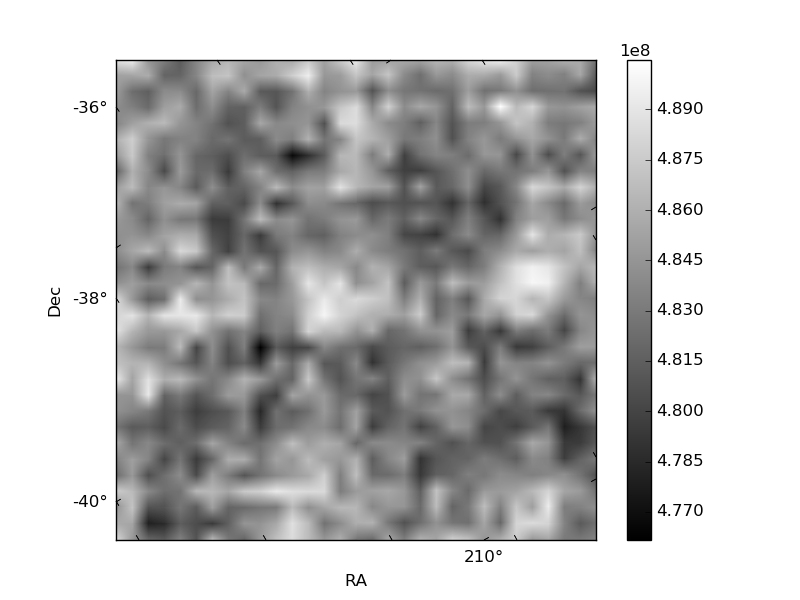
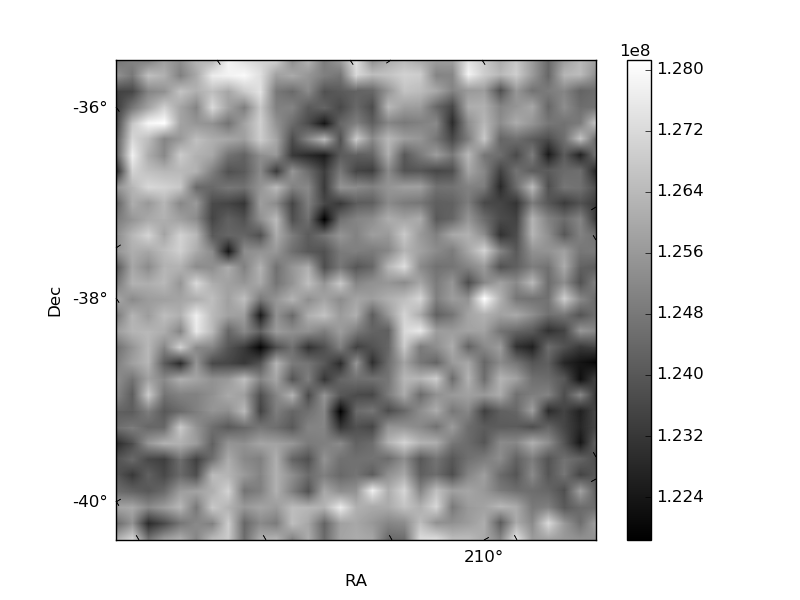
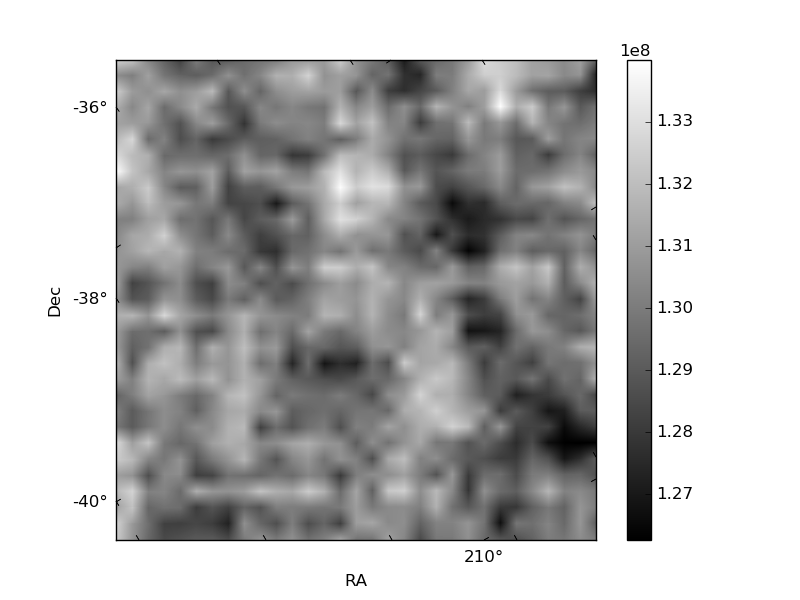
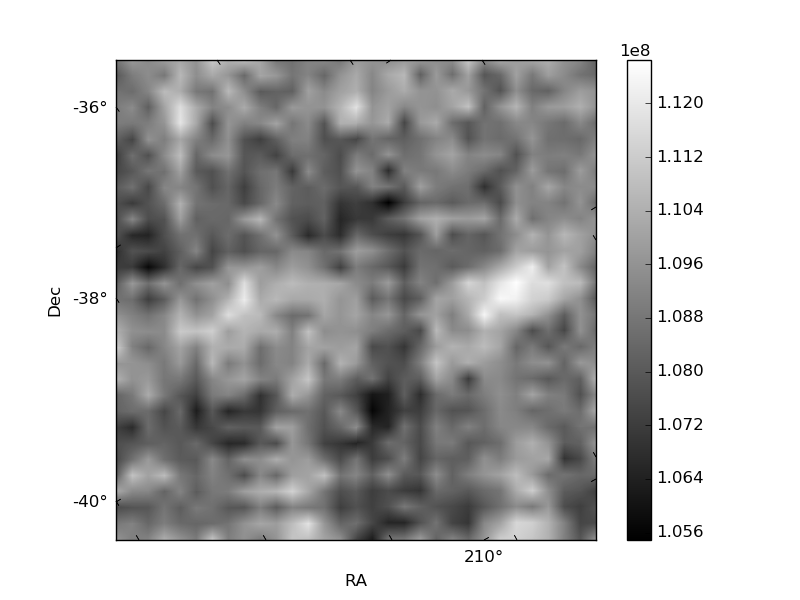
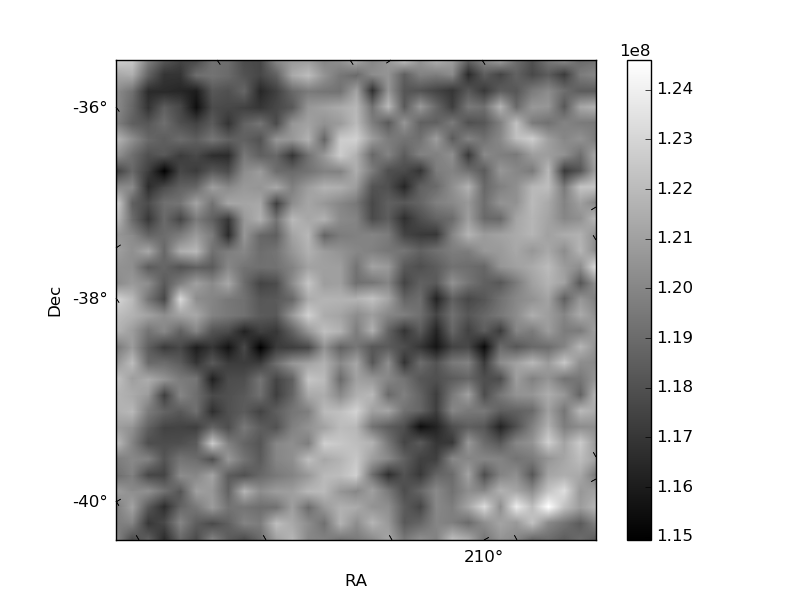
Histogram calculated using DETX and DETY for each event in the final _common_clean file
| Quadrant A | 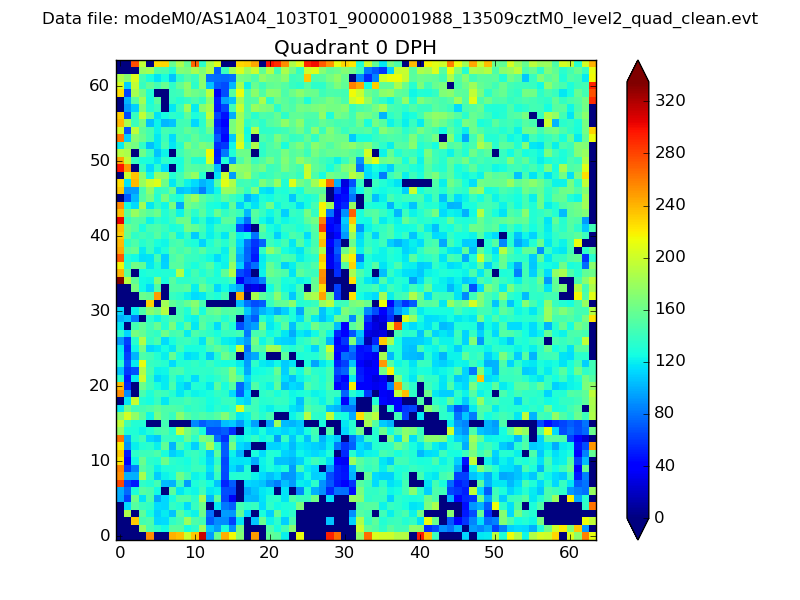 |
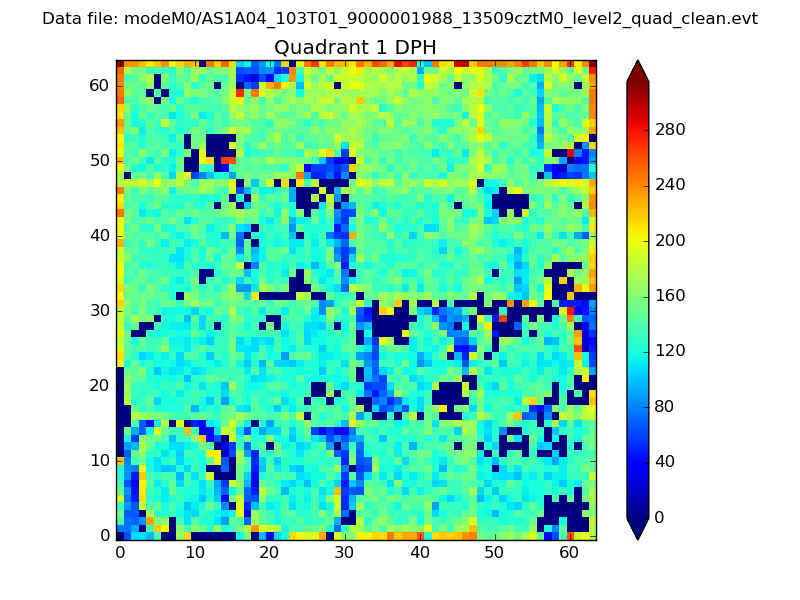 |
Quadrant B |
|---|---|---|---|
| Quadrant D | 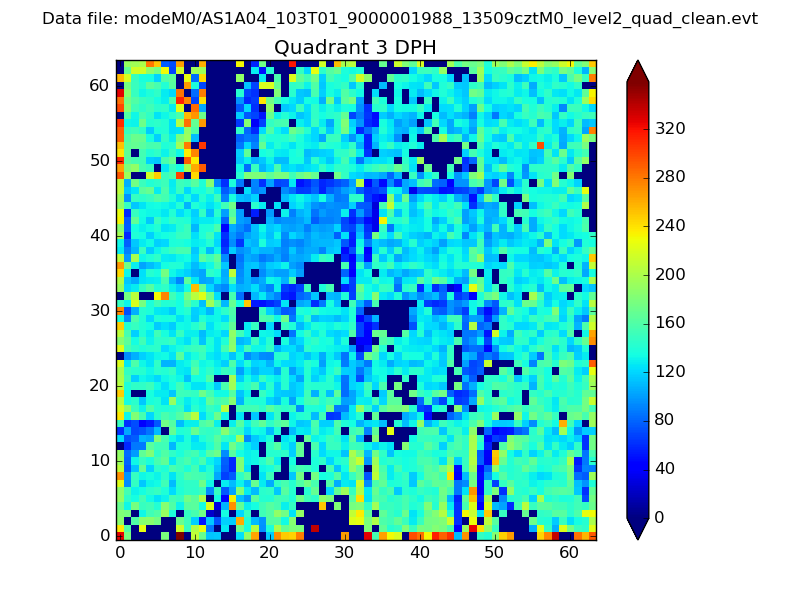 |
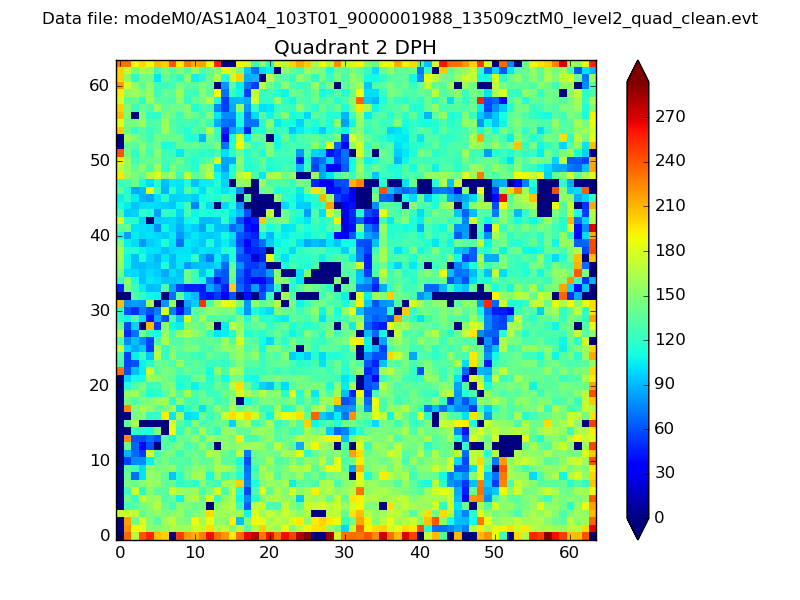 |
Quadrant C |
| Plot type | Count rate plots | Images |
|---|---|---|
| Comparison with Poisson distribution Blue bars denote a histogram of data divided into 1 sec bins. Red curve is a Poisson curve with rate = median count rate of data. |
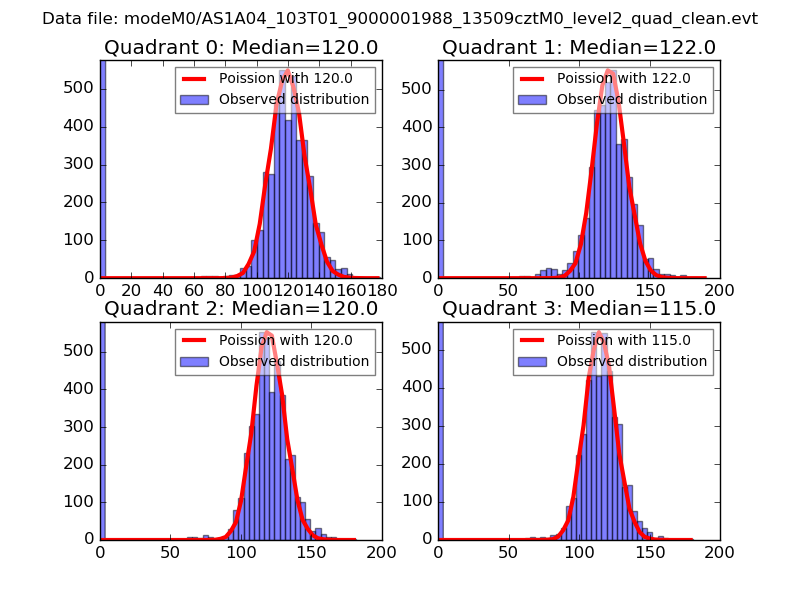 |
 |
| Quadrant-wise count rates Data is divided into 100 sec bins |
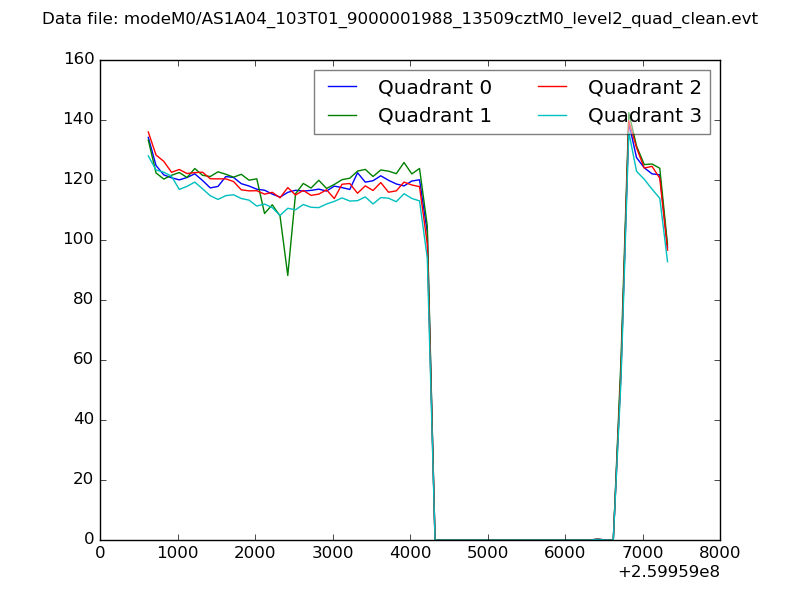 |
|
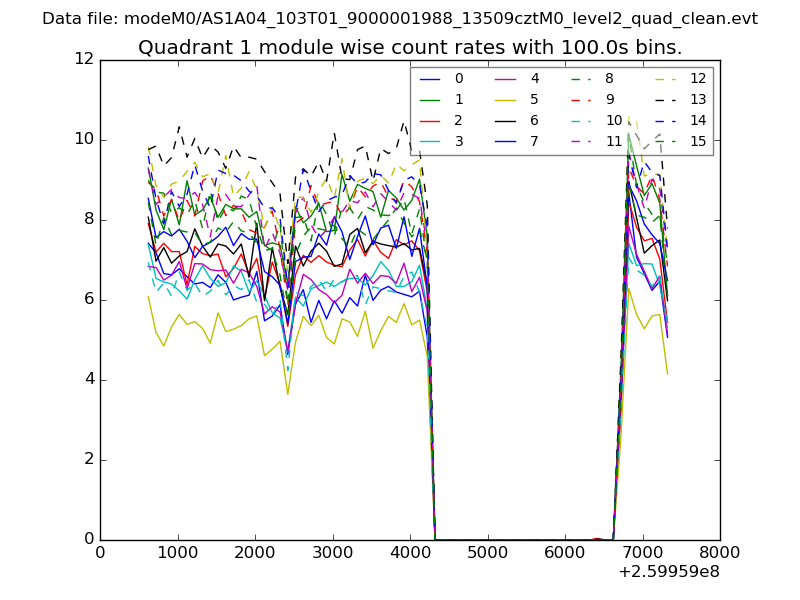
| Module-wise count rates for Quadrant A Data is divided into 100 sec bins |
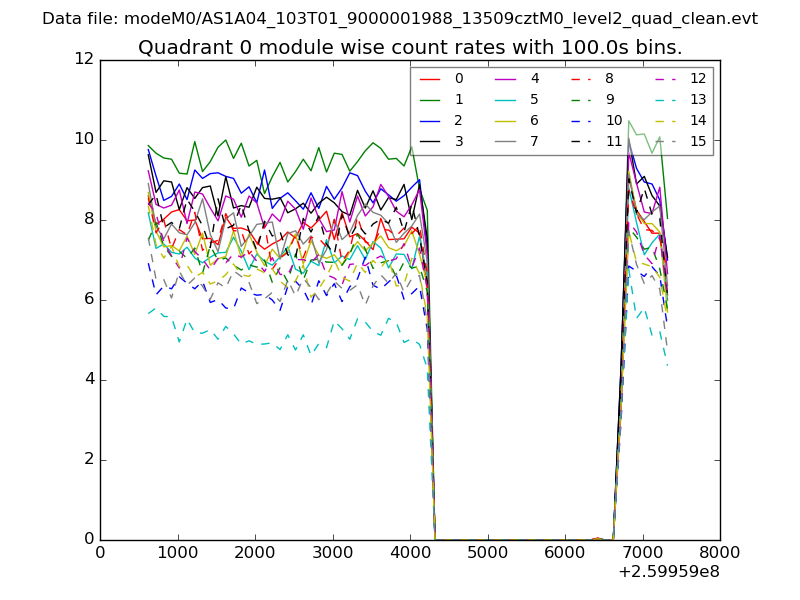 |
 |
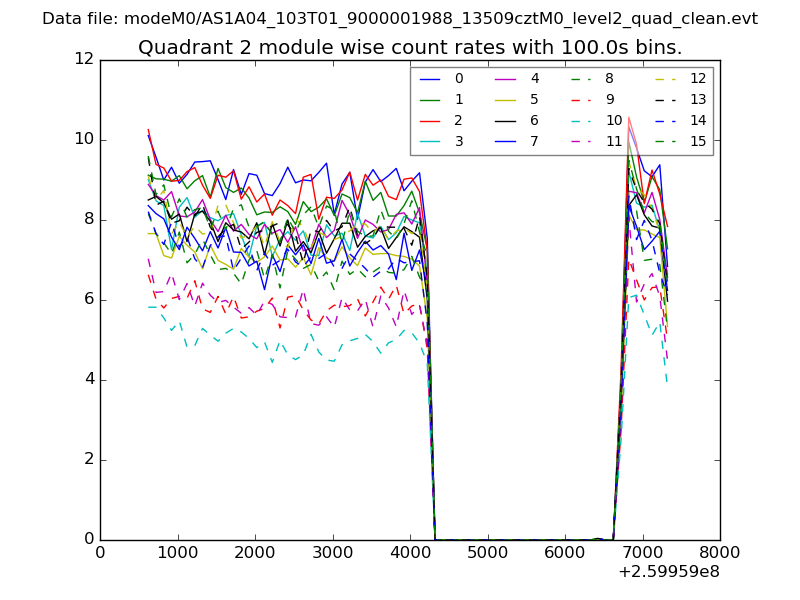
| Module-wise count rates for Quadrant B Data is divided into 100 sec bins |
 |
 |
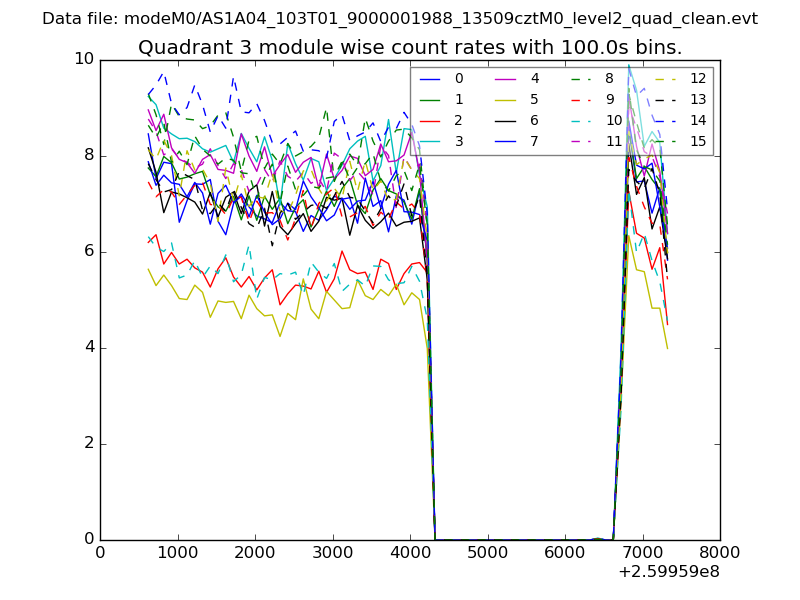
| Module-wise count rates for Quadrant C Data is divided into 100 sec bins |
 |
 |
| Module-wise count rates for Quadrant D Data is divided into 100 sec bins |
 |
 |
| Parameter | Plot |
|---|---|
| CZT HV Monitor | 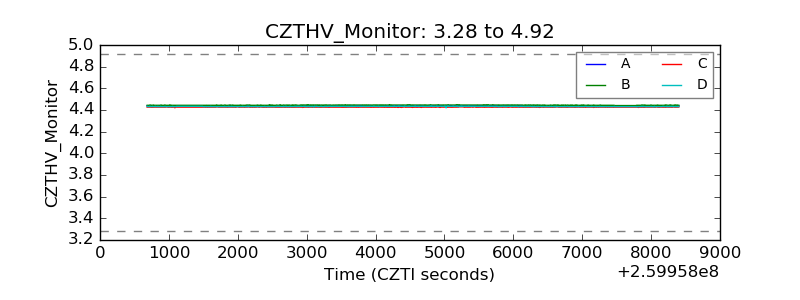 |
| D_VDD | 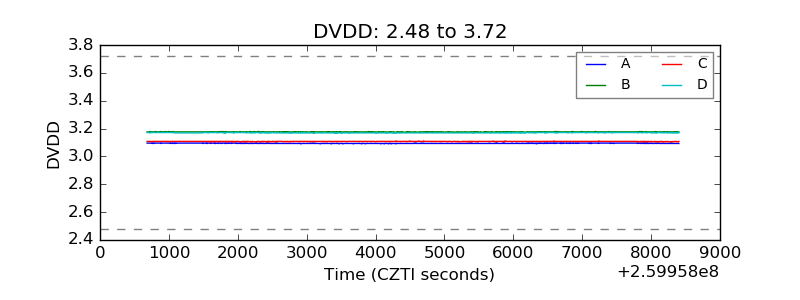 |
| Temperature 1 | 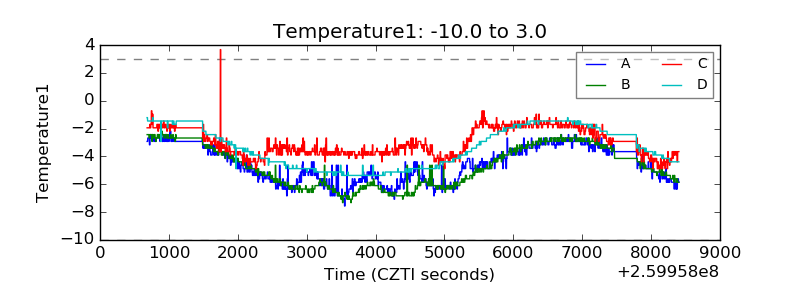 |
| Veto HV Monitor |  |
| Veto LLD | 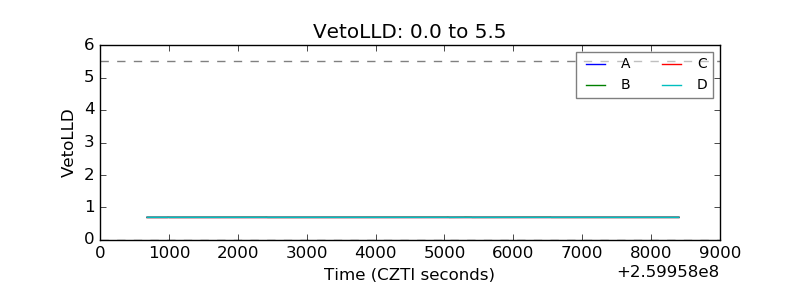 |
| Alpha Counter | 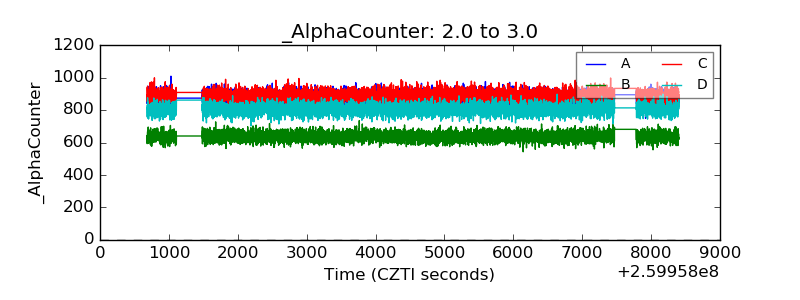 |
| _CPM_Rate |  |
| CZT Counter | 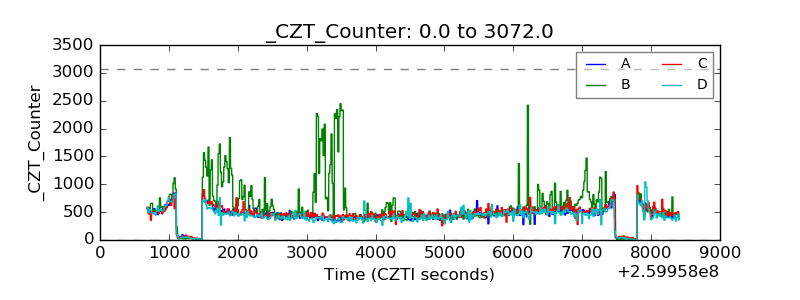 |
| +2.5 Volts monitor |  |
| +5 Volts monitor |  |
| _ROLL_ROT | 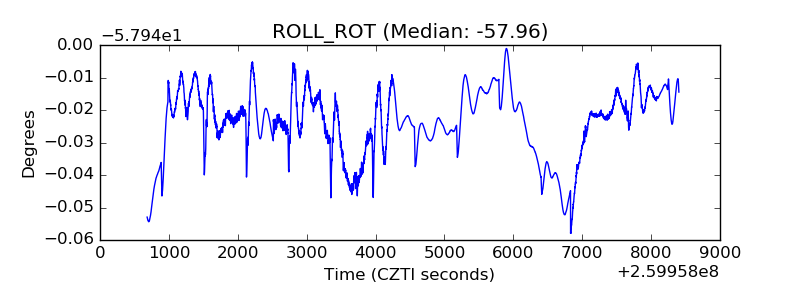 |
| _Roll_DEC |  |
| _Roll_RA | 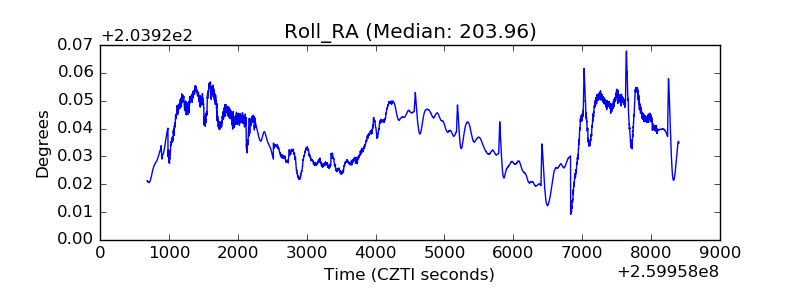 |
| Veto Counter | 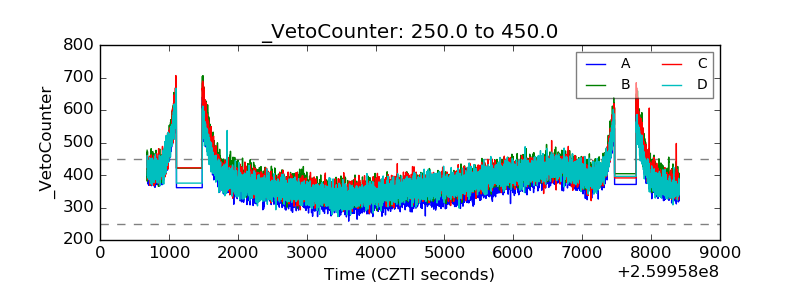 |