| Param | Original file | Final file |
|---|---|---|
| Filename | modeM0/AS1A04_103T01_9000001988_13510cztM0_level2.evt | modeM0/AS1A04_103T01_9000001988_13510cztM0_level2_quad_clean.evt |
| Size (bytes) | 120,476,160 | 14,238,720 |
| Size | 114.9 MB | 13.6 MB |
| Events in quadrant A | 824,829 | 79,328 |
| Events in quadrant B | 1,036,290 | 80,680 |
| Events in quadrant C | 871,721 | 79,514 |
| Events in quadrant D | 807,462 | 76,161 |
| Mode M0 | |||
|---|---|---|---|
| Quadrant | BADHDUFLAG | Total packets | Discarded packets |
| A | 0 | 3372 | 1 |
| B | 0 | 4146 | 1 |
| C | 0 | 3486 | 1 |
| D | 0 | 3380 | 1 |
| Mode SS | |||
|---|---|---|---|
| Quadrant | BADHDUFLAG | Total packets | Discarded packets |
| A | 0 | 34 | 0 |
| B | 0 | 34 | 0 |
| C | 0 | 34 | 0 |
| D | 0 | 34 | 0 |
| Mode M9 | |||
|---|---|---|---|
| Quadrant | BADHDUFLAG | Total packets | Discarded packets |
| A | 0 | 3 | 0 |
| B | 0 | 3 | 0 |
| C | 0 | 3 | 0 |
| D | 0 | 3 | 0 |
| Quadrant | Total seconds | Saturated seconds | Saturation percentage |
|---|---|---|---|
| A | 1549 | 14 | 0.903809% |
| B | 1549 | 50 | 3.227889% |
| C | 1549 | 10 | 0.645578% |
| D | 1549 | 4 | 0.258231% |
Noise dominated data is calculated using 1-second bins in cleaned event files. If a bin has >2000 counts, and if more than 50% of those come from <1% of pixels, then it is considered to be noise-dominated and hence unusable.
| Quadrant | # 1 sec bins | Bins with >0 counts | Bins with >2000 counts | High rate bins dominated by noise | Noise dominated (total time) | Noise dominated (detector-on time) | Marked lightcurve |
|---|---|---|---|---|---|---|---|
| A | 1865 | 1551 | 0 | 0 | 0.00% | 0.00% | 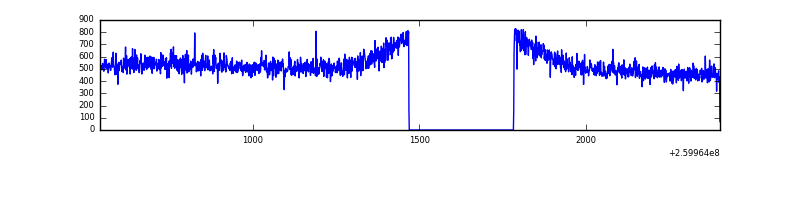 |
| B | 1865 | 1551 | 7 | 7 | 0.38% | 0.45% | 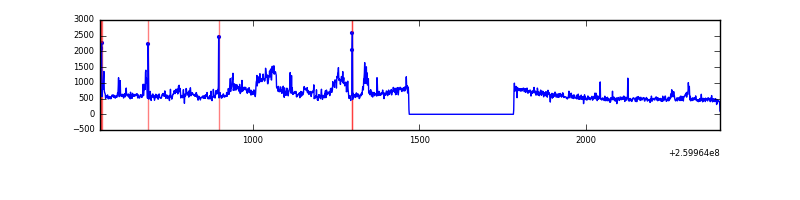 |
| C | 1865 | 1551 | 0 | 0 | 0.00% | 0.00% | 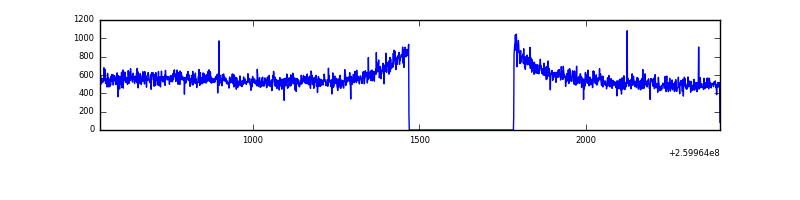 |
| D | 1865 | 1551 | 1 | 1 | 0.05% | 0.06% | 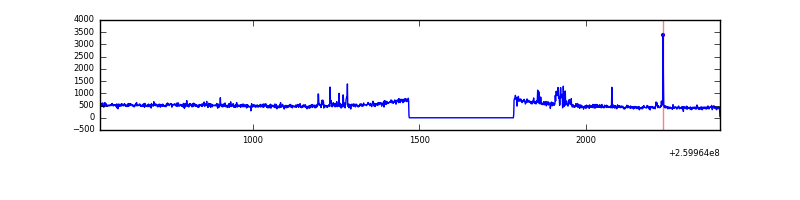 |
Top three noisy pixels from each quadrant. If the there are fewer than three noisy pixels in the level2.evt file, extra rows are filled as -1
| Pixel properties | Quadrant properties | ||||||
|---|---|---|---|---|---|---|---|
| Quadrant | DetID | PixID | Counts | Sigma | Mean | Median | Sigma |
| A | 8 | 15 | 6968 | 147.1 | 212 | 207 | 46.0 |
| A | 0 | 226 | 2023 | 39.51 | 212 | 207 | 46.0 |
| A | 12 | 194 | 1634 | 31.05 | 212 | 207 | 46.0 |
| B | 3 | 64 | 145817 | 3353.71 | 211 | 205 | 43.4 |
| B | 4 | 142 | 48097 | 1103.04 | 211 | 205 | 43.4 |
| B | 3 | 209 | 7386 | 165.39 | 211 | 205 | 43.4 |
| C | 3 | 233 | 70694 | 1418.78 | 203 | 203 | 49.7 |
| C | 10 | 223 | 6797 | 132.72 | 203 | 203 | 49.7 |
| C | 13 | 61 | 1459 | 25.28 | 203 | 203 | 49.7 |
| D | 14 | 35 | 17633 | 342.12 | 202 | 195 | 51.0 |
| D | 8 | 195 | 7417 | 141.69 | 202 | 195 | 51.0 |
| D | 9 | 85 | 7400 | 141.36 | 202 | 195 | 51.0 |
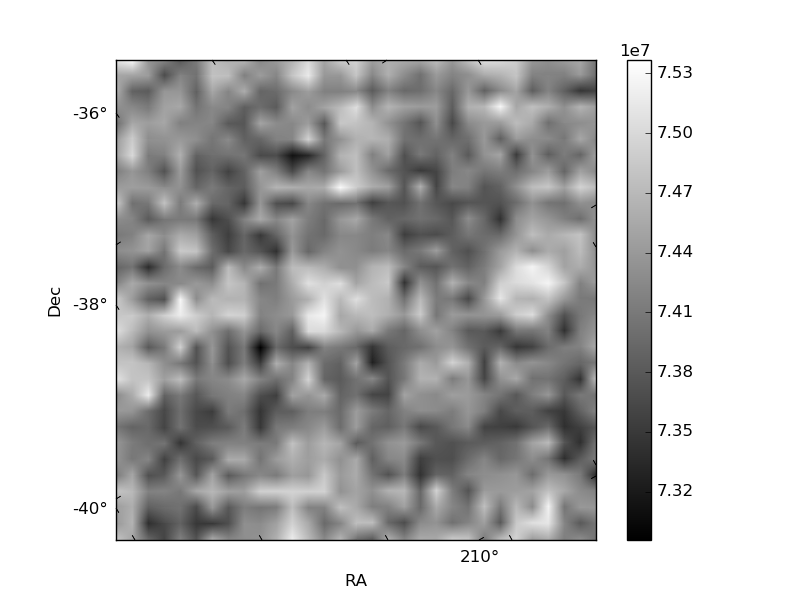
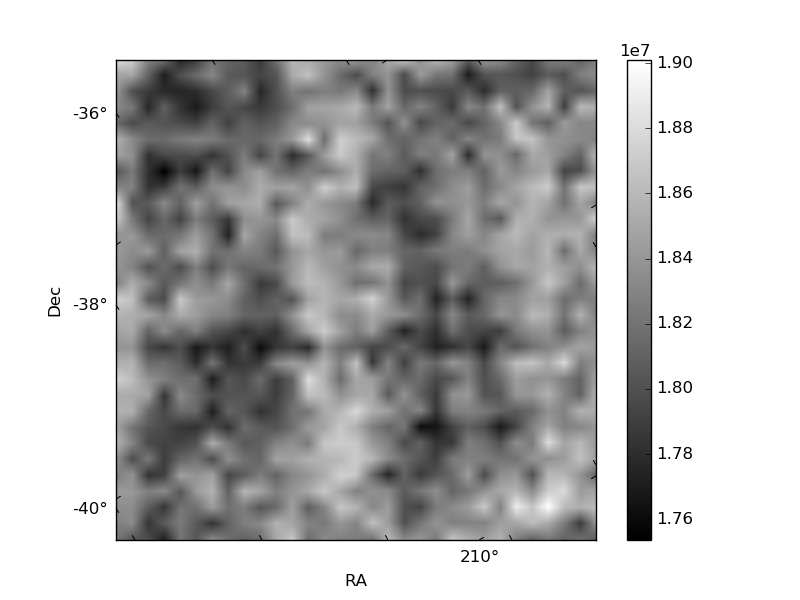
Histogram calculated using DETX and DETY for each event in the final _common_clean file
| Quadrant A |  |
 |
Quadrant B |
|---|---|---|---|
| Quadrant D |  |
 |
Quadrant C |
| Plot type | Count rate plots | Images |
|---|---|---|
| Comparison with Poisson distribution Blue bars denote a histogram of data divided into 1 sec bins. Red curve is a Poisson curve with rate = median count rate of data. |
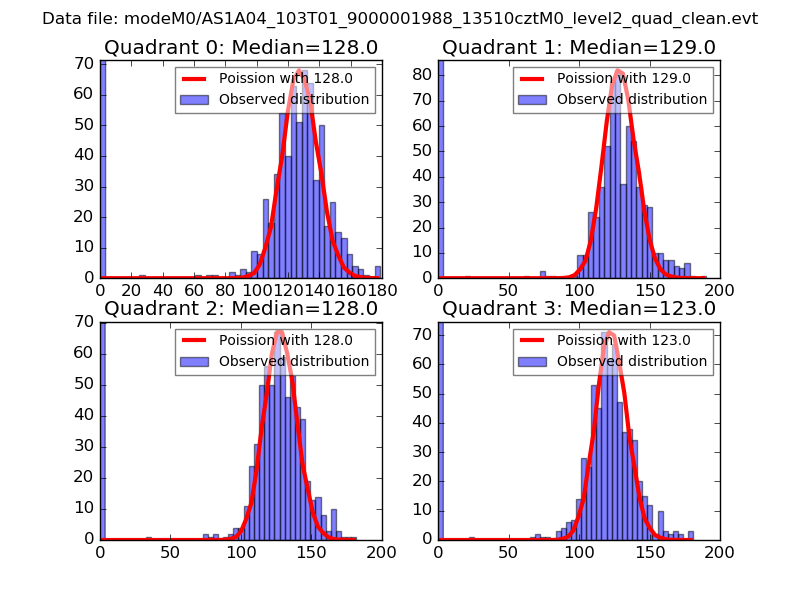 |
 |
| Quadrant-wise count rates Data is divided into 100 sec bins |
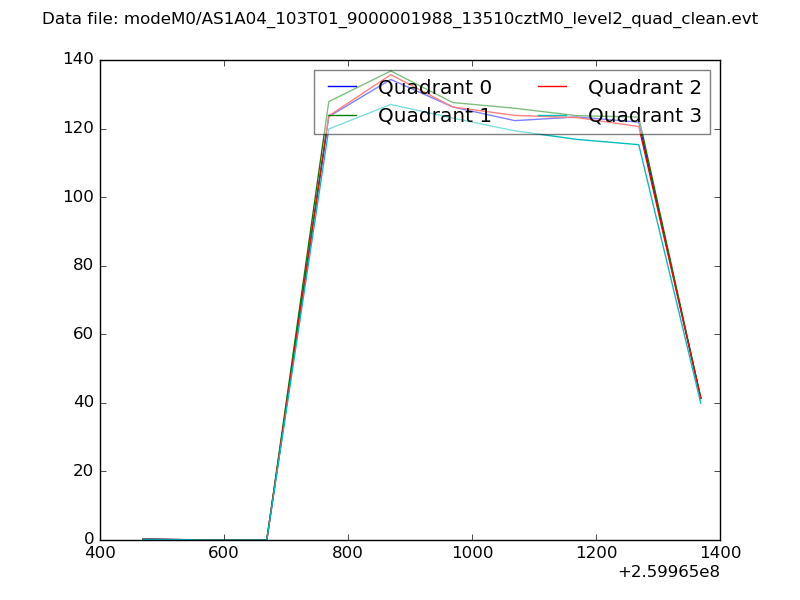 |
|
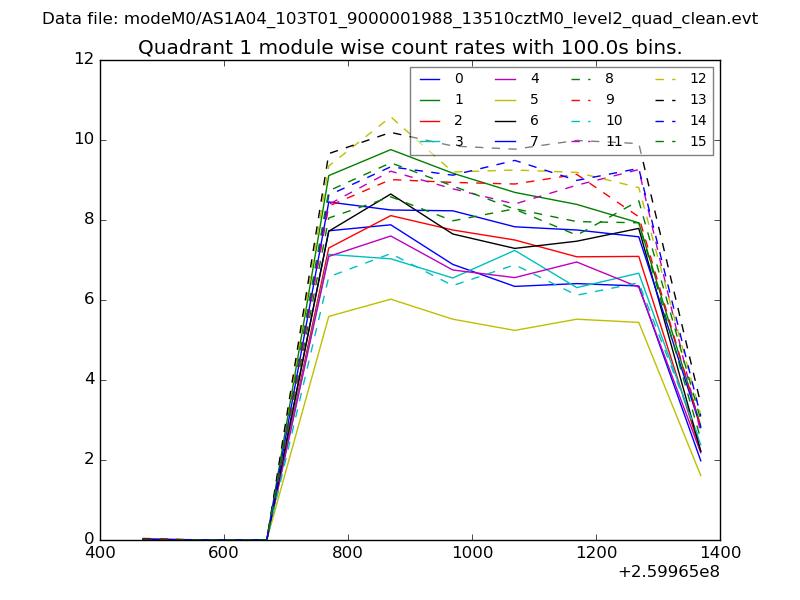
| Module-wise count rates for Quadrant A Data is divided into 100 sec bins |
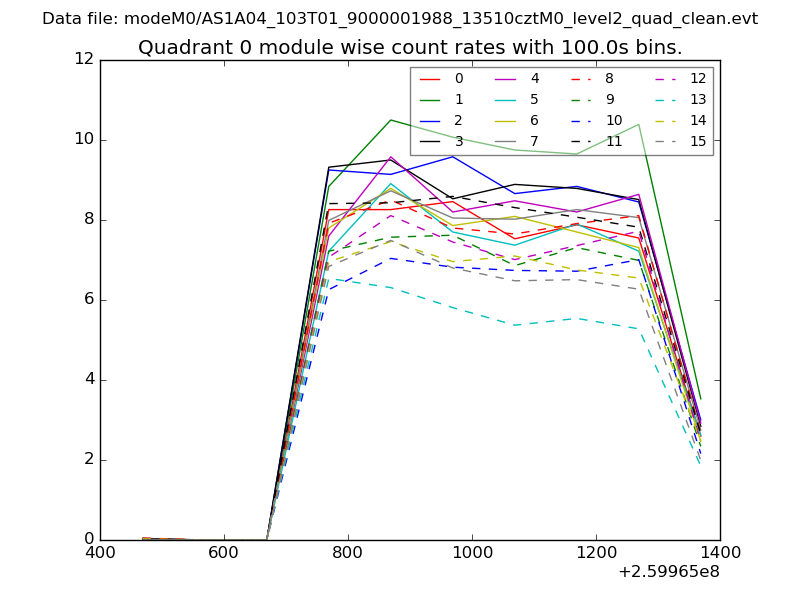 |
 |
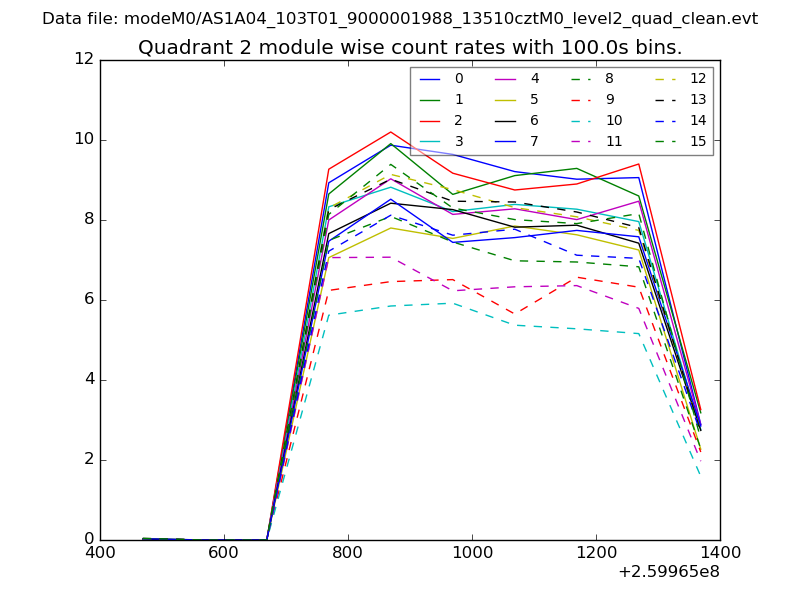
| Module-wise count rates for Quadrant B Data is divided into 100 sec bins |
 |
 |
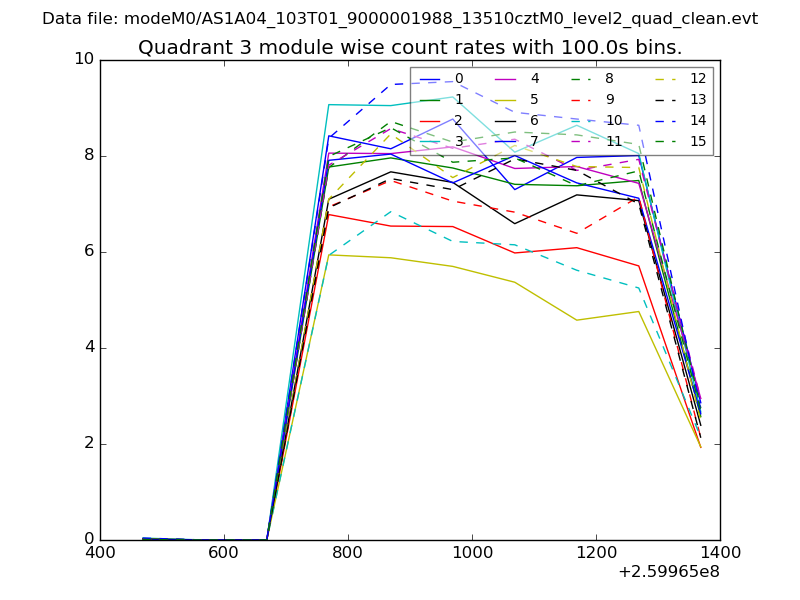
| Module-wise count rates for Quadrant C Data is divided into 100 sec bins |
 |
 |
| Module-wise count rates for Quadrant D Data is divided into 100 sec bins |
 |
 |
| Parameter | Plot |
|---|---|
| CZT HV Monitor | 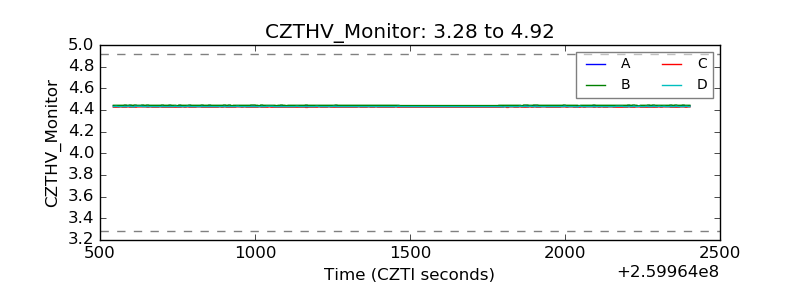 |
| D_VDD | 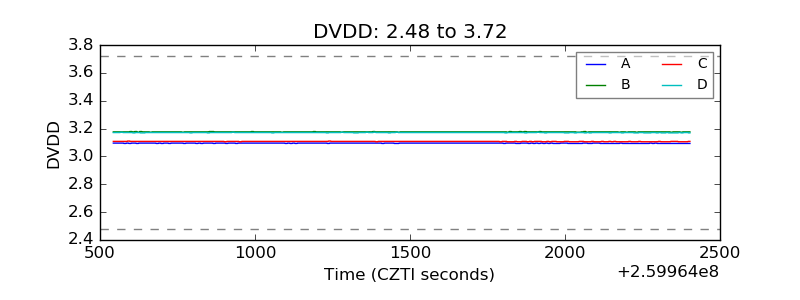 |
| Temperature 1 | 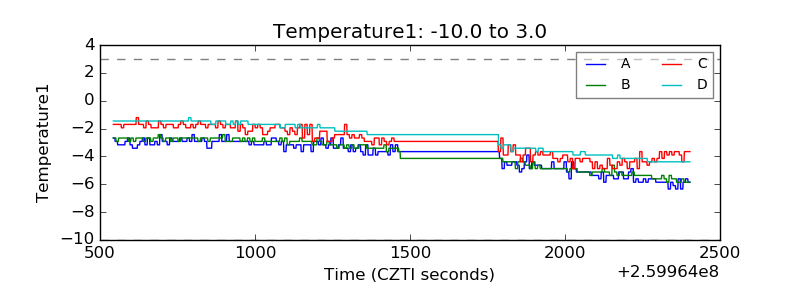 |
| Veto HV Monitor | 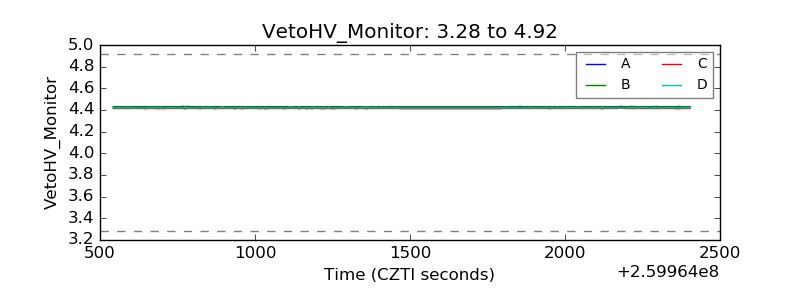 |
| Veto LLD | 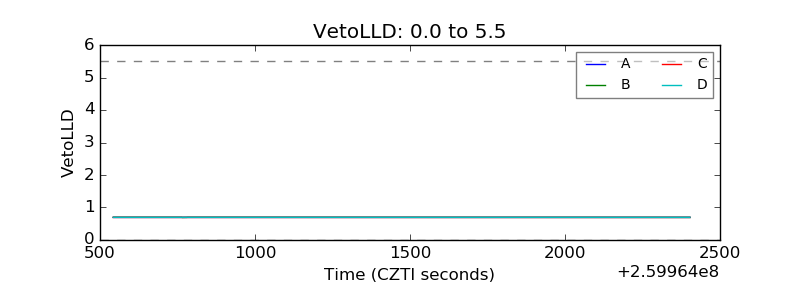 |
| Alpha Counter | 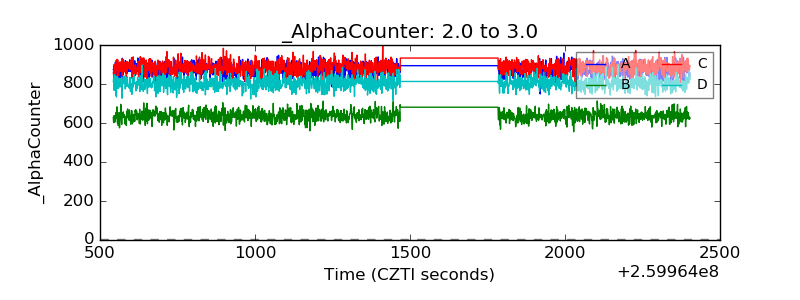 |
| _CPM_Rate | 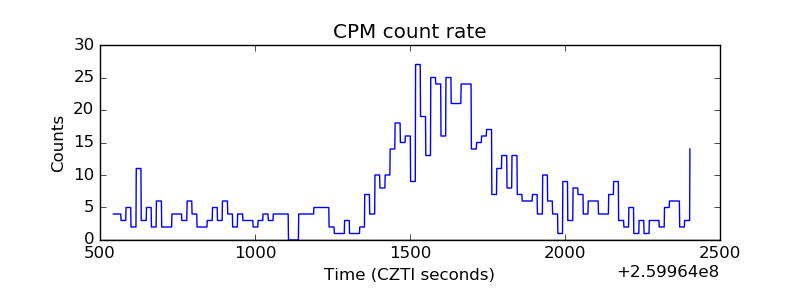 |
| CZT Counter |  |
| +2.5 Volts monitor |  |
| +5 Volts monitor |  |
| _ROLL_ROT | 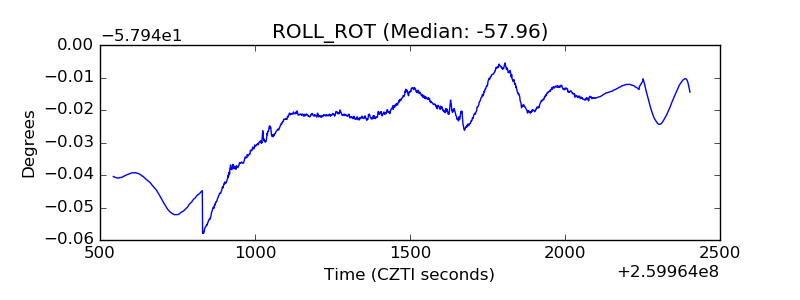 |
| _Roll_DEC | 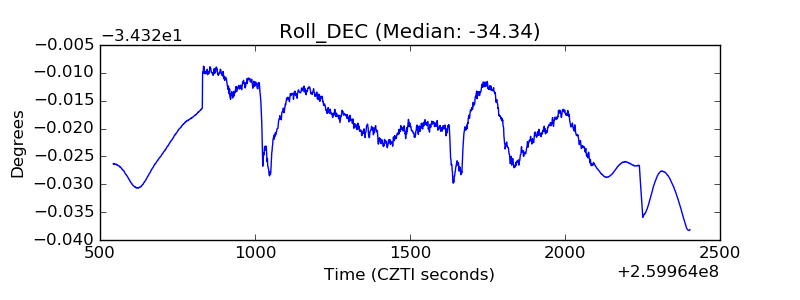 |
| _Roll_RA | 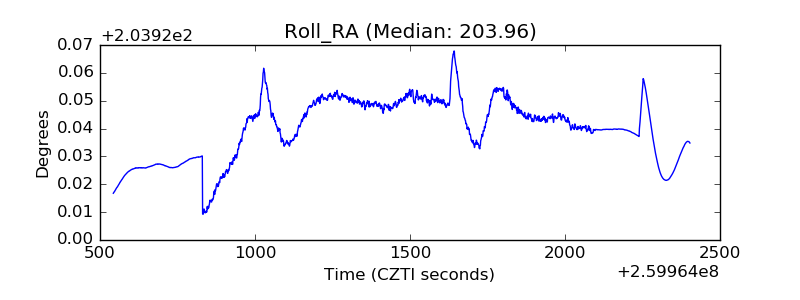 |
| Veto Counter | 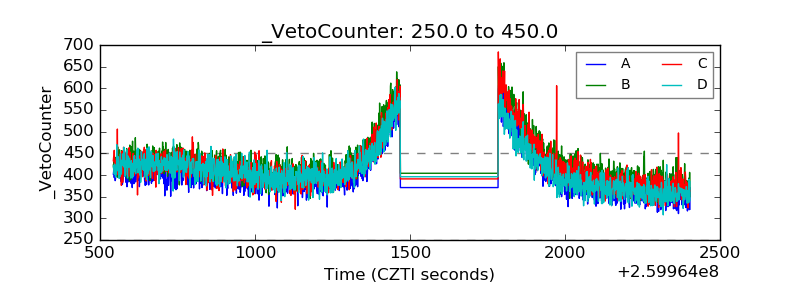 |