| Param | Original file | Final file |
|---|---|---|
| Filename | modeM0/AS1T02_020T01_9000001990cztM0_level2.fits | modeM0/AS1T02_020T01_9000001990cztM0_level2_quad_clean.evt |
| Size (bytes) | 603,616,320 | 533,963,520 |
| Size | 575.7 MB | 509.2 MB |
| Events in quadrant A | 3,726,600 | 3,122,761 |
| Events in quadrant B | 3,558,428 | 3,307,032 |
| Events in quadrant C | 3,624,102 | 2,905,113 |
| Events in quadrant D | 3,153,514 | 2,617,947 |
| Mode M0 | |||
|---|---|---|---|
| Quadrant | BADHDUFLAG | Total packets | Discarded packets |
| A | 0 | 129198 | 0 |
| B | 0 | 149449 | 0 |
| C | 0 | 130911 | 0 |
| D | 0 | 136926 | 0 |
| Mode M9 | |||
|---|---|---|---|
| Quadrant | BADHDUFLAG | Total packets | Discarded packets |
| A | 0 | 106 | 0 |
| B | 0 | 106 | 0 |
| C | 0 | 106 | 0 |
| D | 0 | 106 | 0 |
| Mode SS | |||
|---|---|---|---|
| Quadrant | BADHDUFLAG | Total packets | Discarded packets |
| A | 0 | 1250 | 0 |
| B | 0 | 1250 | 0 |
| C | 0 | 1250 | 0 |
| D | 0 | 1250 | 0 |
| Quadrant | Total seconds | Saturated seconds | Saturation percentage |
|---|---|---|---|
| A | 61502 | 722 | 1.173946% |
| B | 61502 | 1725 | 2.804787% |
| C | 61502 | 533 | 0.866638% |
| D | 61502 | 802 | 1.304023% |
Noise dominated data is calculated using 1-second bins in cleaned event files. If a bin has >2000 counts, and if more than 50% of those come from <1% of pixels, then it is considered to be noise-dominated and hence unusable.
| Quadrant | # 1 sec bins | Bins with >0 counts | Bins with >2000 counts | High rate bins dominated by noise | Noise dominated (total time) | Noise dominated (detector-on time) | Marked lightcurve |
|---|---|---|---|---|---|---|---|
| A | 72003 | 61493 | 0 | 0 | 0.00% | 0.00% |  |
| B | 72003 | 61455 | 0 | 0 | 0.00% | 0.00% | 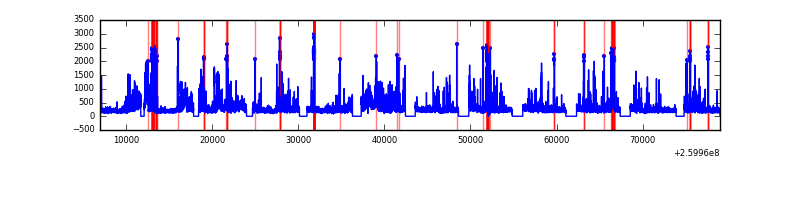 |
| C | 72003 | 61493 | 0 | 0 | 0.00% | 0.00% |  |
| D | 72003 | 61489 | 0 | 0 | 0.00% | 0.00% |  |
Top three noisy pixels from each quadrant. If the there are fewer than three noisy pixels in the level2.evt file, extra rows are filled as -1
| Pixel properties | Quadrant properties | ||||||
|---|---|---|---|---|---|---|---|
| Quadrant | DetID | PixID | Counts | Sigma | Mean | Median | Sigma |
| A | 0 | 29 | 3549 | 10.98 | 969 | 909 | 240.5 |
| A | 7 | 110 | 3129 | 9.23 | 969 | 909 | 240.5 |
| A | 9 | 19 | 2814 | 7.92 | 969 | 909 | 240.5 |
| B | 2 | 9 | 3008 | 11.47 | 939 | 897 | 184.1 |
| B | 3 | 17 | 2447 | 8.42 | 939 | 897 | 184.1 |
| B | 14 | 254 | 2307 | 7.66 | 939 | 897 | 184.1 |
| C | 12 | 241 | 2553 | 6.68 | 957 | 893 | 248.3 |
| C | 3 | 126 | 2415 | 6.13 | 957 | 893 | 248.3 |
| C | 9 | 242 | 2382 | 6.0 | 957 | 893 | 248.3 |
| D | 6 | 231 | 2306 | 6.24 | 898 | 819 | 238.4 |
| D | 3 | 14 | 2298 | 6.2 | 898 | 819 | 238.4 |
| D | 7 | 3 | 2250 | 6.0 | 898 | 819 | 238.4 |
Histogram calculated using DETX and DETY for each event in the final _common_clean file
| Quadrant A | 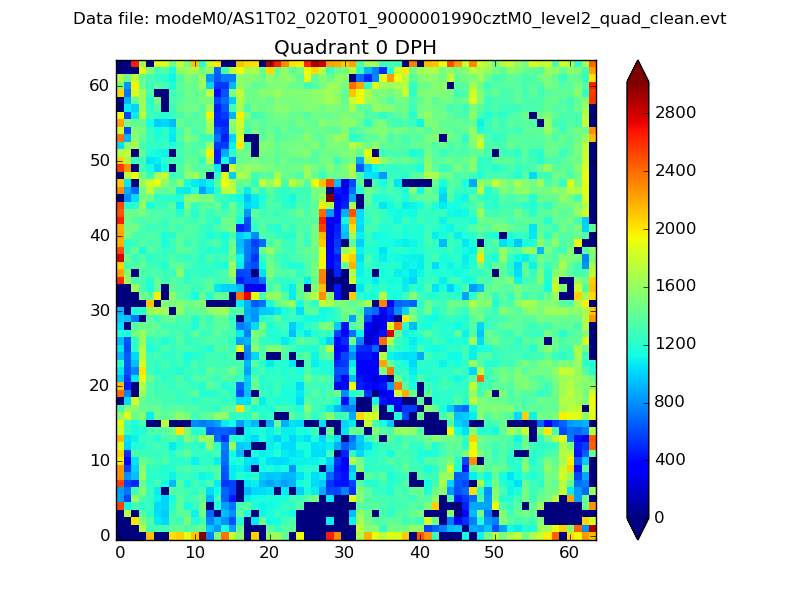 |
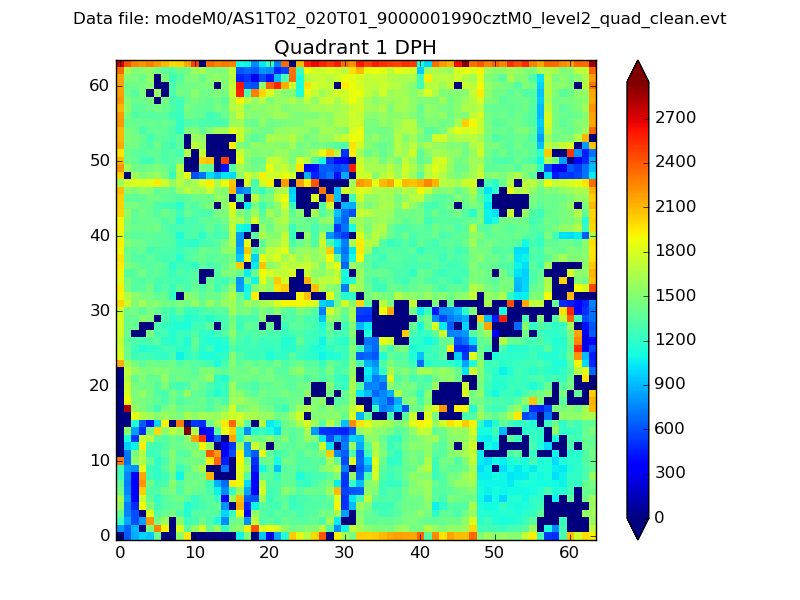 |
Quadrant B |
|---|---|---|---|
| Quadrant D |  |
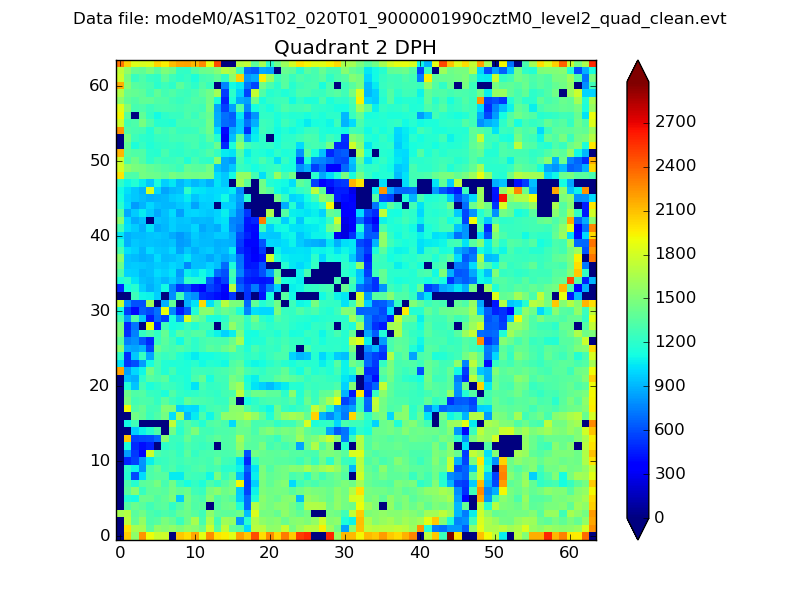 |
Quadrant C |
| Plot type | Count rate plots | Images |
|---|---|---|
| Comparison with Poisson distribution Blue bars denote a histogram of data divided into 1 sec bins. Red curve is a Poisson curve with rate = median count rate of data. |
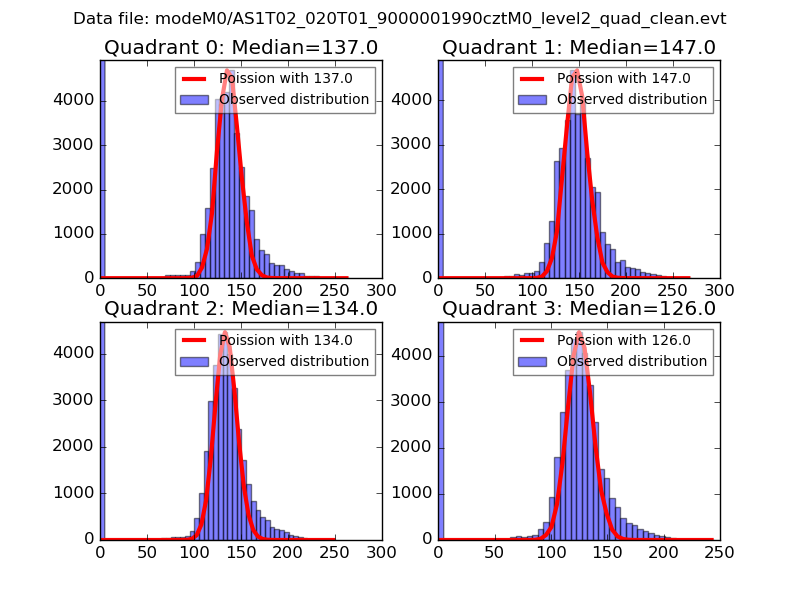 |
 |
| Quadrant-wise count rates Data is divided into 100 sec bins |
 |
|
| Module-wise count rates for Quadrant A Data is divided into 100 sec bins |
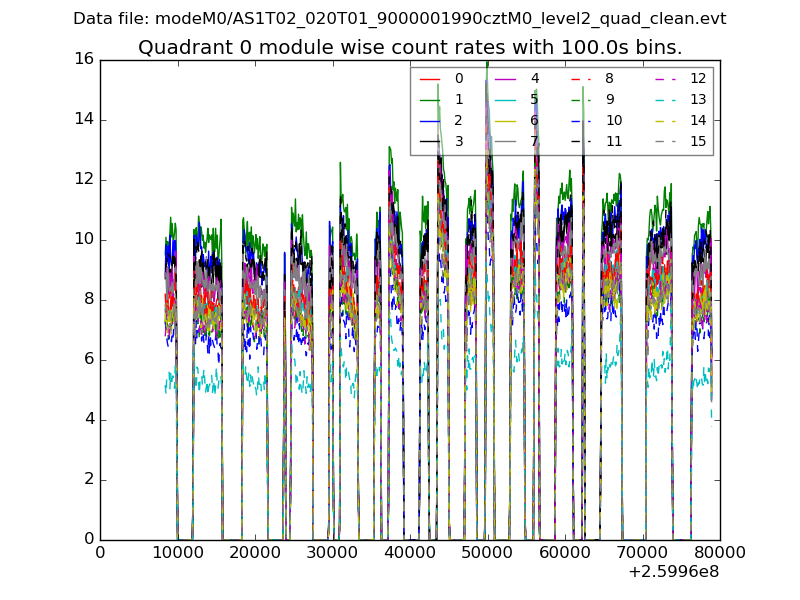 |
 |
| Module-wise count rates for Quadrant B Data is divided into 100 sec bins |
 |
 |
| Module-wise count rates for Quadrant C Data is divided into 100 sec bins |
 |
 |
| Module-wise count rates for Quadrant D Data is divided into 100 sec bins |
 |
 |
| Parameter | Plot |
|---|---|
| CZT HV Monitor |  |
| D_VDD | 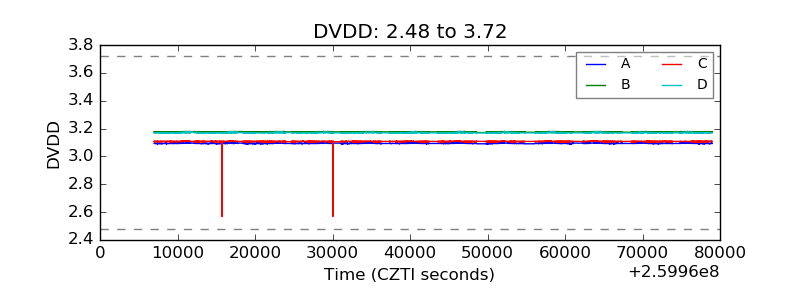 |
| Temperature 1 |  |
| Veto HV Monitor |  |
| Veto LLD |  |
| Alpha Counter |  |
| _CPM_Rate |  |
| CZT Counter |  |
| +2.5 Volts monitor | 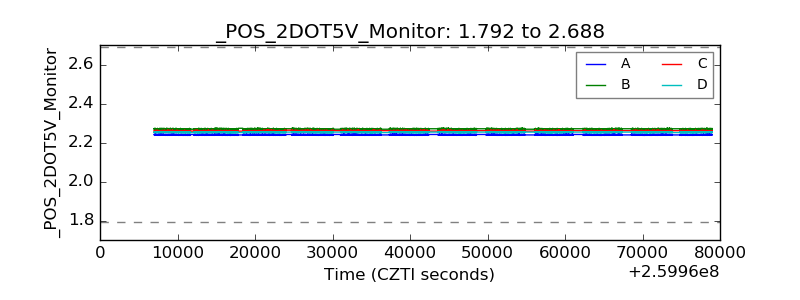 |
| +5 Volts monitor | 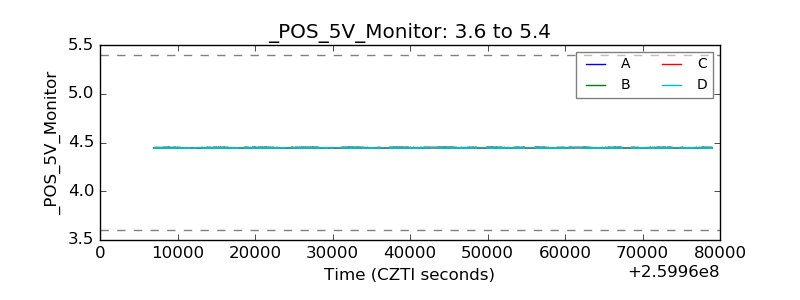 |
| _ROLL_ROT |  |
| _Roll_DEC | 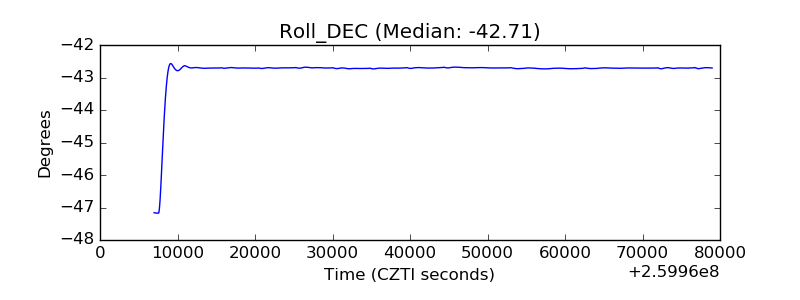 |
| _Roll_RA |  |
| Veto Counter | 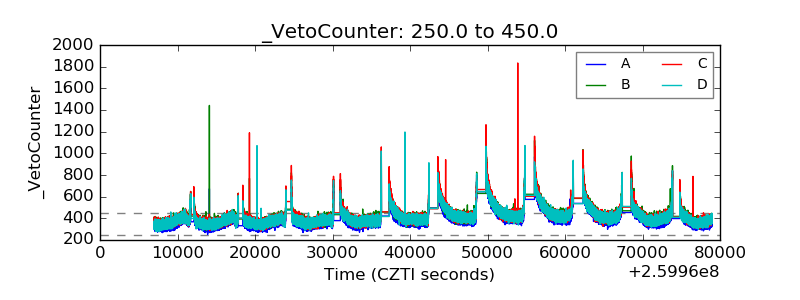 |