| Param | Original file | Final file |
|---|---|---|
| Filename | modeM0/AS1T02_020T01_9000001990_13509cztM0_level2.evt | modeM0/AS1T02_020T01_9000001990_13509cztM0_level2_quad_clean.evt |
| Size (bytes) | 17,562,240 | 2,448,000 |
| Size | 16.7 MB | 2.3 MB |
| Events in quadrant A | 119,459 | 11,372 |
| Events in quadrant B | 154,661 | 12,487 |
| Events in quadrant C | 124,429 | 11,130 |
| Events in quadrant D | 110,610 | 10,723 |
| Mode M0 | |||
|---|---|---|---|
| Quadrant | BADHDUFLAG | Total packets | Discarded packets |
| A | 0 | 555 | 1 |
| B | 0 | 637 | 0 |
| C | 0 | 554 | 0 |
| D | 0 | 554 | 0 |
| Mode SS | |||
|---|---|---|---|
| Quadrant | BADHDUFLAG | Total packets | Discarded packets |
| A | 0 | 6 | 0 |
| B | 0 | 6 | 0 |
| C | 0 | 6 | 0 |
| D | 0 | 6 | 0 |
| Quadrant | Total seconds | Saturated seconds | Saturation percentage |
|---|---|---|---|
| A | 277 | 0 | 0.000000% |
| B | 277 | 1 | 0.361011% |
| C | 277 | 0 | 0.000000% |
| D | 277 | 0 | 0.000000% |
Noise dominated data is calculated using 1-second bins in cleaned event files. If a bin has >2000 counts, and if more than 50% of those come from <1% of pixels, then it is considered to be noise-dominated and hence unusable.
| Quadrant | # 1 sec bins | Bins with >0 counts | Bins with >2000 counts | High rate bins dominated by noise | Noise dominated (total time) | Noise dominated (detector-on time) | Marked lightcurve |
|---|---|---|---|---|---|---|---|
| A | 278 | 278 | 0 | 0 | 0.00% | 0.00% | 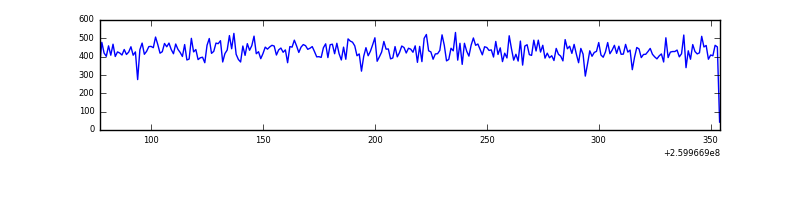 |
| B | 278 | 278 | 1 | 1 | 0.36% | 0.36% | 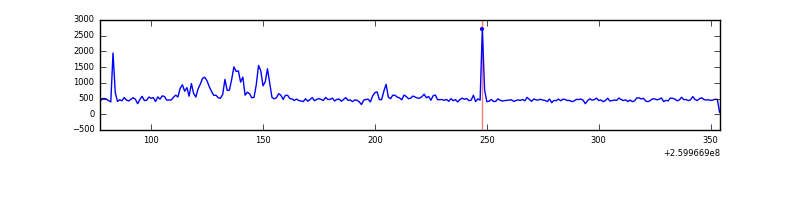 |
| C | 278 | 278 | 0 | 0 | 0.00% | 0.00% | 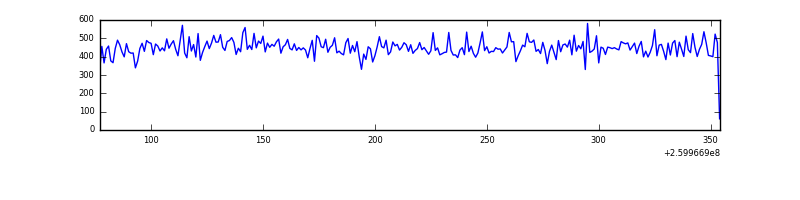 |
| D | 278 | 278 | 0 | 0 | 0.00% | 0.00% | 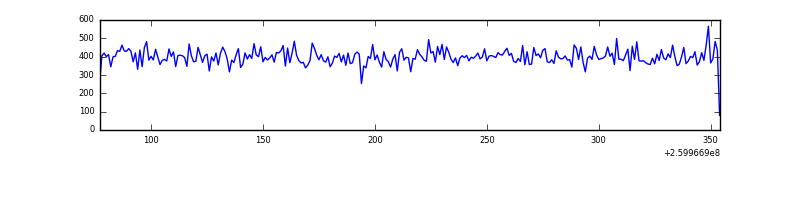 |
Top three noisy pixels from each quadrant. If the there are fewer than three noisy pixels in the level2.evt file, extra rows are filled as -1
| Pixel properties | Quadrant properties | ||||||
|---|---|---|---|---|---|---|---|
| Quadrant | DetID | PixID | Counts | Sigma | Mean | Median | Sigma |
| A | 8 | 15 | 1042 | 117.1 | 30 | 30 | 8.6 |
| A | 1 | 162 | 477 | 51.72 | 30 | 30 | 8.6 |
| A | 0 | 226 | 258 | 26.38 | 30 | 30 | 8.6 |
| B | 3 | 64 | 28866 | 3437.4 | 31 | 31 | 8.4 |
| B | 0 | 214 | 1508 | 176.07 | 31 | 31 | 8.4 |
| B | 12 | 111 | 673 | 76.53 | 31 | 31 | 8.4 |
| C | 3 | 233 | 7258 | 822.49 | 29 | 29 | 8.8 |
| C | 10 | 223 | 272 | 27.65 | 29 | 29 | 8.8 |
| C | 13 | 61 | 210 | 20.59 | 29 | 29 | 8.8 |
| D | 2 | 234 | 807 | 85.46 | 29 | 28 | 9.1 |
| D | 8 | 195 | 375 | 38.07 | 29 | 28 | 9.1 |
| D | 13 | 243 | 337 | 33.9 | 29 | 28 | 9.1 |
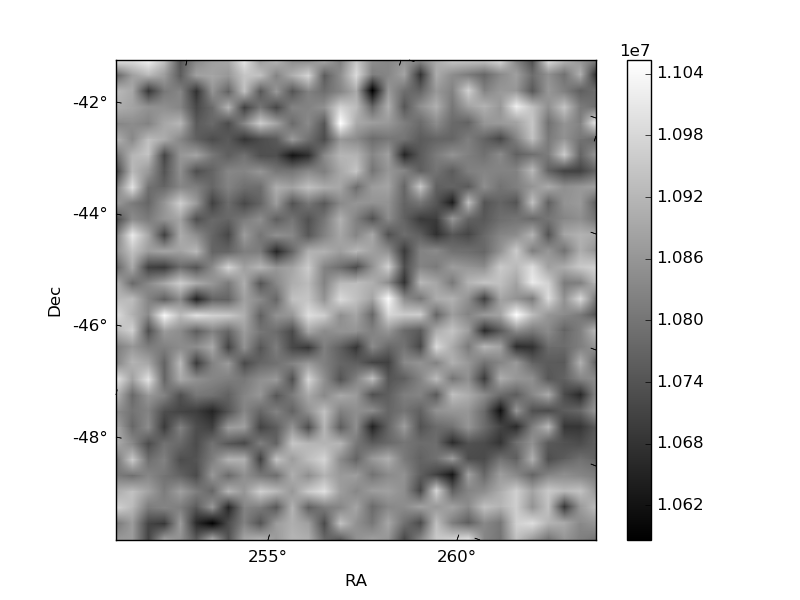
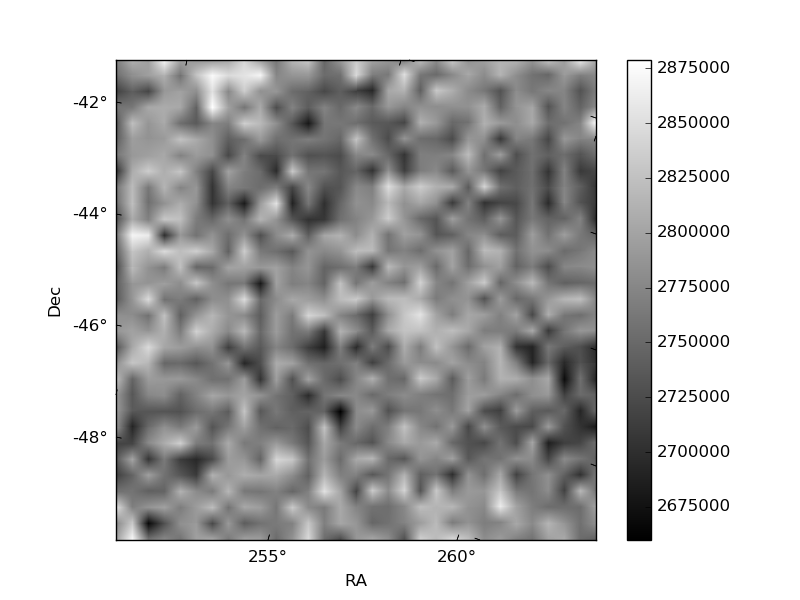
Histogram calculated using DETX and DETY for each event in the final _common_clean file
| Quadrant A | 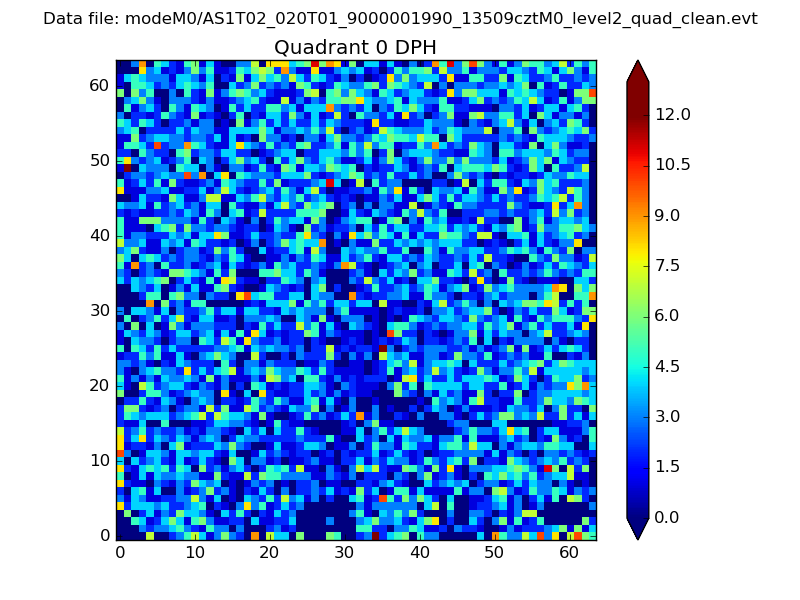 |
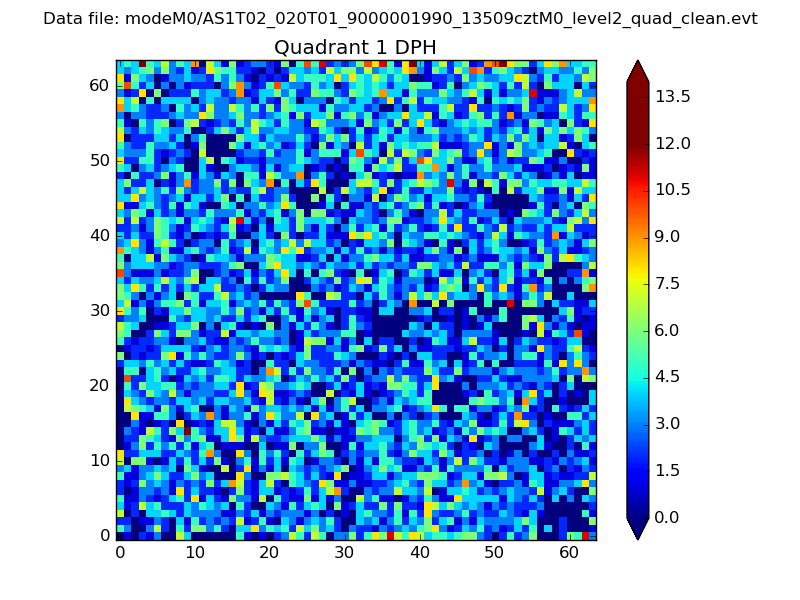 |
Quadrant B |
|---|---|---|---|
| Quadrant D | 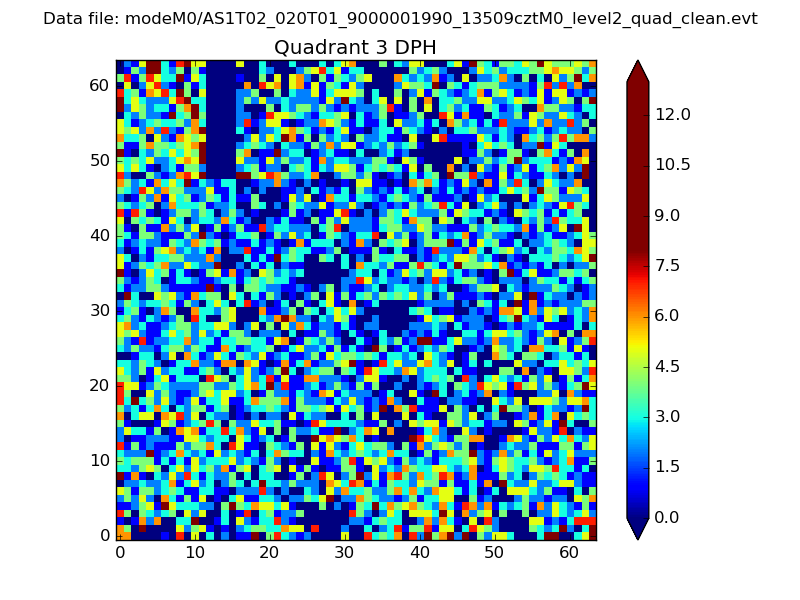 |
 |
Quadrant C |
| Plot type | Count rate plots | Images |
|---|---|---|
| Comparison with Poisson distribution Blue bars denote a histogram of data divided into 1 sec bins. Red curve is a Poisson curve with rate = median count rate of data. |
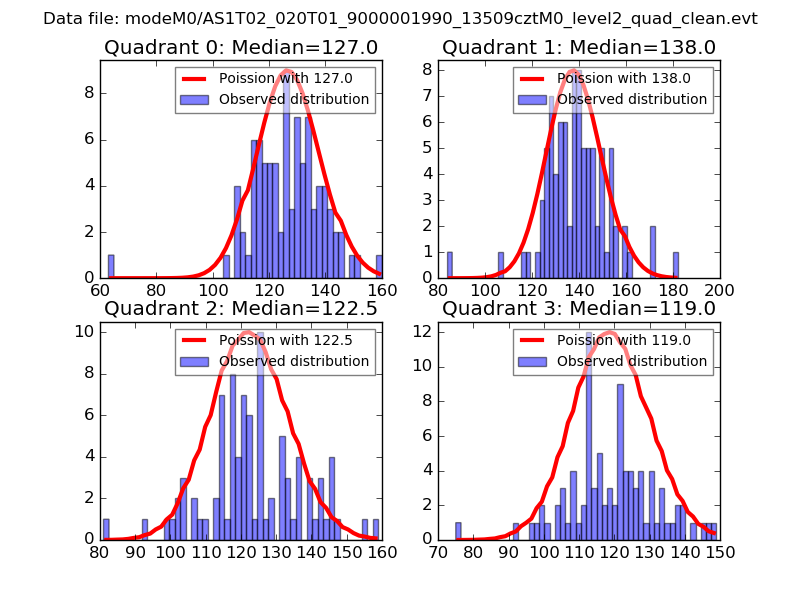 |
 |
| Quadrant-wise count rates Data is divided into 100 sec bins |
 |
|
| Module-wise count rates for Quadrant A Data is divided into 100 sec bins |
 |
 |
| Module-wise count rates for Quadrant B Data is divided into 100 sec bins |
 |
 |
| Module-wise count rates for Quadrant C Data is divided into 100 sec bins |
 |
 |
| Module-wise count rates for Quadrant D Data is divided into 100 sec bins |
 |
 |
| Parameter | Plot |
|---|---|
| CZT HV Monitor | 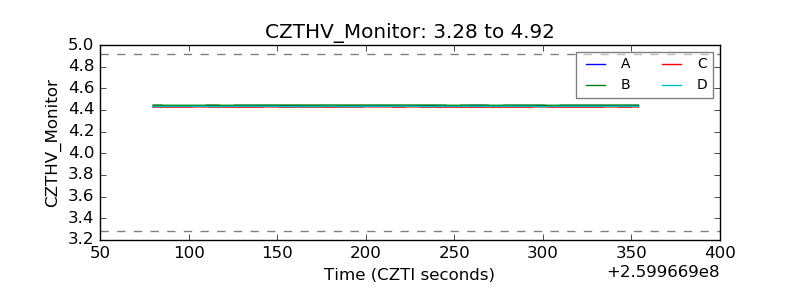 |
| D_VDD | 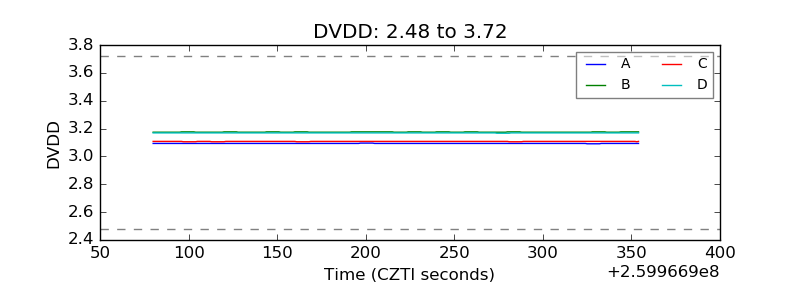 |
| Temperature 1 | 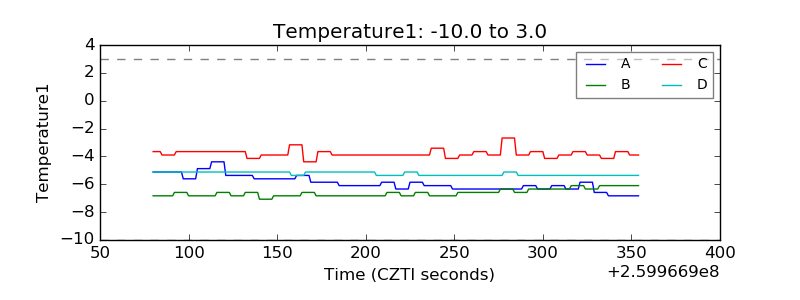 |
| Veto HV Monitor | 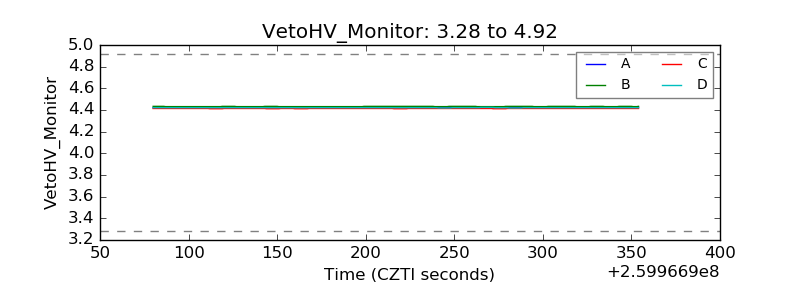 |
| Veto LLD | 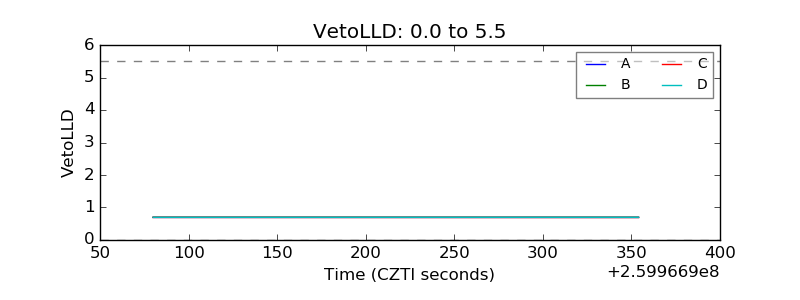 |
| Alpha Counter | 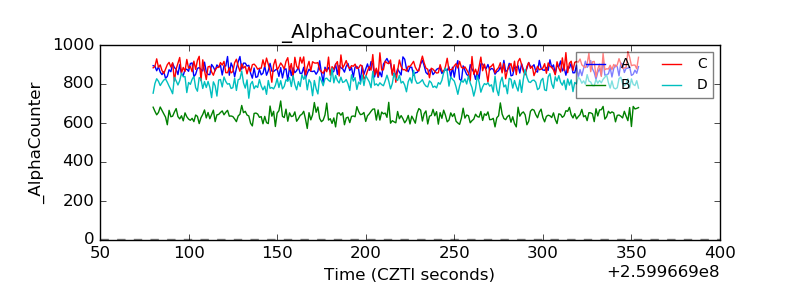 |
| _CPM_Rate | 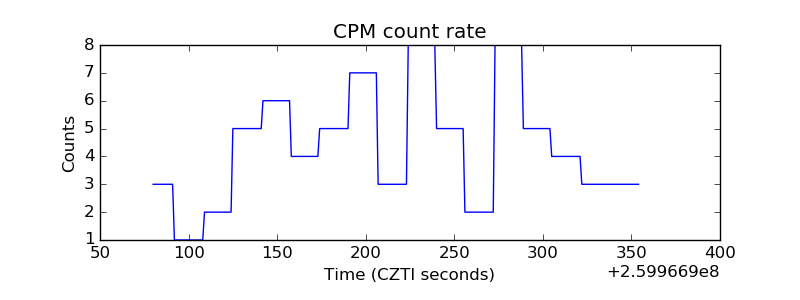 |
| CZT Counter |  |
| +2.5 Volts monitor |  |
| +5 Volts monitor | 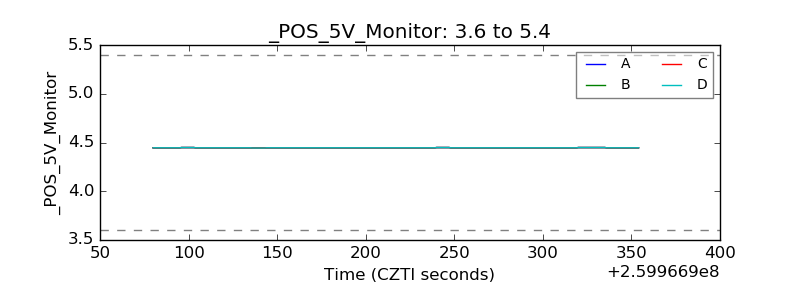 |
| _ROLL_ROT | 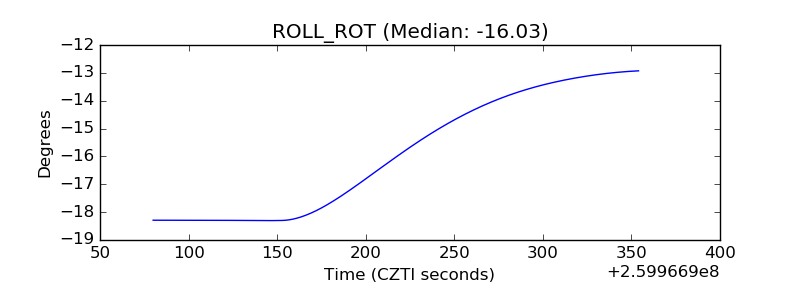 |
| _Roll_DEC | 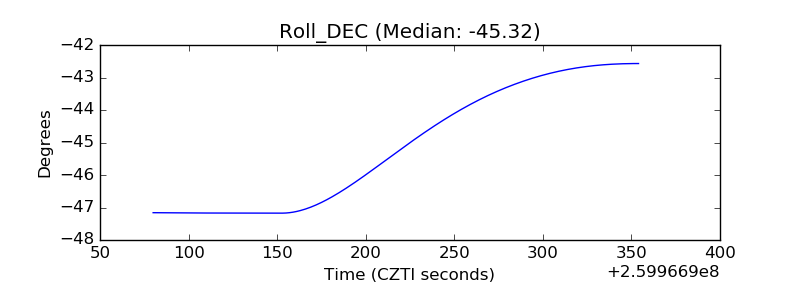 |
| _Roll_RA |  |
| Veto Counter | 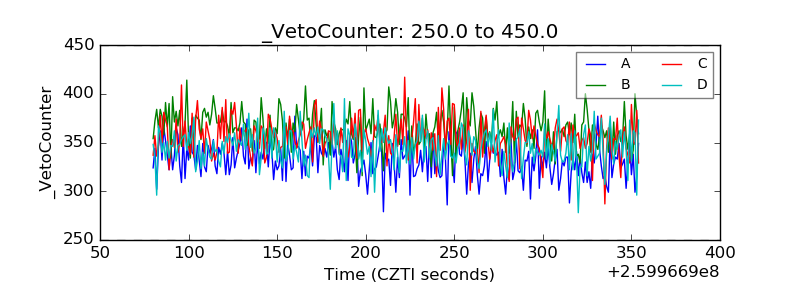 |