| Param | Original file | Final file |
|---|---|---|
| Filename | modeM0/AS1T02_020T01_9000001990_13516cztM0_level2.evt | modeM0/AS1T02_020T01_9000001990_13516cztM0_level2_quad_clean.evt |
| Size (bytes) | 1,004,391,360 | 198,789,120 |
| Size | 957.9 MB | 189.6 MB |
| Events in quadrant A | 6,799,392 | 1,266,738 |
| Events in quadrant B | 9,052,153 | 1,365,691 |
| Events in quadrant C | 6,689,329 | 1,247,917 |
| Events in quadrant D | 6,923,874 | 1,167,349 |
| Mode M0 | |||
|---|---|---|---|
| Quadrant | BADHDUFLAG | Total packets | Discarded packets |
| A | 0 | 29757 | 4 |
| B | 0 | 36306 | 3 |
| C | 0 | 28816 | 3 |
| D | 0 | 30166 | 3 |
| Mode M9 | |||
|---|---|---|---|
| Quadrant | BADHDUFLAG | Total packets | Discarded packets |
| A | 0 | 15 | 0 |
| B | 0 | 15 | 0 |
| C | 0 | 15 | 0 |
| D | 0 | 16 | 0 |
| Mode SS | |||
|---|---|---|---|
| Quadrant | BADHDUFLAG | Total packets | Discarded packets |
| A | 0 | 284 | 0 |
| B | 0 | 284 | 0 |
| C | 0 | 284 | 0 |
| D | 0 | 284 | 0 |
| Quadrant | Total seconds | Saturated seconds | Saturation percentage |
|---|---|---|---|
| A | 14103 | 79 | 0.560165% |
| B | 14103 | 369 | 2.616465% |
| C | 14103 | 47 | 0.333262% |
| D | 14103 | 41 | 0.290718% |
Noise dominated data is calculated using 1-second bins in cleaned event files. If a bin has >2000 counts, and if more than 50% of those come from <1% of pixels, then it is considered to be noise-dominated and hence unusable.
| Quadrant | # 1 sec bins | Bins with >0 counts | Bins with >2000 counts | High rate bins dominated by noise | Noise dominated (total time) | Noise dominated (detector-on time) | Marked lightcurve |
|---|---|---|---|---|---|---|---|
| A | 15384 | 14106 | 6 | 6 | 0.04% | 0.04% | 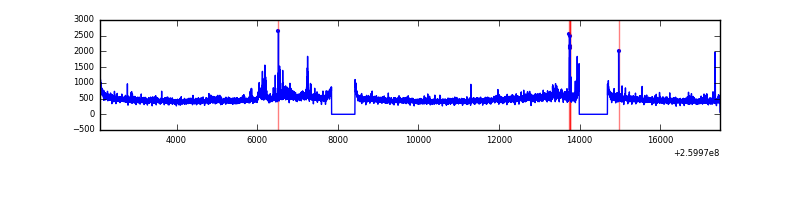 |
| B | 15384 | 14106 | 142 | 142 | 0.92% | 1.01% | 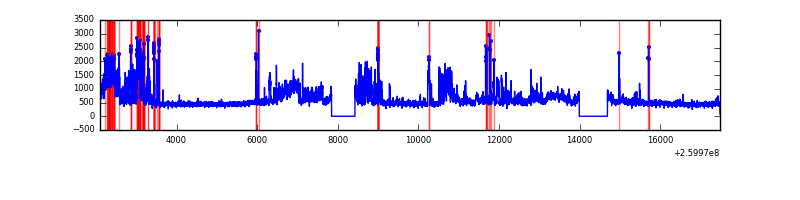 |
| C | 15384 | 14105 | 6 | 6 | 0.04% | 0.04% | 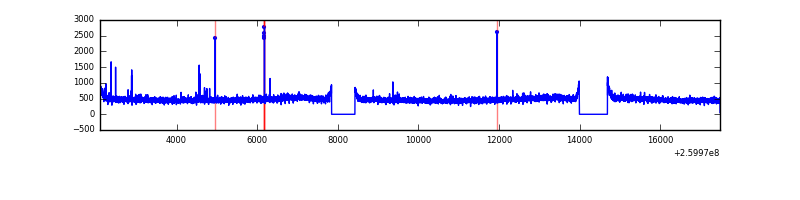 |
| D | 15384 | 14105 | 5 | 5 | 0.03% | 0.04% | 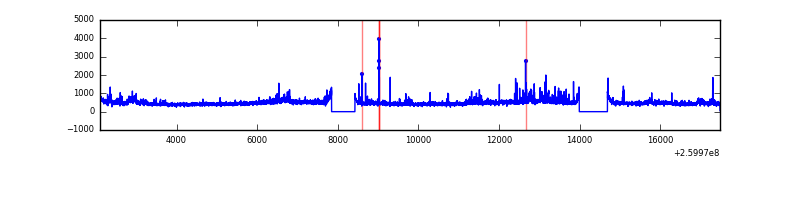 |
Top three noisy pixels from each quadrant. If the there are fewer than three noisy pixels in the level2.evt file, extra rows are filled as -1
| Pixel properties | Quadrant properties | ||||||
|---|---|---|---|---|---|---|---|
| Quadrant | DetID | PixID | Counts | Sigma | Mean | Median | Sigma |
| A | 14 | 238 | 261894 | 769.79 | 1664 | 1628 | 338.1 |
| A | 8 | 15 | 91569 | 266.02 | 1664 | 1628 | 338.1 |
| A | 1 | 162 | 27227 | 75.71 | 1664 | 1628 | 338.1 |
| B | 3 | 64 | 2241307 | 6908.74 | 1693 | 1651 | 324.2 |
| B | 4 | 173 | 53215 | 159.06 | 1693 | 1651 | 324.2 |
| B | 10 | 244 | 42051 | 124.62 | 1693 | 1651 | 324.2 |
| C | 3 | 233 | 285487 | 754.85 | 1627 | 1634 | 376.0 |
| C | 0 | 207 | 47689 | 122.47 | 1627 | 1634 | 376.0 |
| C | 14 | 234 | 15155 | 35.96 | 1627 | 1634 | 376.0 |
| D | 8 | 195 | 659389 | 1691.31 | 1606 | 1557 | 388.9 |
| D | 2 | 234 | 54496 | 136.11 | 1606 | 1557 | 388.9 |
| D | 2 | 225 | 50514 | 125.87 | 1606 | 1557 | 388.9 |
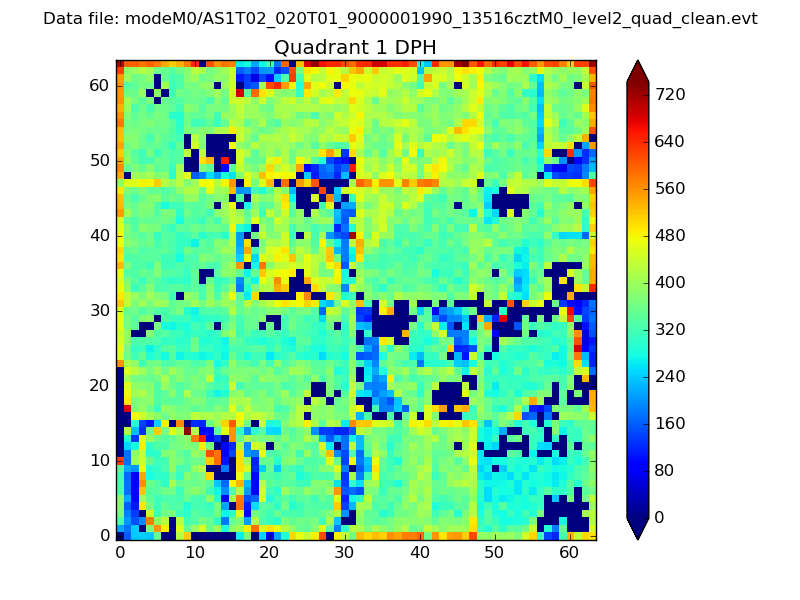
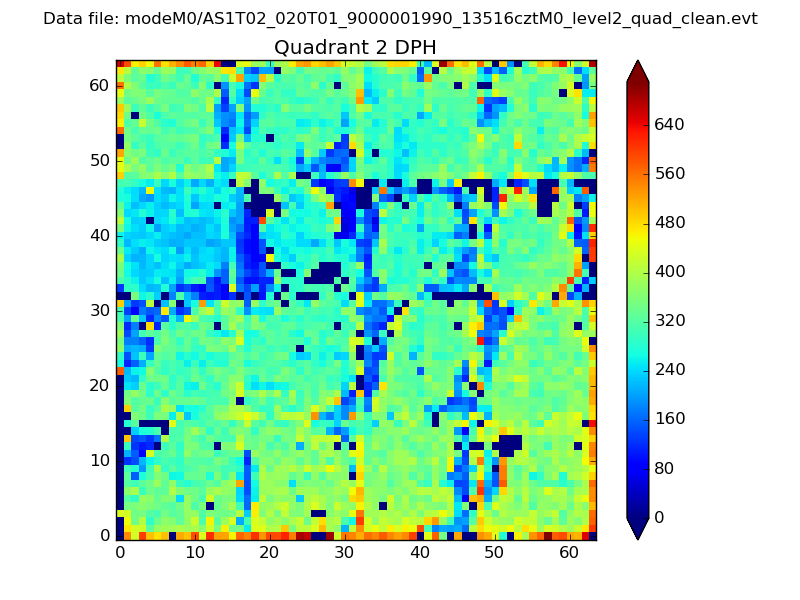
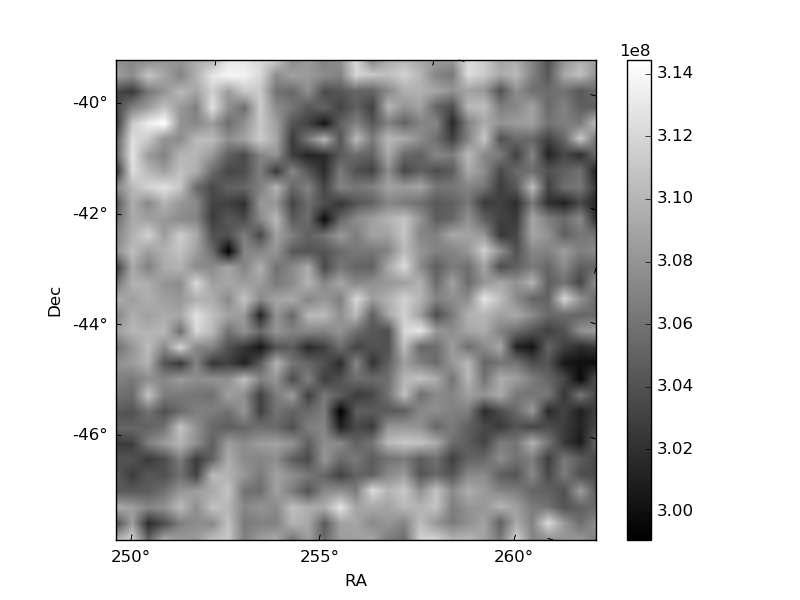
Histogram calculated using DETX and DETY for each event in the final _common_clean file
| Quadrant A |  |
 |
Quadrant B |
|---|---|---|---|
| Quadrant D |  |
 |
Quadrant C |
| Plot type | Count rate plots | Images |
|---|---|---|
| Comparison with Poisson distribution Blue bars denote a histogram of data divided into 1 sec bins. Red curve is a Poisson curve with rate = median count rate of data. |
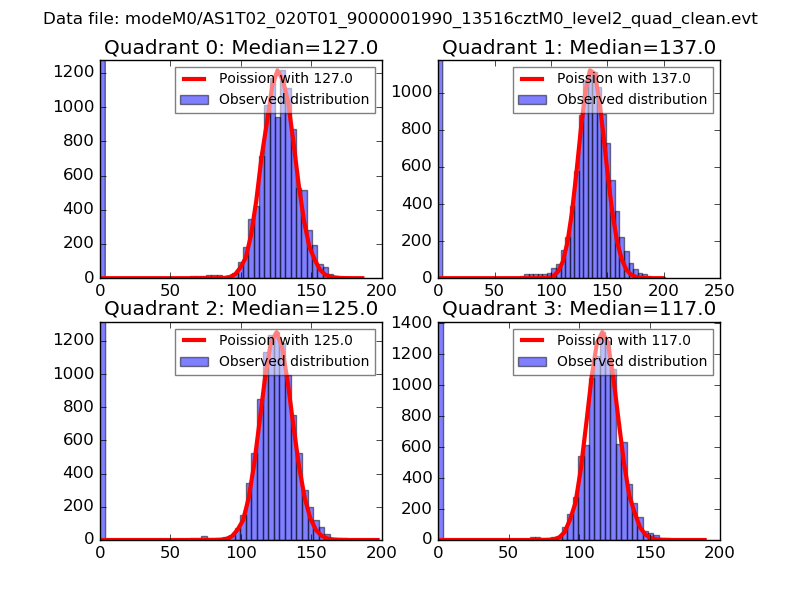 |
 |
| Quadrant-wise count rates Data is divided into 100 sec bins |
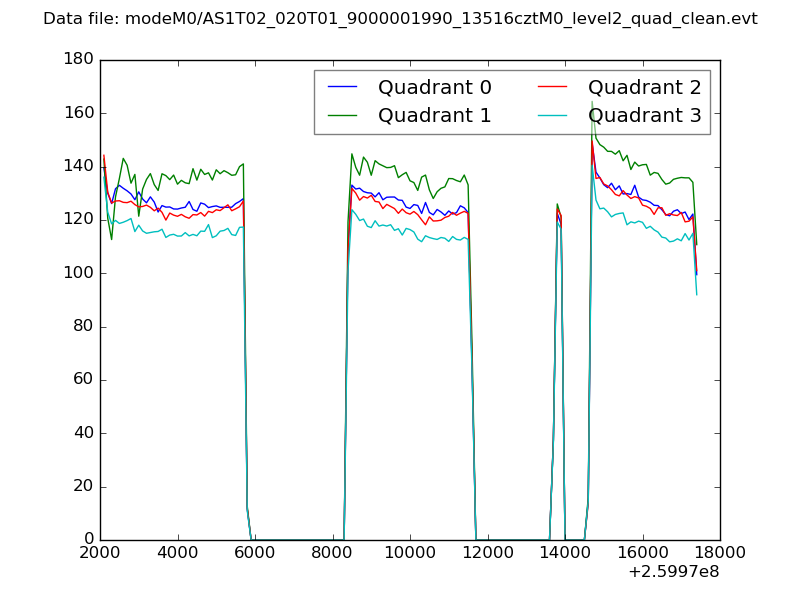 |
|
| Module-wise count rates for Quadrant A Data is divided into 100 sec bins |
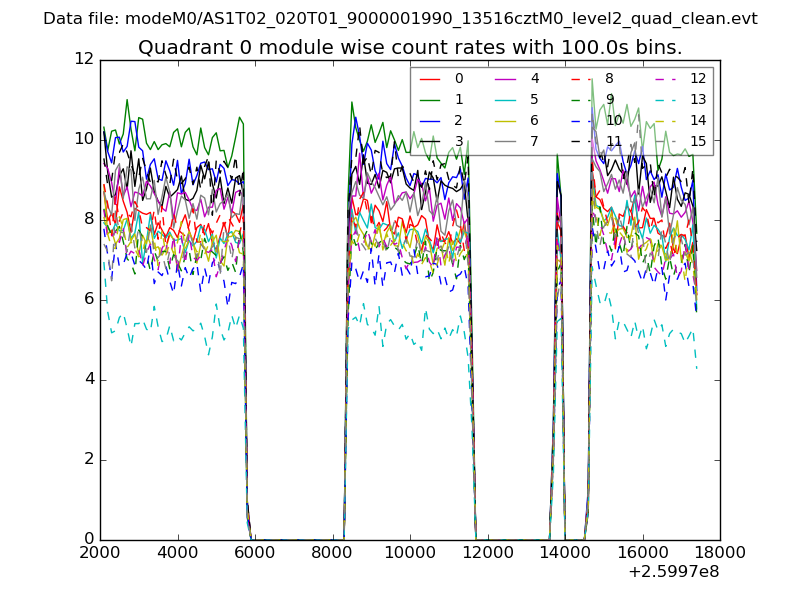 |
 |
| Module-wise count rates for Quadrant B Data is divided into 100 sec bins |
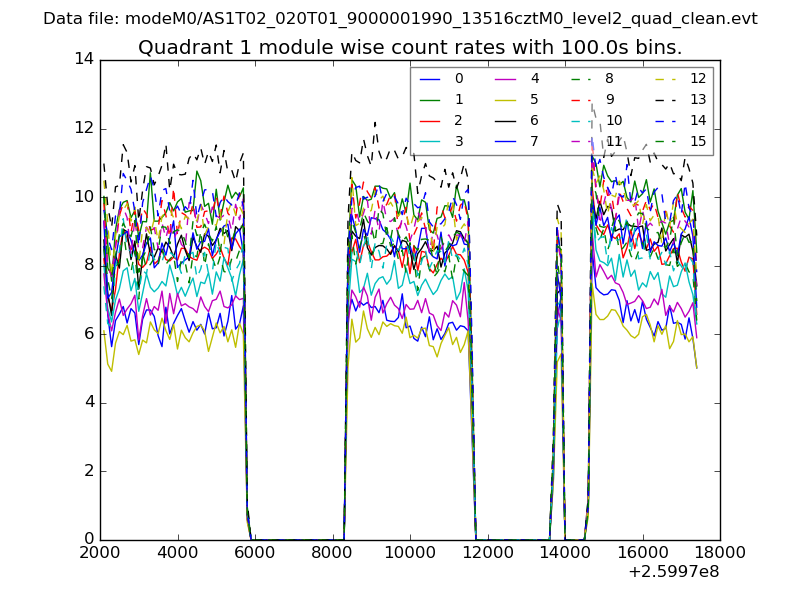 |
 |
| Module-wise count rates for Quadrant C Data is divided into 100 sec bins |
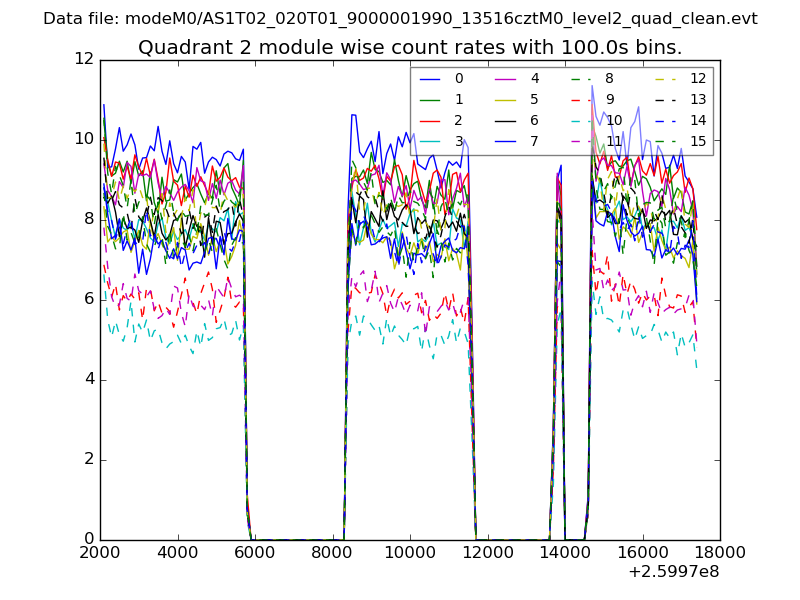 |
 |
| Module-wise count rates for Quadrant D Data is divided into 100 sec bins |
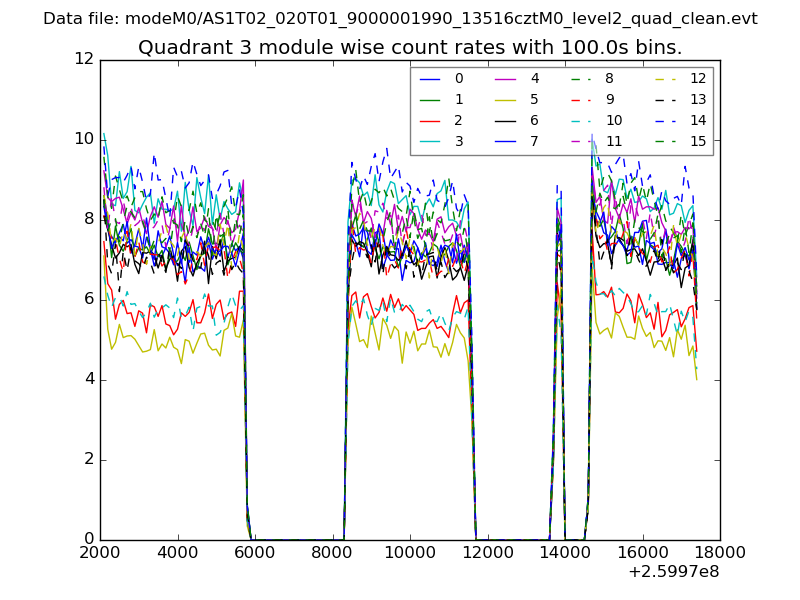 |
 |
| Parameter | Plot |
|---|---|
| CZT HV Monitor | 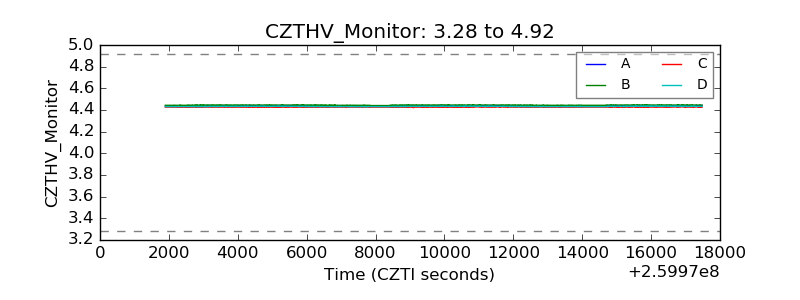 |
| D_VDD | 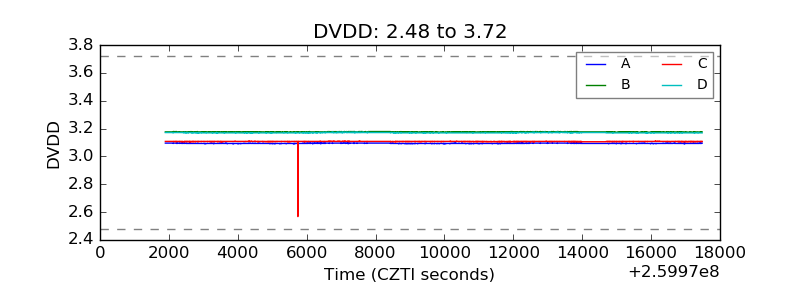 |
| Temperature 1 | 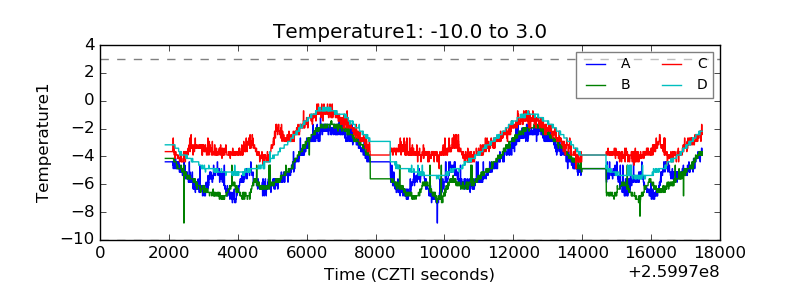 |
| Veto HV Monitor | 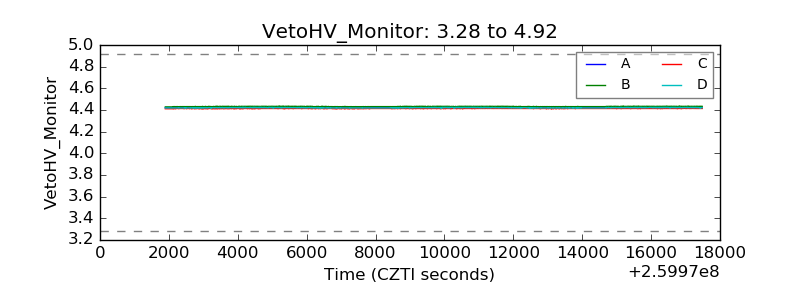 |
| Veto LLD | 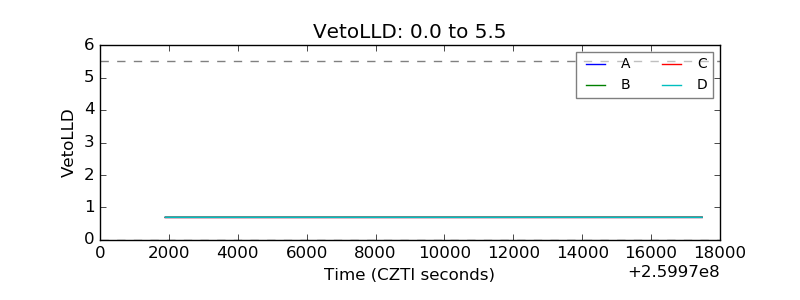 |
| Alpha Counter | 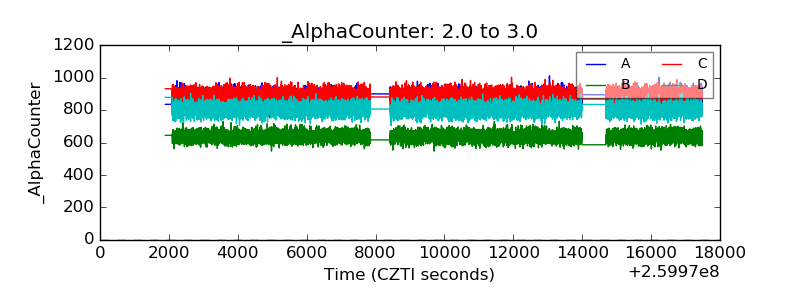 |
| _CPM_Rate | 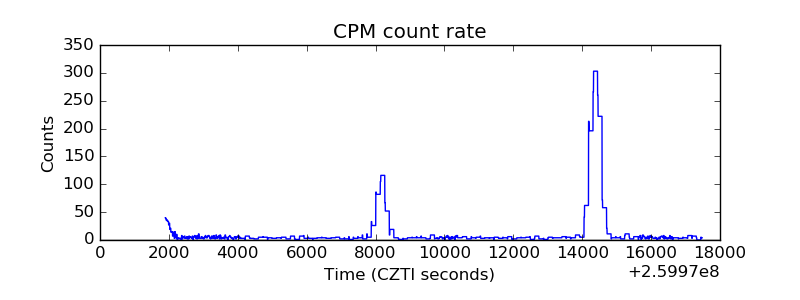 |
| CZT Counter | 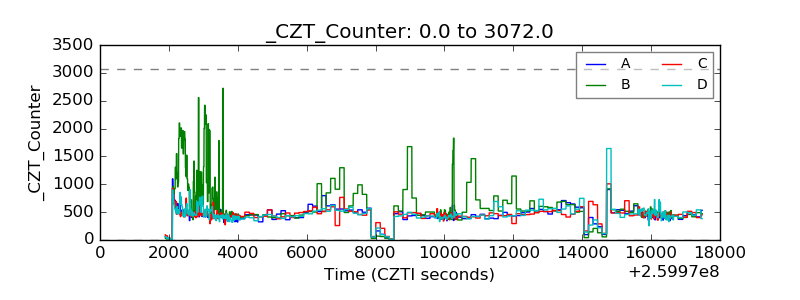 |
| +2.5 Volts monitor |  |
| +5 Volts monitor |  |
| _ROLL_ROT | 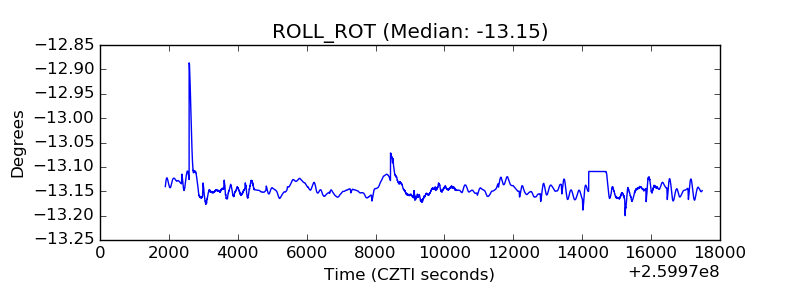 |
| _Roll_DEC | 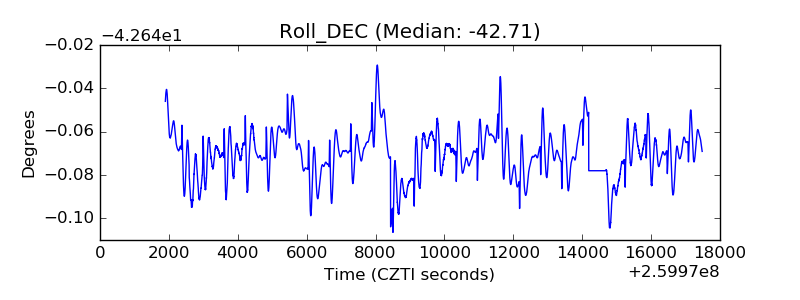 |
| _Roll_RA | 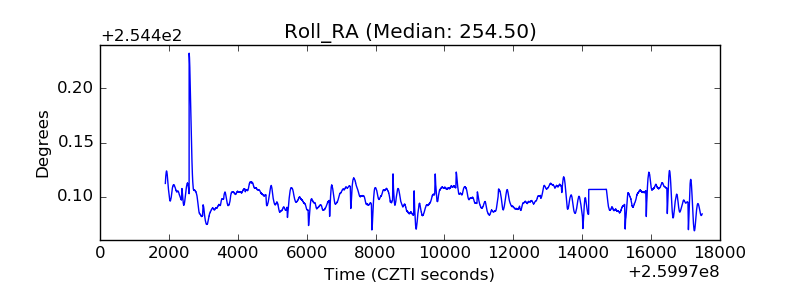 |
| Veto Counter | 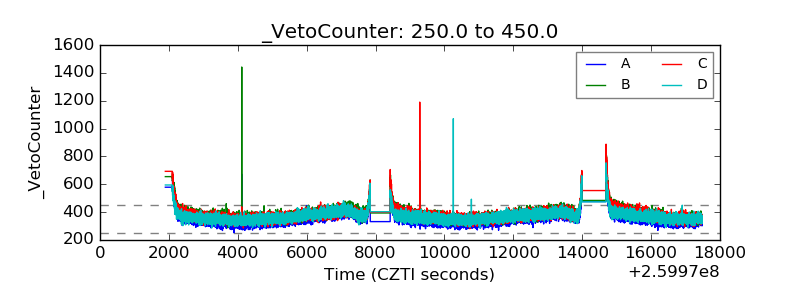 |