| Param | Original file | Final file |
|---|---|---|
| Filename | modeM0/AS1T02_020T01_9000001990_13517cztM0_level2.evt | modeM0/AS1T02_020T01_9000001990_13517cztM0_level2_quad_clean.evt |
| Size (bytes) | 1,445,112,000 | 258,125,760 |
| Size | 1.3 GB | 246.2 MB |
| Events in quadrant A | 9,891,775 | 1,623,351 |
| Events in quadrant B | 11,753,378 | 1,729,834 |
| Events in quadrant C | 10,178,447 | 1,593,133 |
| Events in quadrant D | 10,598,036 | 1,501,132 |
| Mode M0 | |||
|---|---|---|---|
| Quadrant | BADHDUFLAG | Total packets | Discarded packets |
| A | 0 | 41577 | 5 |
| B | 0 | 47495 | 4 |
| C | 0 | 41970 | 4 |
| D | 0 | 44342 | 4 |
| Mode M9 | |||
|---|---|---|---|
| Quadrant | BADHDUFLAG | Total packets | Discarded packets |
| A | 0 | 42 | 0 |
| B | 0 | 42 | 0 |
| C | 0 | 42 | 0 |
| D | 0 | 42 | 0 |
| Mode SS | |||
|---|---|---|---|
| Quadrant | BADHDUFLAG | Total packets | Discarded packets |
| A | 0 | 406 | 0 |
| B | 0 | 406 | 0 |
| C | 0 | 406 | 0 |
| D | 0 | 406 | 0 |
| Quadrant | Total seconds | Saturated seconds | Saturation percentage |
|---|---|---|---|
| A | 19899 | 194 | 0.974923% |
| B | 19899 | 298 | 1.497563% |
| C | 19899 | 143 | 0.718629% |
| D | 19899 | 224 | 1.125685% |
Noise dominated data is calculated using 1-second bins in cleaned event files. If a bin has >2000 counts, and if more than 50% of those come from <1% of pixels, then it is considered to be noise-dominated and hence unusable.
| Quadrant | # 1 sec bins | Bins with >0 counts | Bins with >2000 counts | High rate bins dominated by noise | Noise dominated (total time) | Noise dominated (detector-on time) | Marked lightcurve |
|---|---|---|---|---|---|---|---|
| A | 24130 | 19900 | 12 | 12 | 0.05% | 0.06% | 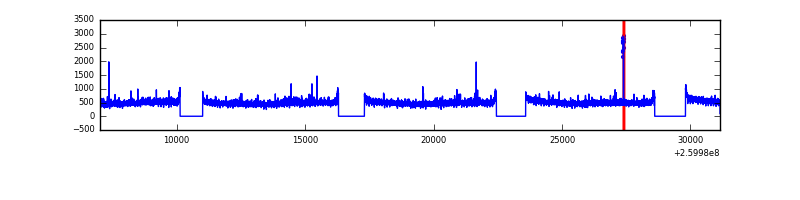 |
| B | 24130 | 19900 | 79 | 79 | 0.33% | 0.40% | 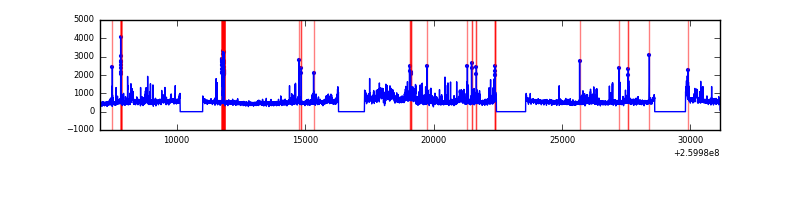 |
| C | 24130 | 19900 | 0 | 0 | 0.00% | 0.00% | 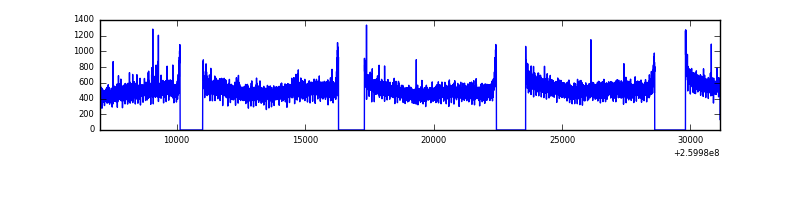 |
| D | 24130 | 19900 | 64 | 64 | 0.27% | 0.32% |  |
Top three noisy pixels from each quadrant. If the there are fewer than three noisy pixels in the level2.evt file, extra rows are filled as -1
| Pixel properties | Quadrant properties | ||||||
|---|---|---|---|---|---|---|---|
| Quadrant | DetID | PixID | Counts | Sigma | Mean | Median | Sigma |
| A | 8 | 15 | 136219 | 264.13 | 2501 | 2448 | 506.5 |
| A | 1 | 162 | 69551 | 132.49 | 2501 | 2448 | 506.5 |
| A | 15 | 69 | 33845 | 61.99 | 2501 | 2448 | 506.5 |
| B | 3 | 64 | 1575787 | 3333.11 | 2513 | 2459 | 472.0 |
| B | 0 | 197 | 123597 | 256.63 | 2513 | 2459 | 472.0 |
| B | 4 | 142 | 104273 | 215.69 | 2513 | 2459 | 472.0 |
| C | 3 | 233 | 699188 | 1254.02 | 2426 | 2439 | 555.6 |
| C | 0 | 207 | 21741 | 34.74 | 2426 | 2439 | 555.6 |
| C | 13 | 61 | 17253 | 26.66 | 2426 | 2439 | 555.6 |
| D | 8 | 195 | 747816 | 1301.64 | 2416 | 2353 | 572.7 |
| D | 2 | 136 | 308808 | 535.09 | 2416 | 2353 | 572.7 |
| D | 13 | 104 | 170145 | 292.98 | 2416 | 2353 | 572.7 |
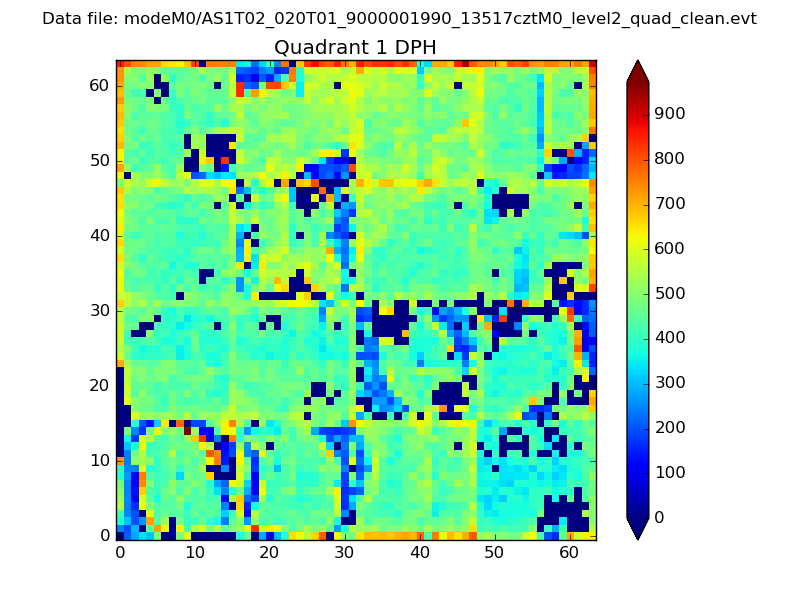
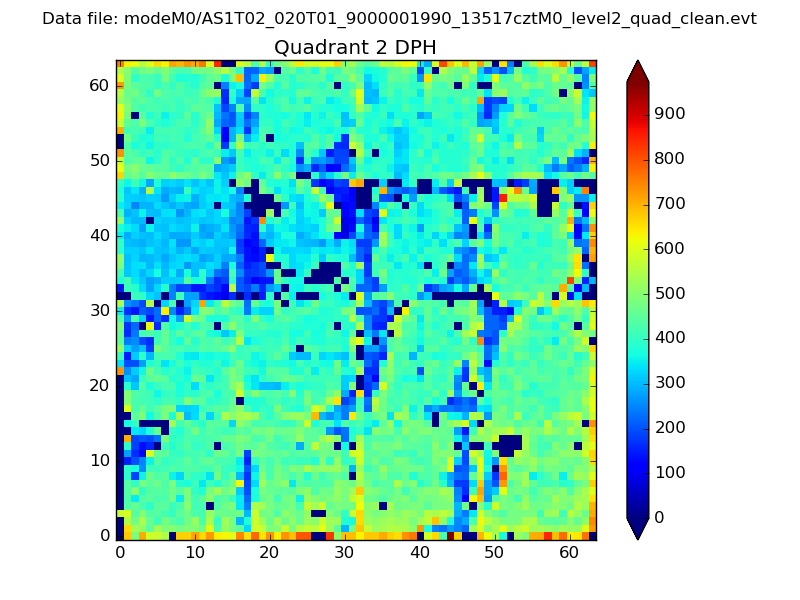
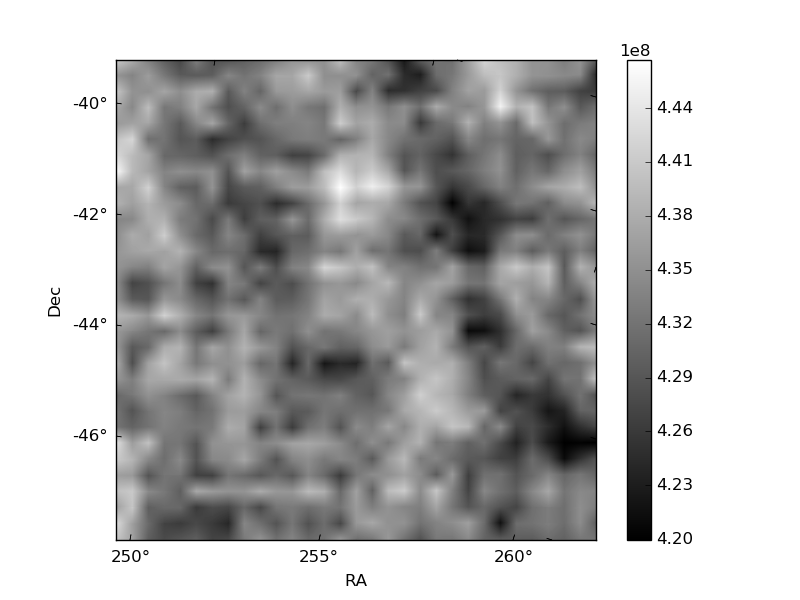
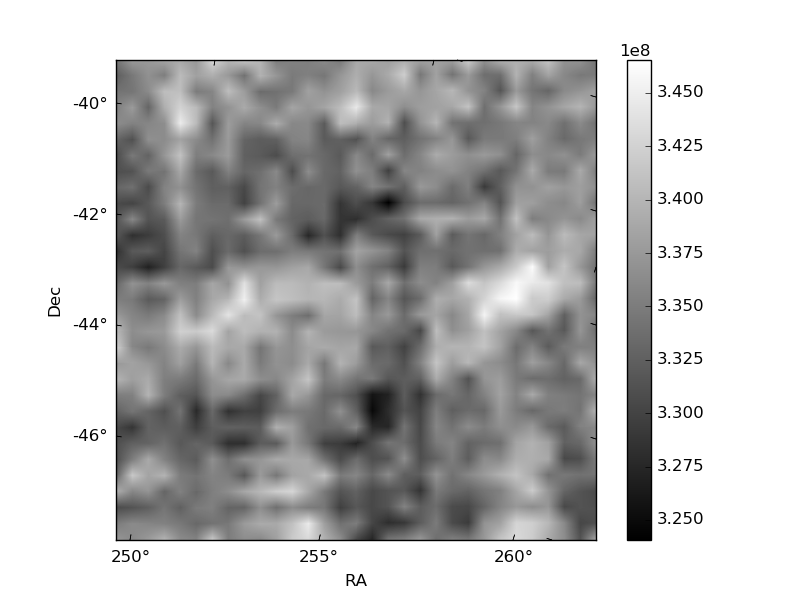
Histogram calculated using DETX and DETY for each event in the final _common_clean file
| Quadrant A | 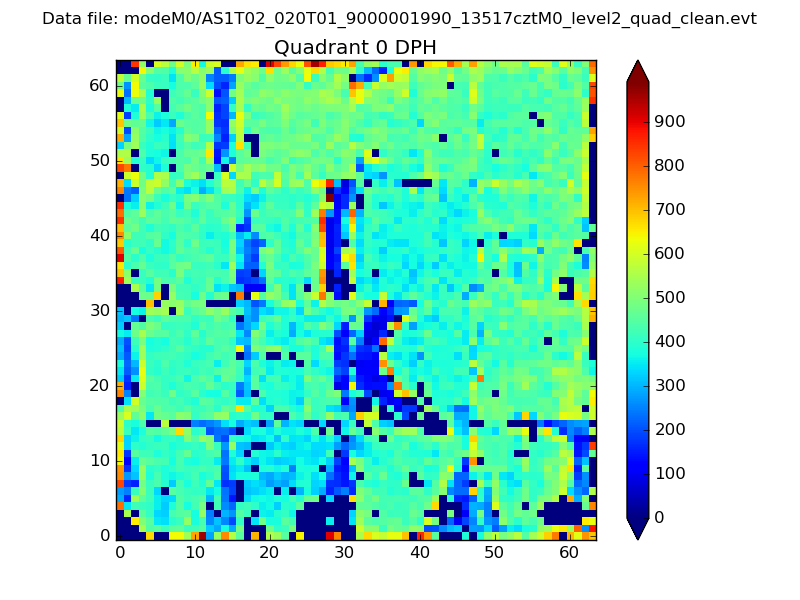 |
 |
Quadrant B |
|---|---|---|---|
| Quadrant D | 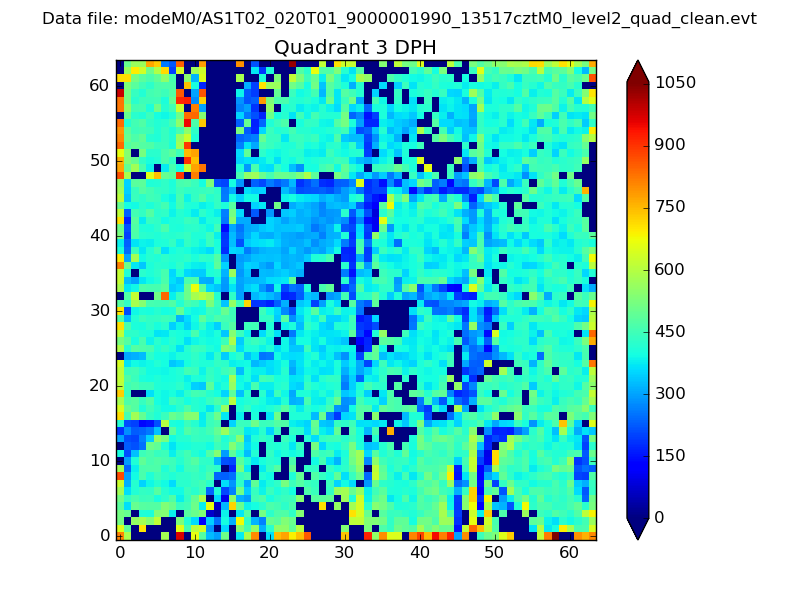 |
 |
Quadrant C |
| Plot type | Count rate plots | Images |
|---|---|---|
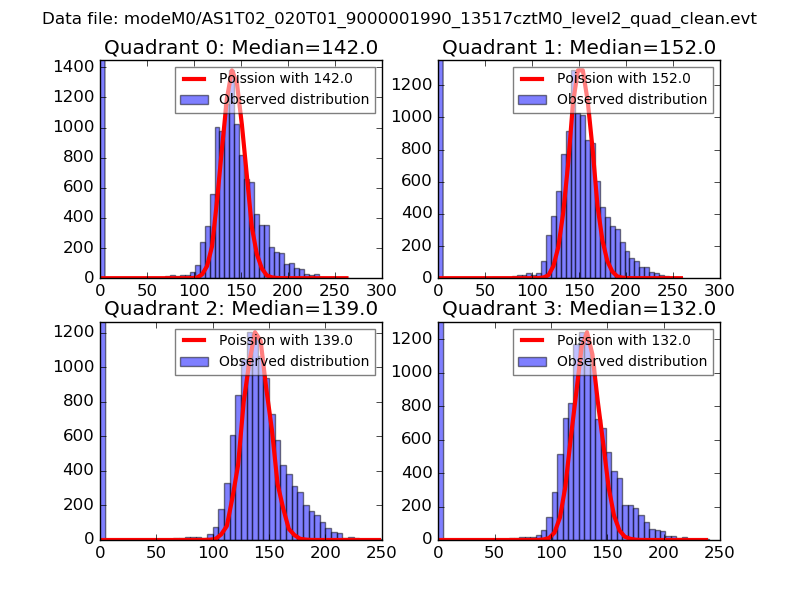
| Comparison with Poisson distribution Blue bars denote a histogram of data divided into 1 sec bins. Red curve is a Poisson curve with rate = median count rate of data. |
 |
 |
| Quadrant-wise count rates Data is divided into 100 sec bins |
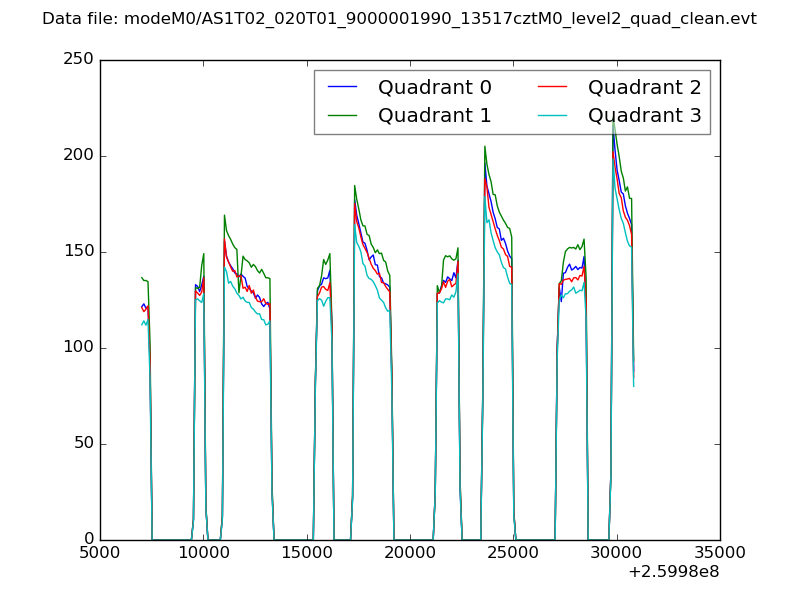 |
|
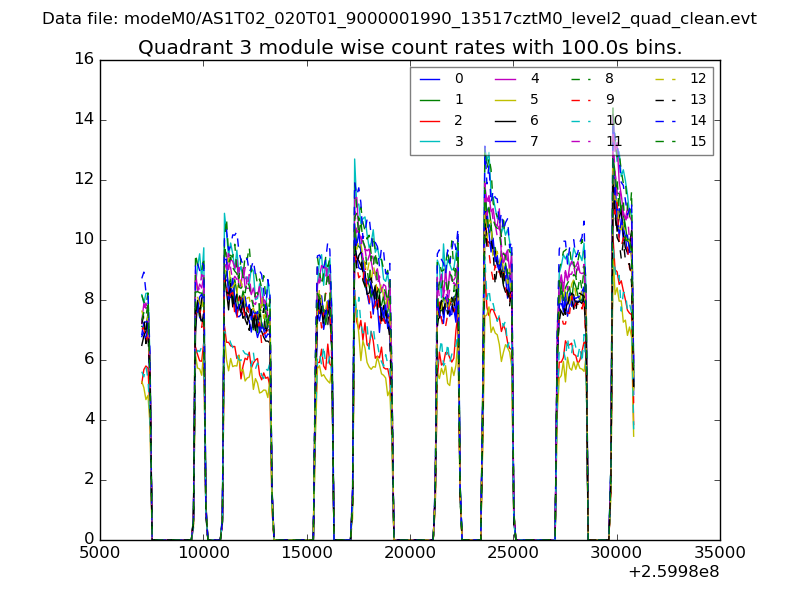
| Module-wise count rates for Quadrant A Data is divided into 100 sec bins |
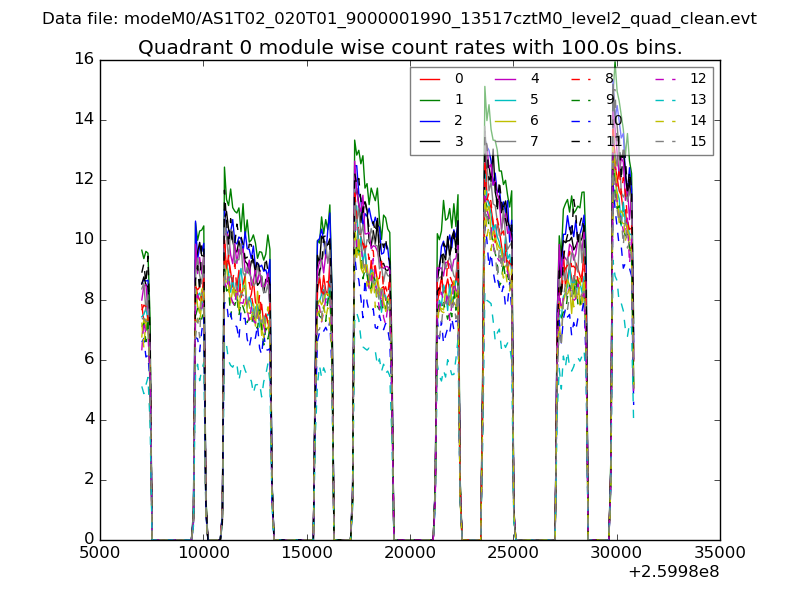 |
 |
| Module-wise count rates for Quadrant B Data is divided into 100 sec bins |
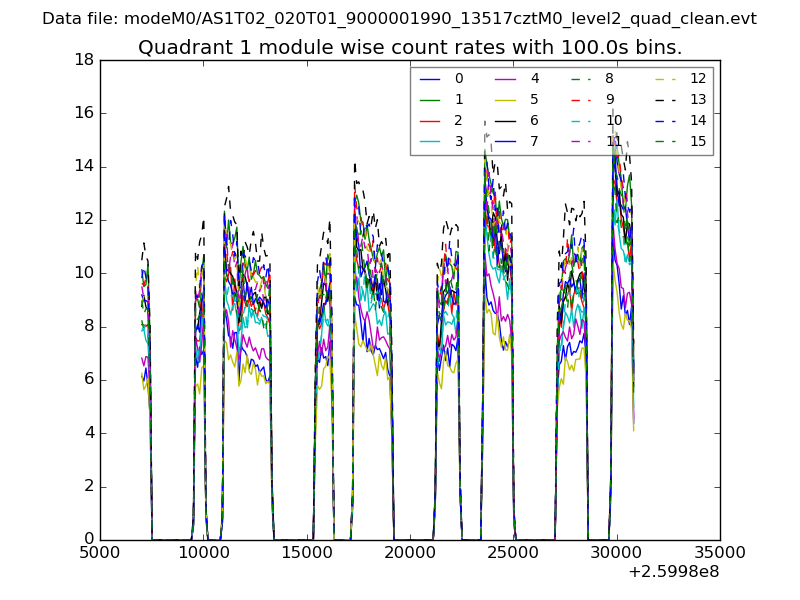 |
 |
| Module-wise count rates for Quadrant C Data is divided into 100 sec bins |
 |
 |
| Module-wise count rates for Quadrant D Data is divided into 100 sec bins |
 |
 |
| Parameter | Plot |
|---|---|
| CZT HV Monitor | 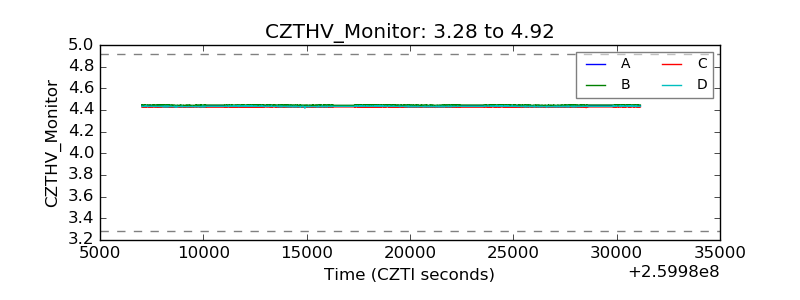 |
| D_VDD |  |
| Temperature 1 | 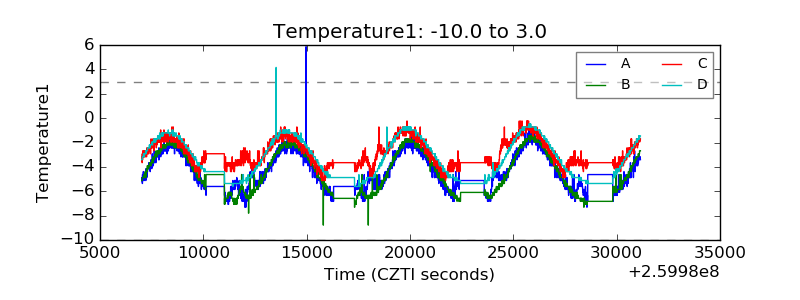 |
| Veto HV Monitor | 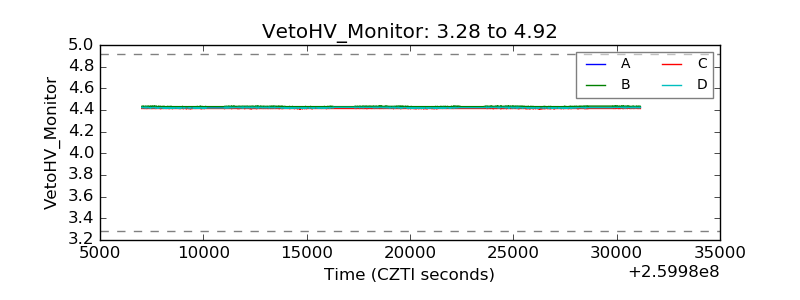 |
| Veto LLD | 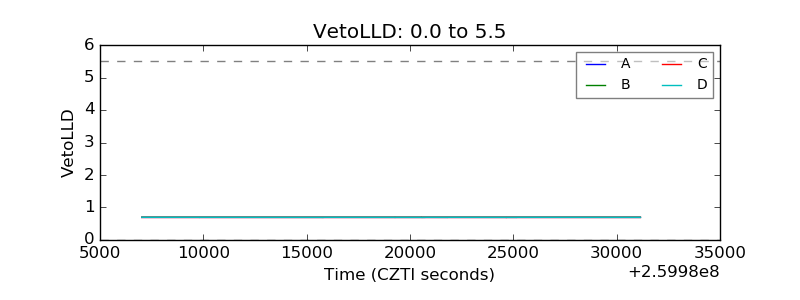 |
| Alpha Counter | 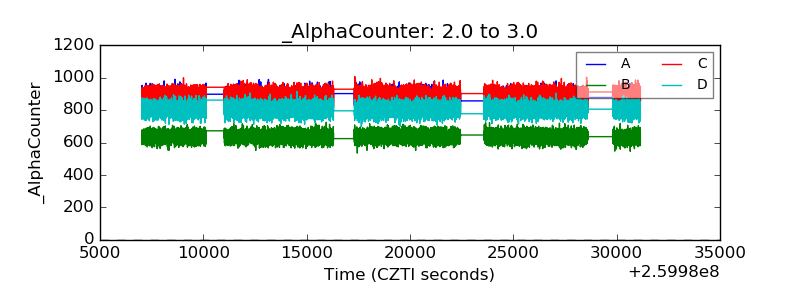 |
| _CPM_Rate | 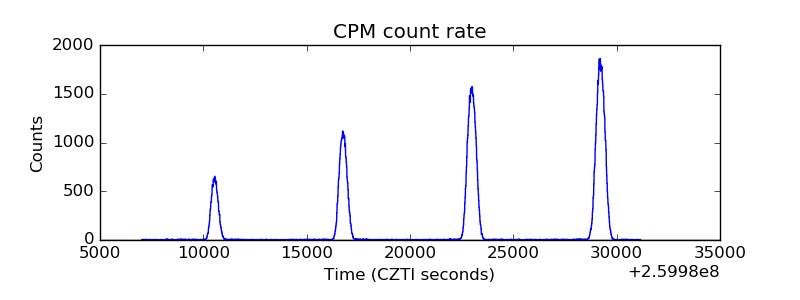 |
| CZT Counter | 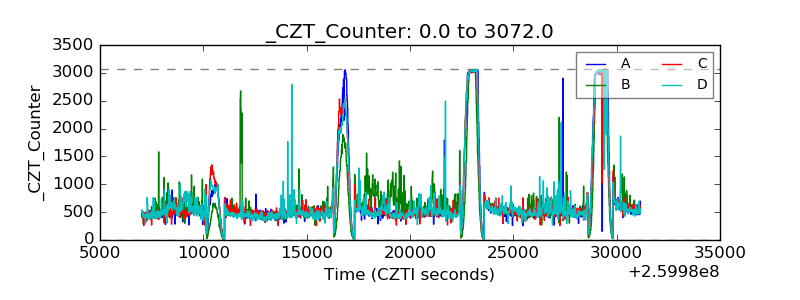 |
| +2.5 Volts monitor |  |
| +5 Volts monitor |  |
| _ROLL_ROT | 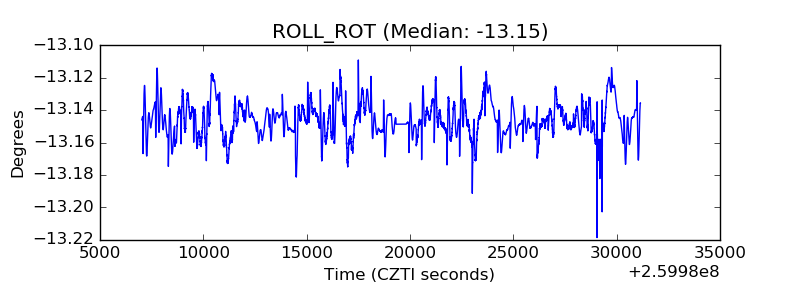 |
| _Roll_DEC | 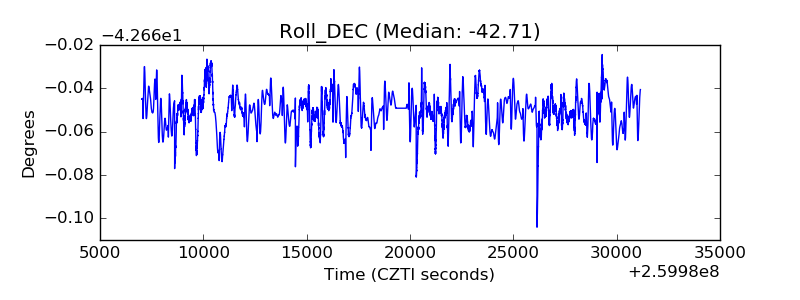 |
| _Roll_RA |  |
| Veto Counter | 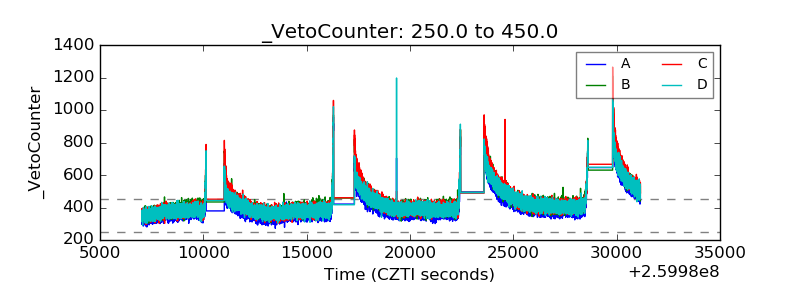 |